Publisher’s version / Version de l'éditeur:
Vous avez des questions? Nous pouvons vous aider. Pour communiquer directement avec un auteur, consultez la
première page de la revue dans laquelle son article a été publié afin de trouver ses coordonnées. Si vous n’arrivez pas à les repérer, communiquez avec nous à PublicationsArchive-ArchivesPublications@nrc-cnrc.gc.ca.
Questions? Contact the NRC Publications Archive team at
PublicationsArchive-ArchivesPublications@nrc-cnrc.gc.ca. If you wish to email the authors directly, please see the first page of the publication for their contact information.
https://publications-cnrc.canada.ca/fra/droits
L’accès à ce site Web et l’utilisation de son contenu sont assujettis aux conditions présentées dans le site LISEZ CES CONDITIONS ATTENTIVEMENT AVANT D’UTILISER CE SITE WEB.
Research Report (National Research Council of Canada. Institute for Research in Construction), 2003-09-09
READ THESE TERMS AND CONDITIONS CAREFULLY BEFORE USING THIS WEBSITE. https://nrc-publications.canada.ca/eng/copyright
NRC Publications Archive Record / Notice des Archives des publications du CNRC :
https://nrc-publications.canada.ca/eng/view/object/?id=828d4d1d-e74b-4770-8de6-5a6cee09865e https://publications-cnrc.canada.ca/fra/voir/objet/?id=828d4d1d-e74b-4770-8de6-5a6cee09865e
Archives des publications du CNRC
For the publisher’s version, please access the DOI link below./ Pour consulter la version de l’éditeur, utilisez le lien DOI ci-dessous.
https://doi.org/10.4224/20377853
Access and use of this website and the material on it are subject to the Terms and Conditions set forth at
Experimental Investigation of Ventilation Performance in a Mock-Up Open-Plan Office
Experimental Investigation of Ventilation Performance in a Mock-Up Open-Plan Office
Shaw, C.Y.; MacDonald, R.A.; Galasiu, A.D.; Reardon, J.T.; Won, D.Y.
IRC-RR-177
September 9, 2003
Experimental Investigation of Ventilation Performance in a Mock-up
Open-Plan Office
C.Y. Shaw, R.A. MacDonald, A.D. Galasiu, J.T. Reardon, and D.Y. Won
Institute for Research in Construction
National Research Council Canada, Ottawa, ONT, K1A 0R6, Canada
IRC Research Report RR-177
September 9, 2003
Experimental Investigation of Ventilation Performance in a Mock-up Open-Plan Office
IRC, National Research Council Canada
Executive Summary
The COPE study was designed to investigate the effect of open-plan office design on the indoor environment, and on the occupant satisfaction with that environment. One task of this study is to examine the effect of office design on indoor air quality, ventilation and thermal comfort
conditions. As the air diffuser layout is rarely changed, some changes in office design, such as the size and number of workstations and the partition height, may have adverse effects on indoor air quality and ventilation. It is therefore necessary to determine the effects of such design options on the ventilation performance and the indoor air quality conditions within and around individual workstations of open-plan offices. This was achieved through two experimental studies.
The first study, referred to in this report as the NRC previous study, was completed in 1992 and involved one single workstation located in one of two interconnected ventilation test rooms. The design factors considered included the type of supply air diffusers and their location relative to the workstation; the gap height at the base of the workstation partitions; the distance between the test workstation and the test-room wall, and the supply airflow rate. The results were published in ASHRAE Transactions (Volume 99, Part 2, 1993).
The current study was conducted in the NRC Indoor Environment Research Facility (IERF). This facility was furnished to simulate a windowless open-plan office. The factors considered were the number and size of workstations, the workstation partition height, and the diffuser air jet angle. The tracer gas technique was used to assess the ventilation performance for different workstation layouts in terms of ventilation air distribution, room mean-age-of-air, and thermal comfort conditions.
This report consists of two parts. The first part presents a brief description of the experimental setup and the results of the previous study. The second part describes the experiments conducted in the IERF, which was fitted with a maximum of ten workstations to represent five office design layouts. In each office design, the workstations were placed back to back in the center of the IERF. The first four office designs examined included six-3m by 3m (10ft. by 10ft.), six-3m by 1.8m (10ft. by 6ft.), eight-2.4m by 2.4m (8ft. by 8ft.), and ten-1.8m by 1.8m (6ft. by 6ft.) workstations, referred to as Test Layouts I, II, III, and IV, respectively. The partition height for these four layouts was 1.6m (64in.), while the partition height for the fifth layout examined (Test Layout V) was 2.03m (80in.). In addition, the diffuser air jet angle for the first five test layouts was 10° from the ceiling, while the diffuser angle for the last test layout (Test Layout VI) was either 45° or 90°. Test Layouts V and VI were both conducted for the ten-1.8m by 1.8m (6ft. by 6ft.) workstation design.
All workstations had the same furniture and office equipment including workbenches, chairs, bookshelves, and computers. An occupant simulator consisting of three 25-Watt light bulbs and a mixing fan, all enclosed in a rectangular metal box, was used to represent the heat output of a seated office worker.
Summary of results
Previous NRC study
Seven air diffuser layouts were tested to determine their effect on the performance of a ventilation system in a workstation. The results of this study are summarized as follows:
• All seven diffuser layouts distributed the supply air within and around the workstation area equally well.
• The air distribution pattern within the workstation was not affected by the type of diffuser (linear or square), the partition height, the gap at the base of the partitions, or the location of the supply air diffusers relative to the workstation.
• As the supply airflow rate decreased, the time required for it to mix with the air inside the workstation increased.
• Increasing the size of the room in which the workstation was located had little effect on the air distribution pattern.
Current NRC study
A total of six workstation layouts were tested to determine the ventilation air distribution within and around individual workstations. During the tests the supply airflow rate of the HVAC system was kept constant, while the outdoor air supply rate was adjusted according to the number of workstations used, in order to provide 10 L/s/person. In addition, during the last two tests, two different diffuser air jet angles were used. The results of this study are summarized as follows:
• Adequate mixing of ventilation air and room air was achieved within the test room for all workstation layouts. The tracer gas decay rate increased with the number of workstations, which simply reflects that the outdoor air supply rate increased with the number of
workstations. No noticeable effect of workstation partition height between 162.5cm (64in.) and 203cm (80in.) on the ventilation air distribution was observed.
• Within individual workstations, the ventilation air was well distributed within the occupied zone, even though for the workstation layouts with eight and more workstations, a small difference in tracer gas concentrations between the center location and the surrounding areas near the upper and lower parts of the workstation was observed. In addition, after the first ten minutes, the tracer gas concentrations in the return duct agreed closely with those in the workstation. The results suggest that varying the number of workstations from six to ten by reducing the size of each workstation from 3m by 3m (10ft. by 10ft.) to 1.8m by 1.8m (6ft. by 6ft.) has no significant effect on the ventilation air distribution within both the individual workstations and the test room (as found in the previous study) when 10 L/s/person of outdoor air is provided. Varying the partition height from 162.5cm (60in.) to 203cm (80in.) also did not produce any noticeable effect on the ventilation air distribution.
• There was no appreciable effect of diffuser air jet angle on the ventilation air distribution within the tested workstations.
• The room mean-age-of-air calculated based on the Nordtest method varied slightly among the tested workstations (i.e., Direct-, Indirect-, and No-Flow workstations) and the four reference locations. The results based on the Pulse method showed almost identical values for the four
reference locations. This suggests that the air within and around the workstations was well mixed. The room mean-age-of-air of each of the three workstations was slightly greater than that of the return air. Similarly, the room mean-age-of-air based on the average tracer gas concentrations of the four reference locations was also slightly greater than that of the return air. Although in theory the room mean-age-of-air may be a reasonable ventilation index, there are no clear guidelines to help in the interpretation of these results. A difference
between 10 to 20% in the room mean-age-of-air may not be sufficient to indicate that one test layout would provide better ventilation for a space than another layout.
• For all workstation layouts, in each individual workstation the vertical air temperature difference within the occupied zone (between 0.1m and 1.7m above the floor) was much less than 3°C, which is the maximum temperature difference recommended by ASHRAE
Standard 55-1992 to prevent local discomfort. The results also indicate that no workstation
had a vertical air temperature difference within the occupied zone greater than 3°C for each of the three diffuser air jet angles considered.
• Except for one sampling location where the measured mean air speed was between 0.3 and 0.32 m/s (at 1.1m above the floor in the Direct-Flow workstation in the test layout consisting of eight workstations), the measured mean air speed for all the other test layouts was equal to or less than 0.25 m/s.
• For the Direct-Flow workstation with a 10° diffuser angle and an assumed thermal resistance of clothing of 0.11 m2 °C/W, most test layouts with six or eight workstations had values of PMV and PPD higher than +/- 0.8 (PMV) or 20% (PPD) at 1.1 m above the floor. This suggests that under these conditions more than 20% of the occupants would find their environment somewhat uncomfortable. The values of PD (risk of draught) exceeded in the Direct-Flow workstations the recommended value of 15% (ASHRAE, 1992) for almost all the test layouts, suggesting that the occupants may experience uncomfortable draught in these workstations. The values of PMV, PPD and PD were all within their recommended values when the diffuser air jet angle was changed from 10° to 45° or 90°. For the Indirect- and No-Flow workstations, the values of PMV, PPD, and PD were all within the recommended values for all test layouts.
The results of the two studies collectively suggest that for an open-plan office layout with multiple workstations and multiple ceiling-mounted supply air diffusers, it is not necessary to have one air diffuser per workstation. This means that both workstation layout and air-diffuser layout may be more flexible than originally believed. This in turn would allow for more choices in terms of open-plan workstation placement, enabling businesses to make better use of available floor space. However, in order to ensure adequate ventilation, it is necessary to adjust the outdoor air supply based on the number of workstations to provide at least 10 L/s/person.
When increasing the occupant density by reducing the size of individual workstations, it is necessary to increase the outdoor air supply proportionally. The occupants in some workstations, particularly in workstations with a ceiling-mounted supply air diffuser, may experience some cold draughts. The results of this study suggest that problems can occur when cool supply air impinges on occupants at relatively high velocities. This can result from direct air flow or by an
unfavorable deflection of air by partitions. Consequently, before carrying out major remedial measures, simpler approaches such as changing the angle of the supply air diffuser, the furniture set-up, or the location of the occupant might lead to improvements in thermal comfort conditions.
Table Of Contents
1.0 Introduction ... 7
2.0 Previous NRC Study on Supply Air Diffuser Layouts 2.1 Test set-up ... 8
2.2 Results ... 8
2.2.1 Effect of supply air diffuser layouts ... 8
2.2.2 Effect of distance between workstation partition and test room wall ... 9
2.2.3 Effect of gap at base of partitions ... 11
2.2.4 Effect of supply airflow rate ... 11
3.0 Current NRC Study 3.1 Experimental Facility ... 12
3.2 Test Layouts ... 13
3.3 Test Methods ... 14
3.3.1 Ventilation system performance... 14
3.3.1.1 Air distribution pattern... 15
3.3.1.2 Mean-age-of-air ... 15
3.3.2 Thermal Sensation ... 15
3.3.2.1 Air speed and temperature ... 16
3.3.2.2 Globe temperature... 16
3.3.2.3 Relative humidity... 16
3.4 Test Procedures ... 16
3.5 Results ... 19
3.5.1 Ventilation performance ... 19
3.5.1.1 Stability of HVAC system operation and repeatability of test set-up and results ... 19
3.5.1.2 Effect of number, size and partition height of workstation ... 21
3.5.1.2.1 Reference locations ... 21
3.5.1.2.2 Individual workstations ... 23
3.5.1.3 Effect of diffuser air jet angle ... 28
3.5.1.3.1 Reference locations ... 28
3.5.1.3.2 Individual workstations ... 29
3.5.1.4 Room mean-age-of-air ... 33
3.5.1.4.1 Effect of number, size and partition height of workstation and diffuser air jet angle ... 33
3.5.1.4.2 Individual workstations ... 33
3.5.1.5 Thermal comfort ... 36
3.5.1.5.1 Vertical temperature and mean air speed profiles ... 36
3.5.1.5.2 Predicted mean vote (PMV), predicted percentage of dissatisfied (PPD) and risk of draught (PD) ... 36
3.5.1.5.3 Suggestions for improving thermal comfort... 41
4.0 Summary 4.1 Previous NRC study ... 42
4.2 Current NRC study ... 42
5.0 Acknowledgement ... 44
Figures
Figure 1 Workstation layout in previous NRC study ... 10
Figure 2 Supply air diffuser and return air grille layouts in previous NRC study... 10
Figure 3a Air distribution pattern for a supply airflow rate of 100 L/s ... 11
Figure 3b Air distribution pattern for a supply airflow rate of 25 L/s... 11
Figure 4 NRC Indoor Environment Research Facility (IERF)... 12
Figure 5 Configuration TLIII (8 workstations layout) ... 14
Figure 6 Tracer gas sampling locations (R1, R2, R3 and R4 reference locations)... 18
Figure 7 Tracer gas sampling locations within each workstation... 18
Figure 8 Tracer gas concentrations in the return air duct measured during Test I on three different days (Tests Ia, Ib, Ic)... 20
Figure 9 Tracer gas concentrations measured during Test I at sampling locations R1, R2, R3, and R4 on three different days (Tests Ia, Ib, Ic) ... 20
Figure 10a-10e Measured tracer gas concentration profiles at sampling locations R1, R2, R3, and R4 for five workstation layouts ... 22
Figure 11a-11f Measured tracer gas concentration profiles at sampling locations within five Direct-Flow workstation layouts and in the return air duct ... 25
Figure 12a-12f Measured tracer gas concentration profiles at sampling locations within five Indirect-Flow workstation layouts and in the return air duct... 26
Figures 13a-13f Measured tracer gas concentration profiles at sampling locations within five No-Flow workstation layouts and in the return air duct ... 27
Figure 14 Tracer gas concentrations measured at sampling locations R1, R2, R3, and R4 for three different diffuser air jet angles, 100, 450, and 900 from the ceiling... 28
Figures 15a-15d Tracer gas concentrations at sampling locations within the Direct-Flow workstations for diffuser air jet angles of 100, 450, and 900 from the ceiling ... 30
Figures 16a-16d Tracer gas concentrations at four sampling locations within the Indirect- Flow workstations for diffuser air jet angles of 100, 450, and 900 from the ceiling ... 31
Figures 17a-17d Tracer gas concentrations at sampling locations within the No-Flow workstations for diffuser air jet angles of 100, 450, and 900 from the ceiling ... 32
Figure 18a Calculated room mean-age-of-air based on tracer gas concentrations measured at reference locations R1, R2, R3 and R4 and in the return air duct ... 34
Figure 18b Calculated room mean-age-of-air for the Direct-, Indirect-, and No-Flow workstations for the test layout with six workstations (Test II) ... 35
Figure 18c Calculated room mean-age-of-air for the Direct-, Indirect-, and No-Flow workstations for the test layout with ten workstations (Test V) ... 35
Tables Table 1 Supply and return diffuser layouts in previous NRC study ... 8
Table 2 Test layouts in current NRC study ... 13
Table 3a Calculation of PMV, PPD and PD indices for various layouts of the Direct-Flow workstation ... 38
Table 3b Calculation of PMV, PPD and PD indices for various layouts of the Indirect-Flow workstation ... 39
Table 3c Calculation of PMV, PPD and PD indices for various layouts of the No-Flow workstation ... 40
Experimental Investigation of Ventilation Performance in a Mock-up Open-Plan Office
C.Y. Shaw, R.A. MacDonald, A.D. Galasiu, J.T. Reardon, and D.Y. Won
Institute for Research in Construction National Research Council Canada
September 9, 2003
1.0 Introduction
Adequate ventilation, satisfactory thermal comfort conditions and acceptable indoor air quality, together with proper lighting and acoustic conditions are essential elements in providing a safe, productive and satisfactory indoor environment for the occupants. As seven out of every ten employees work in office buildings, it is particularly important for the employers to be able to provide an acceptable indoor environment in both
government and private organizations.
In office buildings, the heating, ventilating, and air-conditioning (HVAC) system is responsible for providing ventilation and thermal comfort. As the guidelines for
designing, installing, and commissioning of HVAC systems in office buildings are well established, the systems in most office buildings are operated as designed.
In recent years, the trend in office design has shifted towards smaller workstations. A reduction in workstation size however, will be accompanied by an increase in occupant density, office furniture, equipment and occupant activities, all of which would lead to an increase of the contamination load. Discussions with building engineers and managers indicate that little or no information is available to help them to adjust the HVAC systems to accommodate such changes. The objective of this study is to determine the effect of this new trend in open-plan office design on the ventilation performance of open-plan offices.
For an open-plan office design, the factors potentially affecting the distribution of the ventilation air within the office space include the supply air diffuser layout, the
workstation partition height, the gap height at the base of the workstation partitions, the number and size of workstations, and the diffuser air jet angle. The effect of supply air diffuser layout for various types of diffusers, as well as the effect of gap height at the base of the workstation on the ventilation air distribution were systematically investigated in a previous study. Therefore, the current study mainly focused on the effect of the number and size of workstations, and the supply air diffuser jet angle on the ventilation performance. To complement the results of the current study, a brief summary of the results of the previous study is given below.
2.0 Previous NRC Study on Supply Air Diffuser Layouts
Seven supply air diffuser layouts were tested to assess their effect on the distribution of ventilation air in and around a workstation. Different gap heights at the base of the partitions and different supply-air flow rates were also tested to investigate their effect on the ventilation performance.
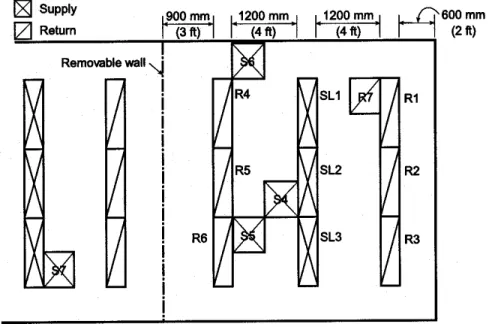
2.1 Test set-up
A workstation measuring 2.9m by 2.6m was assembled in one of two interconnected rooms in the IRC ventilation test facility (Figures 1 and 2). Each room measured 4.9m by 4.9m, and had a height of 2.9m. Each room was equipped with its own independent HVAC system, two types of return-air inlets and two types of supply-air diffusers (recessed air-light fixtures, SL, and square ceiling diffusers, S). The effect on the ventilation performance was assessed in terms of air distribution patterns, which were measured using the tracer gas technique. The supply air rate was 100 L/s, including 10 L/s of outdoor air.
2.2 Results
2.2.1 Effect of supply air diffuser layouts
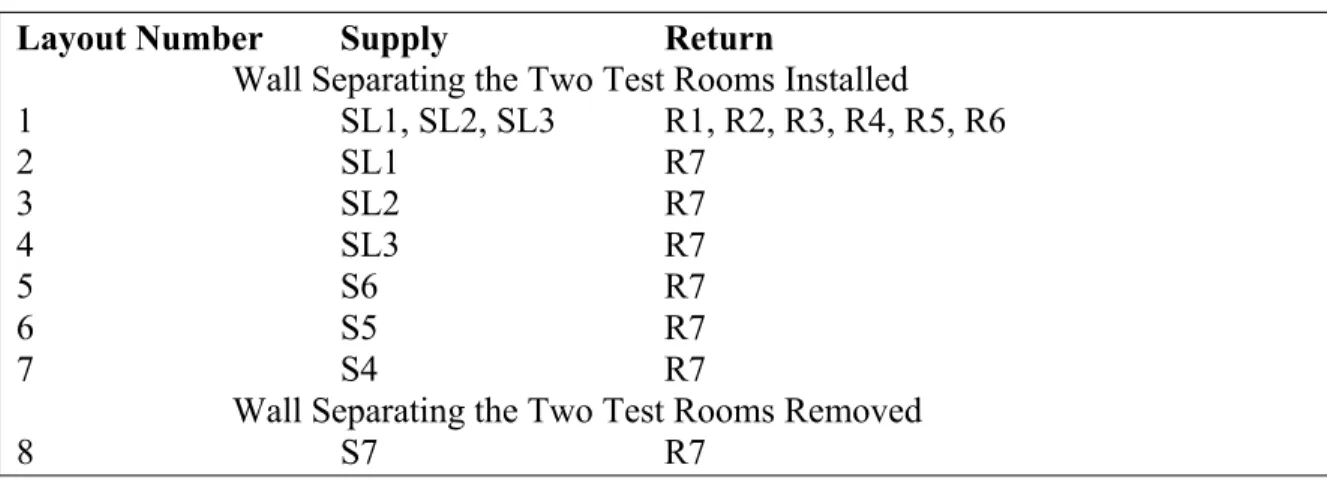
All seven diffuser layouts (Layouts 1 through 7, as shown in Figures 1 and 2, and Table 1) distributed the ventilation air equally well, both inside and outside the workstation. This was shown by the fact that the tracer gas concentrations inside and outside the workstation were essentially the same. In addition, Layout 1 was tested both with and without the workstation. The air distribution pattern without the workstation was similar to the one with the workstation in place.
Table 1 Supply and return diffuser layouts of previous NRC study
Layout Number Supply Return
Wall Separating the Two Test Rooms Installed
1 SL1, SL2, SL3 R1, R2, R3, R4, R5, R6 2 SL1 R7 3 SL2 R7 4 SL3 R7 5 S6 R7 6 S5 R7 7 S4 R7
Wall Separating the Two Test Rooms Removed
2.2.2 Effect of distance between workstation partition and test room wall
Layouts 1 to 7 were tested in one test room with the workstation located at the center. The distance between each workstation partition and the nearest test room wall was about 1m. To determine the wall effect, two tests were conducted with the dividing wall
between the two test rooms removed (the HVAC system of the second room was not in operation). The supply air diffuser of one test was identical to Layout 1 and that of the other test was located in the next room (Layout 8). Not unexpectedly, the concentration of tracer gas was lower than that with the wall in place, as the same supply-air flow rate used for the single room was now being used for the large room. The tracer gas
concentration in and around the workstation was almost uniform, indicating that the air was well mixed. The air distribution pattern within the workstation remained essentially the same as when the wall was in place.
Figure 1 Workstation layout in previous NRC study
2.2.3 Effect of gap at the base of partition
To determine the effect of a gap between the floor and the bottom of the partitions, three tests were carried out: one with no gap, one with a gap of 76mm (3in.) and one with a gap of 152mm (6in.). The air distribution pattern was found to be the same for all three
situations, suggesting that the gap height had no effect on the performance of the ventilation system.
2.2.4 Effect of supply airflow rate
To study the effect of the supply airflow rate, one diffuser layout (Layout 1) was tested three times, each with a different supply airflow rate: 100 L/s, 50 L/s and 25 L/s. The corresponding outdoor air supply rates were 20, 10 and 5 L/s. (The supply air consisted of 20% outdoor air and 80% recirculated air.)
As shown in Figures 3a and 3b, the tests revealed that the mixing time (i.e., the amount of time it takes for the tracer gas concentrations at all locations to reach the same level) increased as the airflow rate decreased. For a rate of 100 L/s, 20 to 40 minutes were required for the supply air to mix thoroughly within the workstation. Decreasing the supply rate to 25 L/s increased the mixing time to more than 4 hours.
Figure 3a Air distribution pattern for a supply airflow rate of 100 L/s
Figure 3b Air distribution pattern for a supply airflow rate of 25 L/s
3.0 Current NRC Study
3.1 Experimental Facility
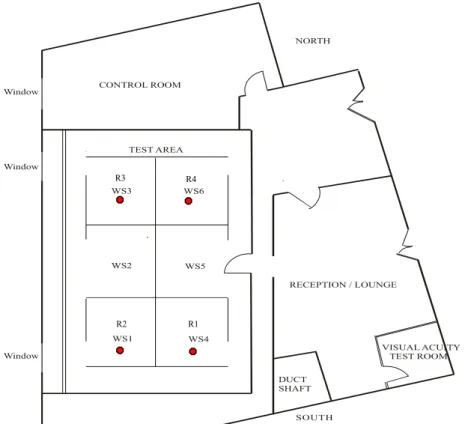
The current experiment was conducted in the NRC Indoor Environment Research Facility designed for acoustics, lighting, ventilation, and indoor air quality research (Shaw et al., 1995). As shown in Figure 4, the 12.2m by 7.3m by 2.74m high (40ft. by 24ft. by 9ft.) test area was furnished as a windowless open-plan office with six to ten workstations to simulate a typical open-plan office.
The facility has a dedicated all-air, constant volume heating, ventilation, and
air-conditioning (HVAC) system. The HVAC system is capable of providing the supply air to the test area at a constant flow rate adjustable between 0 and 1130 L/s or 15 air changes per hour, a constant temperature adjustable between 8°C and 30°C in the main supply air duct, and a constant relative humidity adjustable between 20% and 80%. It also has the flexibility of using 100% outdoor air or a mixture of outdoor and return air. The ducts are long and straight to facilitate installation of orifice plates for airflow
measurement. The facility has a 250-channel computerized data acquisition system for recording measured data, including airflow rate, temperature and relative humidity in each supply and return duct.
CONTROL ROOM NORTH DUCT SHAFT VISUAL ACUITY TEST ROOM RECEPTION / LOUNGE SOUTH WS3 WS6 WS2 WS5 WS1 WS4 Window Window Window TEST AREA R4 R3 R2 R1
3.2 Test Layouts
For this study, the test area was fitted successively with six to ten workstations to create a total of six main test layouts (TL) as shown in Table 2. Of the six test layouts, TL-I to TL-IV dealt with the number and size of the workstations, layout TL-V had a higher partition than the other test layouts, and TL-VI assessed supply air jet angles.
Table 2 Test Layouts of current NRC study
Workstation Layout Test Environment Conditions Test Layouts (TL) Diffuser Angle (from ceiling) Size m x m (ft x ft) No. of WS Partition Height cm (in) Outdoor Air Supply Rate ac/h Supply Air Rate L/s (CFM) Supply/ Return Air Temp. (°C) a 1.10 204 (432) b 1.06 205 (434) I c 10° 3x3 (10x10) 6 162.5 (64) 1.05 204 (432) 16/24 a 1.07 206 (436) b 1.09 207 (439) II c 10° 3 x 1.8 (10x6) 6 162.5 (64) 1.0 198 (419) 16/24 a 1.39 204 (432) b 1.29 194 (411) III c 10° 2.4 x 2.4 (8x8) 8 162.5 (64) 1.24 200 (424) 16/24 a 1.64 247 (523) b 1.71 252 (534) IV c 10° 1.8 x 1.8 (6x6) 10 162.5 (64) 1.70 255 (540) 16/24 V 10° 1.8 x 1.8 (6x6) 10 203 (80) 1.58 251 (532) 16/24 a 45° 1.82 261 (553) VI b 90° 1.8 x 1.8 (6x6) 10 162.5 (64) 1.61 260 (551) 16/24
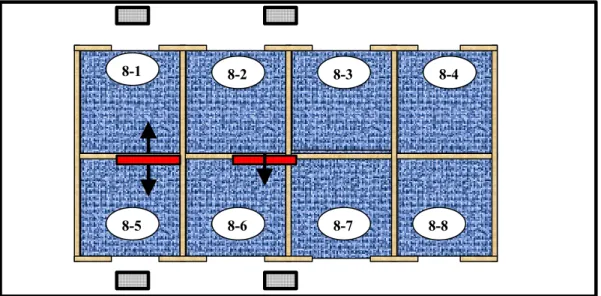
Figure 5 shows an example of test layout TL-III. Eight 2.4m by 2.4m (8ft. by 8ft.) mock-up workstations were placed inside the test area. The height of the partition was 162.5cm (64 in.). The furniture in each workstation included a workbench, a chair, and a
computer. A human body simulator was constructed for this study to simulate the
metabolic heat generation from office workers. For simplicity, the human body simulator consisted of an aluminum rectangular block, containing three 25-Watt light bulbs and a mixing fan. The rectangular block was 0.45m long × 0.4m wide × 0.9m high, which represents an adult with a surface area of 1.71 m2 (ASHRAE, 2001).
The test space had three linear supply air diffusers and four return air grills. The supply diffusers were Price Model TBD/TBD1375, with 2-3/4” (19mm) slots. The length of the diffusers were 48” (1200mm). The design flow rate was 200 cfm (100 L/s). The throws were 15 ft. at 100 fpm (4.6 m at 0.5 m/s) and 28 ft. at 50 fpm (8.5 m at 0.25 m/s) (http://www.price-hvac.com/html/index.asp). The location of the diffusers and grilles were fixed during the entire study. With such a set-up, it was possible to identify three diffuser–workstation layouts that are commonly observed in open-plan offices. They included: a Direct-Flow workstation (WS 8-5, Figure 5), representing a design where the workstation has its own supply air diffuser; an Indirect-Flow Workstation, representing a design where the supply air diffuser is located in an adjacent workstation (WS 8-2, Figure 5), and a No-Flow Workstation, representing a design where the supply air diffuser is located at least one workstation away (WS 8-4, Figure 5).
8-3 8-4
8-1
8-5 8-6 8-7 8-8
8-2
Figure 5 Configuration TLIII (8 workstations layout) 3.3 Test Methods
3.3.1 Ventilation system performance
The ventilation performance of the HVAC system in the IERF was assessed in terms of its air distribution pattern. The air distribution pattern (Shaw et al., 1991) is a measure of how quickly the ventilation air from the supply air diffusers reaches various locations in a room. It also shows how uniformly the ventilation air is distributed within the room, giving an indication of how efficiently a HVAC system distributes the ventilation air. This method has been successfully used by the NRC team to assess the ventilation performance for houses, atria, high-rise residential buildings, office buildings, and a mock-up office in a ventilation laboratory. For comparison, local mean-age-of-air and room mean-age-of-air were also calculated (NTVVS019, 1983; NTVVS047, 1985; Skaret and Sandberg, 1985; AIVC, 1990). The local mean-age-of-air is used to
supply) at a particular location in a space at a particular time. The younger the local mean-age-of-air is at a location, the more the ventilation air has reached that location. The room mean-age-of-air of a space is the average value of the local mean-ages-of-air of all locations in that space at a given time. The younger the room mean-age-of-air is in a space, the more ventilation air it has received.
3.3.1.1 Air distribution pattern
The air distribution pattern in selected workstations was measured by injecting a small amount of SF6 (110ml) into the supply air duct. Immediately following injection, tracer gas samples were taken at regular time intervals at four reference locations within the test room, and at four individual locations in each of the Direct-, Indirect-, and No-Flow workstations. The measured tracer gas concentrations at each sampling location were then plotted against time. The time in which the concentrations at all locations reach a single level can be used to assess the effectiveness of a HVAC system in distributing the ventilation air.
3.3.1.2 Mean-Age-of-Air
The Nordtest method was used to calculate the local mean-age-of-air (Skaret and Sandberg, 1985; NTVVS019, 1988) using the concentration profiles measured at the sampling locations within individual workstations. The average value of the measured concentrations at the four reference sampling locations was used to calculate the room mean-age-of-air. The concentration profile measured in the return duct was also used to calculate the room mean-age-of-air (NTVVS047, 1985). However, to carry out the calculation using the Nordtest method, the initial tracer gas concentration is necessary. Yet, as the initial tracer gas concentration cannot be measured directly, it can only be estimated from the measured concentration data. For comparison, a new calculation method based on pulse injection of tracer gas was derived to determine the local mean-age-of-air.
3.3.2 Thermal Sensation
The thermal sensation was assessed in terms of predicted mean vote (PMV), predicted percentage of dissatisfied (PPD), and risk of draught or percentage feeling draught (PD). The PMV is an index that is commonly used to predict the mean value of the votes of a large group of people on a seven-point thermal sensation scale (ISO, 1994; ASHRAE, 1992 and 2001). The PPD index is used to predict the mean value of the thermal votes of a large group of people exposed to the same environment. The functional relationship between the two indices is given by the equation:
PPD = 100 - 95 • exp [- (0.00353•PMV4 + 0.2179•PMV2)]
The PMV-PPD model is widely used and accepted for design and field assessment of thermal comfort conditions.
The PMV and PPD indices ignore the effect of air draught as an independent source of discomfort. The PD index is therefore used to assess occupants’ tolerance to draught, which is defined as unwanted local cooling of the body by air movement (ASHRAE, 1992 and 2001). The PD index is directly related to the air temperature (Ta), mean air speed (V), and the turbulence intensity (Tu) by the equation:
PD = (34-Ta) (V-0.05)0.62• (0.37•V•Tu + 3.14)
The dry-bulb temperature, mean radiant temperature and other parameters used to calculate the PMV, PPD, and PD indices were measured at various locations as follows: 3.3.2.1 Air speed and temperature
Four omnidirectional hot-film probes (Dantec) were used to measure the vertical air speed profile in each of the Direct-, Indirect-, and No-Flow workstations. Three of the probes were attached to a wood stand beside the chair of a simulated occupant at heights of 0.1m, 0.6m, and 1.7m above the floor, representing the ankle and hand level of a seated person, and the head level of a standing person, respectively. The fourth probe (1.1m above the floor) was located in the center of the workstation. These probes were calibrated using a bench top wind tunnel prior to measurements. According to the user manual, the hot-film probes can be used to measure velocity fluctuations. However, some researchers suggest that the measured results may be unreliable, because the probe is insensitive to high frequency velocity fluctuations due to its large size (about 0.003m in diameter) (Chen et al., 1998).
The thermistors on the probe were used to measure the dry-bulb temperature. 3.3.2.2 Globe temperature
The globe temperatures were measured using globe temperature probes. These probes were also attached to the air speed measurement stand at heights of 1.1m and 1.7m only. These measurements were used to estimate the mean radiant temperature necessary in the calculation of the PMV indices.
3.3.2.3 Relative humidity
The relative humidity was measured in the return duct.
3.4 Test Procedures
After setting the required test conditions as outlined in Table 2 for a planned test, the test space was vented overnight. In addition to the HVAC system, portable exhaust fans were used to flush out the residual tracer gas left from the previous test. In the morning of a scheduled test, measurements were conducted to verify the outdoor air supply rate, supply airflow rate, and the flow rates of the tracer gas sampling pumps. A series of measurements were then taken to determine the background tracer gas concentration,
When all the preparation work had been completed, a small amount of tracer gas
(approximately 110ml of SF6) was injected into the main supply duct. Immediately after injection, tracer gas samples were taken at a total of 18 locations and the concentrations were determined using two automated tracer gas sampling systems, each with a 16-port multiposition sampling valve and a tracer gas detector. The 18 sampling locations included one outdoor air, one return air, four reference locations (R1, R2, R3, and R4, as shown in Figure 6), and four locations within each of the three test workstations (i.e., Center, Q2, Q7, and Q8, as shown in Figure 7). One tracer gas sampling system was allocated to only two sampling locations (the return duct and the center point of one workstation) in order to allow for a two-minute sampling interval. The other sampling system was used to take samples at the remaining 16 locations at 16-minute intervals. As shown in Table 2, Tests I through IV were each repeated three times to allow the tracer gas concentrations at the center point of each of the three workstations of interest (Direct-Flow, Indirect-Flow and No-Flow) to also be measured once at two-minute intervals per test. The tracer gas concentration profile of the return duct was used as a guide to estimate the initial concentration at the four reference locations, and the center point concentration profile of the workstation was used to estimate the initial
R4 R3 R2
R1
Figure 6 Tracer gas sampling locations (R1, R2, R3 and R4 reference locations) as indicated on the floor plan of the test room (Figure 4).
Q-1 Q-2 Q-3 Q-4 Q-5 Q-7 Q-8 Q-6 CL X Y Z
3.5 Results
Six tests (Table 2 and Figure 5) were conducted in a simulated open-plan office fitted with six, eight, or ten workstations. Of the six tests, the first four were designed to determine the effect of increasing the workstation density on the ventilation air distribution and thermal comfort conditions. Each of the four tests was repeated three times to assess the stability of the test room HVAC system operation and the repeatability of the tracer gas measurements. Tests V and VI were intended to assess the effects of the workstation partition height and supply air jet angle, respectively. The results are
discussed below.
3.5.1 Ventilation performance
3.5.1.1 Stability of HVAC system operation and repeatability of test set-up and results Tests I, II, III, and IV were each repeated three times on three different days to assess the stability of the HVAC system in controlling the ventilation and supply airflow rates, and the repeatability of the tracer gas concentration measurements. Table 2 shows that the measured ventilation rates for Tests Ia, Ib, and Ic were 1.1, 1.06, and 1.05 ac/h and the corresponding supply airflow rates were 204, 205, and 204 L/s, respectively. Similar results, as shown in Table 2, were obtained for Tests II, III, and IV. As an example, Figure 8 shows the profile of the tracer gas concentration measured in the return duct for Tests Ia, Ib, and Ic. The results indicate that the concentration profiles for these three tests were very close. The concentration profile for Test Ic was slightly lower than that for the other two tests however; as shown in Figure 8, the measured tracer gas
concentrations for Tests Ia, Ib, and Ic at the 10th minute were 225, 204, and 182 ppb, respectively, indicating a difference of about 10% of the center value, which is considered to be within the measurement accuracy.
Figure 9 shows the tracer gas concentrations measured at the four reference locations, R1, R2, R3, and R4 (Figure 6) for Tests Ia, Ib and Ic. Again, the results suggest that
measured tracer gas concentrations agreed closely with each other.
The results of Figures 8 and 9 collectively demonstrate that the operation of the HVAC system was stable and the tracer gas concentration measurements were repeatable.
0 25 50 75 100 125 150 175 200 225 250 275 300 0 25 50 75 100 125 150 175 200 225 250
Time from injection [min]
S F 6 C oncent ra ti on [ ppb] RA Test Ia RA Test Ib RA Test Ic
Figure 8 Tracer gas concentrations in the return air duct measured during Test I on three different days (Tests Ia, Ib and Ic).
0 50 100 150 200 250 300 0 25 50 75 100 125 150 175 200 225 250
Time from injection [min]
S F 6 C oncent ra ti on [ ppb] R1-Test Ia R1-Test Ib R1-Test Ic R2-Test Ia R2-Test Ib R2-Test Ic R3-Test Ia R3-Test Ib R3-Test Ic R4-Test Ia R4-Test Ib R4-Test Ic
Figure 9 Tracer gas concentrations measured during Test I at sampling locations R1, R2, R3, and R4 on three different days (Tests Ia, Ib, Ic).
3.5.1.2 Effect of number, size and partition height of workstation
Tests I, II, III, IV, and V examined the effects of the number, size, and partition height of workstations on the ventilation air distribution (Table 2). The workstation layouts
examined included two six-workstation layouts, one eight-workstation layout, and two ten-workstation layouts. Except for Test V, which had a 203cm (80in.) partition height, all other tests were conducted with a 162.5cm (64in.) partition height. The results are discussed below.
3.5.1.2.1 Reference locations
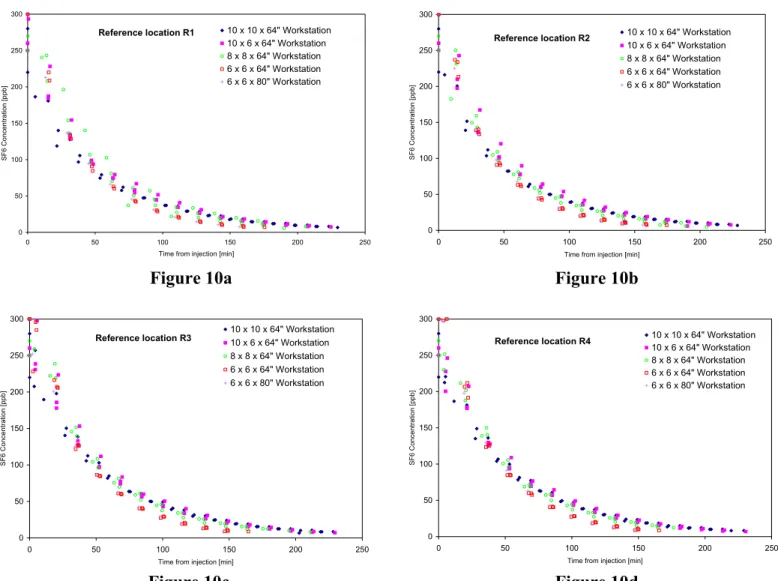
Figures 10a, 10b, 10c, and 10d show the measured tracer gas concentration profiles at sampling locations R1, R2, R3, and R4, respectively, for five workstation layouts (Table 2 - Tests I, II, III, IV, and V). The results indicate that the measured tracer gas concentration data for each workstation layout decreased with time, following closely an exponential decay function. The tracer gas concentration decay curves for the two ten-workstation layouts, one with a 162.5cm (64in.) partition height (Test IV), and the other with a 203cm (80in.) partition height (Test V), were almost identical. The tracer gas concentration decay curves for the two six-workstation layouts (Tests I and II) were also similar. As the amount of tracer gas used in each test was constant and the outdoor air supply increased with the number of workstations, the decay rate for the two ten-workstation layouts was the greatest, followed by the eight-ten-workstation layout and the two six-workstation layouts.
0 50 100 150 200 250 300 0 50 100 150 200 250
Time from injection [min]
S F 6 C onc ent rat ion [ ppb] 10 x 10 x 64" Workstation 10 x 6 x 64" Workstation 8 x 8 x 64" Workstation 6 x 6 x 64" Workstation 6 x 6 x 80" Workstation Reference location R1 0 50 100 150 200 250 300 0 50 100 150 200 250
Time from injection [min]
S F 6 C onc ent rat ion [ ppb] 10 x 10 x 64" Workstation 10 x 6 x 64" Workstation 8 x 8 x 64" Workstation 6 x 6 x 64" Workstation 6 x 6 x 80" Workstation Reference location R2
Figure 10a Figure 10b
Figure 10c Figure 10d 0 50 100 150 200 250 300 0 50 100 150 200 250
Time from injection [min]
S F 6 C onc ent rat ion [ ppb] 10 x 10 x 64" Workstation 10 x 6 x 64" Workstation 8 x 8 x 64" Workstation 6 x 6 x 64" Workstation 6 x 6 x 80" Workstation Reference location R3 0 50 100 150 200 250 300 0 50 100 150 200 250
Time from injection [min]
S F 6 C onc ent rat io n [ ppb] 10 x 10 x 64" Workstation 10 x 6 x 64" Workstation 8 x 8 x 64" Workstation 6 x 6 x 64" Workstation 6 x 6 x 80" Workstation Reference location R4
Figures 10a, b, c, d Measured tracer gas concentration profiles at sampling locations R1, R2, R3, and R4 for five workstation layouts.
For comparison, the concentration profiles shown in Figures 10a through 10d were plotted on the same graph in Figure 10e. As shown, for each workstation layout the tracer gas concentrations profiles at the four reference locations were almost identical. 0 50 100 150 200 250 300 0 50 100 150 200 250 Time [min] SF6 Concentration [ppb] 10 x 10 x 64" Workstation 10 x 6 x 64" Workstation 8 x 8 x 64" Workstation 6 x 6 x 64" Workstation 6 x 6 x 80" Workstation
Four Reference Locations per Workstation size
Figure 10e Measured tracer gas concentration profiles at sampling locations R1, R2, R3, and R4 for five workstation layouts.
Figures 10a through 10e suggest that adequate mixing of ventilation air and room air was achieved within the test room for each workstation layout. The tracer gas decay rate increased with the number of workstations, which simply reflects that the outdoor air supply increased with the number of workstations. Based on one test, no noticeable effect of workstation partition height between 162.5cm (64in.) and 203cm (80in.) on the ventilation air distribution was observed.
3.5.1.2.2 Individual workstations
Figures 11a, b, c, d, e, and f show the tracer gas concentrations measured at four
sampling locations within the Direct-Flow workstation (Figures 5 and 7) for each of the five workstation layouts. For the two six-workstation layouts (Tests I and II,
Figures 11a, 11b), the results indicate that the measured tracer gas concentrations at the four sampling locations within each workstation were essentially indistinguishable. For the other three workstation layouts including the two ten-workstation layouts with
different partition heights, a small difference in the tracer gas concentrations between the center location (CL) and the other three sampling locations within the workstation was observed (Test III, IV and V, Figures 11c,11d). However, the maximum difference in the measured concentrations between any two sampling locations after the first ten minutes, was about 10% of the center value, which is within the tracer gas measurement accuracy.
For comparison, the tracer gas concentrations measured in the return air duct were also included in Figures 11a through 11e. As shown, in all cases after the first ten minutes the maximum difference in tracer gas concentrations between the return air duct and each of the four sampling locations located within the workstation was no more than 10%, suggesting that the tracer gas concentration in the return air duct agreed closely with those in the workstation.
Similar results were observed for the Indirect-Flow and No-Flow workstations as shown in Figures 12a through 12f, and Figures 13a through 13f.
The above results collectively suggest that varying the number of workstations from six to ten by reducing the size of each workstation from 3m by 3m (10ft. by 10ft.) to 1.8m by 1.8m (6ft. by 6ft.) has no significant effect on the ventilation air distribution within both the entire test room and the individual workstations. Varying the partition height from 162.5cm (64in.) to 203cm (80in.) also did not produce any noticeable effect on the ventilation air distribution. Because the extreme partition height of 203cm (80in.) had no effect, no other partition heights were tested.
0 50 100 150 200 250 300 0 50 100 150 200 250
Time from injection [min]
S F 6 C onc ent rat ion [ ppb] Test point Q2 Test point Q7 Test point Q8 Return Air Center point Direct Flow 10' x 10' x 64" Workstation 0 50 100 150 200 250 300 0 50 100 150 200 250
Time from injection [min]
S F 6 C onc ent rat ion [ ppb] Test point Q2 Test point Q5 Test point Q7 Return Air Center Point Direct Flow 10' x 6' x 64" Workstation
Figure 11a Figure 11b
Figure 11c Figure 11d
Figure 11e Figure 11f
0 50 100 150 200 250 300 0 50 100 150 200 250
Time from injection [min]
S F 6 C onc ent rat ion [ ppb] Test point Q2 Test point Q5 Test point Q7 Return Air Center point Direct Flow 8' x 8' x 64" Workstation 0 50 100 150 200 250 300 0 50 100 150 200 250
Time from injection [min]
S F 6 C onc ent rat ion [ ppb] Test point Q2 Test point Q5 Test point Q7 Return Air Center Point Direct Flow 6' x 6' x 64" Workstation 0 50 100 150 200 250 300 0 50 100 150 200 250
Time from injection [min]
S F 6 C onc ent rat ion [ ppb] Test point Q3 Test point Q4 Test point Q5 Return Air Direct Flow 6' x 6' x 80" Workstation 0 50 100 150 200 250 300 0 50 100 150 200 250
Time from injection [min]
S F 6 C onc ent rat ion [ ppb] 10 x 10 x 64" Workstation 10 x 6 x 64" Workstation 8 x 8 x 64" Workstation 6 x 6 x 64" Workstation 6 x 6 x 80" Workstation
Direct Flow Workstations
Figures 11a,b,c,d,e,f Measured tracer gas concentration profiles at sampling locations within five Direct-Flow workstation layouts and in the return air duct.
0 50 100 150 200 250 300 0 50 100 150 200 250
Time from injection [min]
S F 6 Concentrati on [ppb] Test point Q2 Test point Q7 Test point Q8 Return Air Indirect Flow 10' x 10' x 64" Workstation 0 50 100 150 200 250 300 0 50 100 150 200 250
Time from injection [min]
S F 6 C oncentration [ppb] Test point Q1 Test point Q6 Test point Q8 Return Air Center Point Indirect Flow 10' x 6' x 64" Workstation
Figure 12a Figure 12b
Figure 12c Figure 12d
Figure 12e Figure 12f
0 50 100 150 200 250 300 0 50 100 150 200 250
Time from injection [min]
S F 6 Concentrati on [ppb] Test point Q1 Test point Q6 Test point Q8 Return Air Center point Indirect Flow 8' x 8' x 64" Workstation 0 50 100 150 200 250 300 0 50 100 150 200 250
Time from injection [min]
S F 6 Concentrati on [ppb] Test point Q1 Test point Q6 Test point Q8 Return Air Center Point Indirect Flow 6' x 6' x 64" Workstation 0 50 100 150 200 250 300 0 50 100 150 200 250
Time from injection [min]
S F 6 Concentrati on [ppb] Test point Q3 Test point Q4 Test point Q5 Return Air Indirect Flow 6' x 6' x 80" Workstation 0 50 100 150 200 250 300 0 50 100 150 200 250
Time from injection [min]
S F 6 Concentrati on [ppb] 10 x 10 x 64" Workstation 10 x 6 x 64" Workstation 8 x 8 x 64" Workstation 6 x 6 x 64" Workstation 6 x 6 x 80" Workstation
Indirect Flow Workstations
Figures 12a,b,c,d,e,f Measured tracer gas concentration profiles at sampling locations within five Indirect-Flow workstation layouts and in the return air duct.
0 50 100 150 200 250 300 0 50 100 150 200 250
Time from injection [min]
S F 6 Concentrati on [ppb] Test point Q2 Test point Q7 Test point Q8 Return Air No Flow 10' x 10' x 64" Workstation 0 50 100 150 200 250 300 0 50 100 150 200 250
Time from injection [min]
S F 6 Concentrati on [ppb] Test point Q3 Test point Q4 Test point Q5 Return Air Center Point No Flow 10' x 6' x 64" Workstation
Figure 13a Figure 13b
Figure 13c Figure 13d
Figure 13e Figure 13f
0 50 100 150 200 250 300 0 50 100 150 200 250
Time from injection [min]
S F 6 Concentrati on [ppb] Test point Q3 Test point Q4 Test point Q5 Return Air Center point No Flow 8' x 8' x 64" Workstation 0 50 100 150 200 250 300 0 50 100 150 200 250
Time from injection [min]
S F 6 Concentrati on [ppb] Test point Q3 Test point Q4 Test point Q5 Return Air Center Point No Flow 6' x 6' x 64" Workstation 0 50 100 150 200 250 300 0 50 100 150 200 250
Time from injection [min]
S F 6 Concentrati on [ppb] Test point Q3 Test point Q4 Test point Q5 Return Air Center Point No Flow 6' x 6' x 80" Workstation 0 50 100 150 200 250 300 0 50 100 150 200 250
Time from injection [min]
S F 6 Concentrati on [ppb] 10 x 10 x 64" Workstation 10 x 6 x 64" Workstation 8 x 8 x 64" Workstation 6 x 6 x 64" Workstation 6 x 6 x 80" Workstation No Flow Workstations
Figures 13a,b,c,d,e,f Measured tracer gas concentration profiles at sampling locations within five No-Flow workstation layouts and in the return air duct.
3.5.1.3 Effect of diffuser air jet angle
The effect of diffuser air jet angle on the ventilation air distribution was investigated on the layout with ten-workstations (Tests IV and VI). The partition height was 162.5cm (64in.). Three diffuser jet angles were examined: 10°, 45°, and 90°from the ceiling. The results are discussed below.
3.5.1.3.1 Reference locations
Figure 14 shows the tracer gas concentrations measured at sampling locations R1, R2, R3, and R4 for three different diffuser air jet angles, 10°, 45°, and 90° from the ceiling. As shown, for each diffuser jet angle, the measured tracer gas concentrations at the four sampling locations were almost the same approximately 30 minutes after the
measurement started. This suggests that the ventilation air in the test room mixed well with the room air regardless of the diffuser air jet angle. The results also show that while the tracer gas concentrations for the 10° and 90° diffuser air jets agreed closely with each other, the measured concentrations for the 45°diffuser air jetwere lower than those of the other two. This difference simply reflects the fact that the outdoor air supply rate for the 45°diffuser air jet (1.82 ac/h; Table 2, test VIa) was greater than that of the other two cases (Table 2, Tests IVa,b,c and VI b).
0 50 100 150 200 250 300 0 50 100 150 200 250
Time from injection [min]
SF6 Concentration [ppb]
Diffuser angle 10 degrees Diffuser angle 90 degrees Diffuser angle 45 degrees
Four Reference Locations per diffuser angle 6' x 6' x 64" Workstations
Figure 14 Tracer gas concentrations measured at sampling locations R1, R2, R3, and R4 for three different diffuser air jet angles, 10°, 45°, and 90° from the ceiling.
3.5.1.3.2 Individual workstations
Figures 15a, b, and c show the tracer gas concentrations measured at the four sampling locations inside the Direct-Flow workstation for diffuser air jet angles of 10°, 45°, and 90°, respectively. For comparison, the measurements taken in the return duct were also included. For a diffuser air jet angle of 10° (Figure 15a), adequate mixing between the ventilation air and the room air was achieved, as evidenced by the good agreement among the measured tracer gas concentrations at all sampling locations, even though a slight systematic difference in the measurements between the center location and the other three locations was observed. The tracer gas concentrations in the return duct agreed closely with the measurements obtained in the workstation.
For the 45°and 90°diffuser air jets (Figure 15b and c), an even better agreement in the tracer gas concentrations among the four sampling locations inside the workstation was obtained when compared to that for the 10° air jet. The results also show that the tracer gas concentration in the return air duct was slightly greater than that in the workstation for both the 45°and 90°diffuser air jets.
Figure 15d shows the tracer gas concentration profiles for all the three diffuser jet angles and indicates a good agreement between the 10°and 90°cases. Similarly to the result obtained for the reference locations, the concentrations measured within the workstation for the 45°diffuser air jet were lower than those for the other two angles considered, due to the difference in outdoor air supply rate (Table 2, Tests IV and VI).
The above results collectively suggest that adequate mixing between the ventilation air and the room air in the tested workstations was achieved and no appreciable effect of diffuser air jet angle on the ventilation air distribution within the workstation was observed.
Similar results, as presented in Figures 16a, b, c, d, and Figures 17a, b, c, d, were observed for the Indirect-Flow and No-Flow workstations.
0 50 100 150 200 250 300 0 50 100 150 200 250
Time from injection [min]
S F 6 Concentrati on [ppb] Test point Q2 Test point Q5 Test point Q7 Return Air Center Point Direct Flow 6' x 6' x 64" Workstation Diffuser angle 10 degrees
0 50 100 150 200 250 300 0 50 100 150 200 250
Time from injection [min]
S F 6 Concentrati on [ppb] Test point Q2 Test point Q5 Test point Q7 Return Air Center Point Direct Flow 6' x 6' x 64" Workstation Diffuser angle 45 degrees
Figure 15a Figure 15b
Figure 15c Figure 15d 0 50 100 150 200 250 300 0 50 100 150 200 250
Time from injection [min]
S F 6 Concentrati on [ppb] Test point Q2 Test point Q5 Test point Q7 Return Air Center Point Direct Flow 6' x 6' x 64" Workstation Diffuser angle 90 degrees
0 50 100 150 200 250 300 0 50 100 150 200 250
Time from injection [min]
S
F
6 Concentrati
on [ppb]
Diffuser angle 10 degrees Diffuser angle 90 degrees Diffuser angle 45 degrees
Direct Flow Workstations 6' x 6' x 64"
Figures 15a, b, c, d Tracer gas concentrations at sampling locations within the Direct-Flow workstation for diffuser air jet angles of 10°, 45°,
0 50 100 150 200 250 300 0 50 100 150 200 250
Time from injection [min]
S F 6 Concentrati on [ppb] Test point Q1 Test point Q6 Test point Q8 Return Air Center Point Indirect Flow 6' x 6' x 64" Workstation Diffuser angle 10 degrees
0 50 100 150 200 250 300 0 50 100 150 200 250
Time from injection [min]
S F 6 Concentrati on [ppb] Test point Q2 Test point Q5 Test point Q7 Return Air Indirect Flow 6' x 6' x 64" Workstation Diffuser angle 45 degrees
Figure 16a Figure 16b
Figure 16c Figure 16d 0 50 100 150 200 250 300 0 50 100 150 200 250
Time from injection [min]
Concentrati on [ppb] Test point Q2 Test point Q5 Test point Q7 Return Air Indirect Flow 6' x 6' x 64" Workstation Diffuser angle 90 degrees
0 50 100 150 200 250 300 0 50 100 150 200 250
Time from injection [min]
S
F
6 Concentrati
on [ppb]
Diffuser angle 10 degrees Diffuser angle 90 degrees Diffuser angle 45 degrees
Indirect Flow Workstations 6' x 6' x 64"
Figures 16a, b, c, d Tracer gas concentrations at sampling locations within the Indirect-Flow workstation for diffuser air jet angles of 10°, 45°,
0 50 100 150 200 250 300 0 50 100 150 200 250
Time from injection [min]
S F 6 Concentrati on [ppb] Test point Q3 Test point Q4 Test point Q5 Return Air Center Point No Flow 6' x 6' x 64" Workstation Diffuser angle 10 degrees
0 50 100 150 200 250 300 0 50 100 150 200 250
Time from injection [min]
S F 6 Concentrati on [ppb] Test point Q2 Test point Q5 Test point Q7 Return Air No Flow 6' x 6' x 64" Workstation Diffuser angle 45 degrees
Figure 17a Figure 17b
Figure 17c Figure 17d 0 50 100 150 200 250 300 0 50 100 150 200 250
Time from injection [min]
Concentrati on [ppb] Test point Q2 Test point Q5 Test point Q7 Return Air No Flow 6' x 6' x 64" Workstation Diffuser angle 90 degrees
0 50 100 150 200 250 300 0 50 100 150 200 250
Time from injection [min]
S
F
6 Concentrati
on [ppb]
Diffuser angle 10 degrees Diffuser angle 90 degrees Diffuser angle 45 degrees
No Flow Workstations 6' x 6' x 64"
Figures 17a, b, c, d Tracer gas concentrations at sampling locations within the No-Flow workstation for diffuser air jet angles of 10°, 45°, and 90° from the ceiling.
3.5.1.4 Room mean-age-of-air
Figure 18a shows the calculated room mean-age-of-air based on tracer gas concentrations measured at the four reference locations R1, R2, R3 and R4, and in the return air duct. As mentioned before, two calculation methods were used: Nordtest and Pulse. The results indicate that the Nordtest method consistently produced a greater room mean-age- of-air than the Pulse method. It should be pointed out that one major difference between the two methods is that the Nordtest method requires the initial tracer gas concentration, which can only be extrapolated from the measured data. The estimated values of the initial tracer concentrations used with the Nordtest method could be significantly underestimated or overestimated.
3.5.1.4.1 Effect of the number, size, partition height of workstations and diffuser air jet angle
Figure 18a shows the room mean-age-of-air for the test room. The room mean-ages-of-air based on the average tracer gas concentrations measured at the four reference locations (R1, R2, R3, and R4) using either the Nordtest or Pulse methods were consistently greater than those based on the tracer gas concentrations in the return air duct.
The results also show that the room mean-ages-of-air increased as the number of
workstations decreased. As the outdoor air supply rate was set to be 10 L/s per person (or per workstation) this finding simply reflects the fact that the outdoor air supply decreased with the number of workstations. The room mean-age-of-air for the 45° diffuser air jet was slightly younger than that for the other two jet angles. This difference simply reflects the fact that the outdoor air supply rate during the test of the 45°diffuser air jet (1.82 ac/h) was greater than that for the tests of the other two diffuser angles (Table 2, Tests IVa,b,c and VIb).
Although in theory the room mean-age-of-air may be a reasonable ventilation index, there are no clear guidelines to help in the interpretation of these results. A difference of 10 to 20% in the room mean-age-of-air may not be sufficient to indicate that one test layout would provide better ventilation for a space than another layout.
3.5.1.4.2 Individual workstations
Figure 18b shows the room mean-age-of-air for the Direct-, Indirect-, and No-Flow workstations for the test layout with six workstations (Table 2, Test II). For comparison, the values for both the return air duct and the reference locations (i.e., based on the average tracer gas concentration measured at the four locations) are also shown. Figure 18b indicates that:
• the room mean-age-of-air based on the Nordtest method varied slightly among the four locations (i.e., Direct-, Indirect, No-Flow workstations, and the average of the four reference locations). The results based on the Pulse method were almost
identical for the four locations. This suggests that the air within and around the workstations was well mixed.
• the room mean-age-of-air of each of the three workstations was slightly greater than that of the return air. Similarly, the room mean-age-of-air based on the average tracer gas concentrations of the four reference locations was also slightly greater than that of the return air.
Similar results were observed for all the other test layouts investigated. As an additional example, Figure 18c shows the results of another test layout (Test V) to demonstrate that the results were not affected by the workstation layout.
0.00 0.20 0.40 0.60 0.80 1.00 1.20 1.40 1.60 1.80 2.00 6' x 6' x 64" (90°diffuser) 6' x 6' x 64" (45°diffuser) 6' x 6' x 64" (10°diffuser) 6' x 6' x 80" (10°diffuser) 8' x 8' x 64" (10°diffuser) 10' x 6' x 64" (10°diffuser) 10' x 10' x 64" (10°diffuser) Workstation size
Mean age of air [hour]
Ave Ref Points (Nordtest) Ave Ref Points (Pulse) Return Air (Nordtest) Return Air (Pulse) Based on averages from:
Dec 13, 19, 20 (2001) Feb 11, 13, 27 (2002) Mar 25,27,28 (2002) May 9, 14, 15, 23 (2002) Aug 20, 26 (2002)
Figure 18a Calculated room mean-age-of-air based on tracer gas concentrations measured at reference locations R1, R2, R3, and R4 and in the return air duct.
0 0.2 0.4 0.6 0.8 1 1.2 1.4 1.6 1.8 2
Mean age of air [h]
Nordtest method Pulse method
Nordtest method 0.92 1.05 1.12 1.14 1.09
Pulse method 0.73 0.86 0.87 0.89 0.87
Return Air Direct flow Indirect flow No flow Reference
locations 11-Feb-02 10' x 6' x 64" Workstations
Figure 18b Calculated room mean-age-of-air for the Direct-, Indirect-, and No-Flow workstations for the test layout with six workstations (Test II).
0 0.2 0.4 0.6 0.8 1 1.2 1.4 1.6 1.8 2
Mean age of air [h]
Nordtest method Pulse method
Nordtest method 0.64 0.79 0.84 0.84 0.81
Pulse method 0.45 0.56 0.58 0.58 0.57
Return Air Direct flow Indirect flow No flow Reference
locations 23-May-02 6' x 6' x 80" Workstations
Figure 18c Calculated room mean-age-of-air for the Direct-, Indirect-, and No-Flow workstations for the test layout with ten workstations (Test V).
3.5.1.5 Thermal comfort
Thermal comfort conditions within individual workstations were assessed for all
workstation layouts (Tests I to VI, Table 2) in terms of vertical temperature and air speed profiles, predicted mean vote (PMV), predicted percentage of dissatisfied (PPD) and risk of draught (percentage feeling draught, PD).
3.5.1.5.1 Vertical temperature and mean air speed profiles
Tables 3a, 3b, and 3c show the measured vertical air temperature and air speed profiles. The results indicate that for all workstation layouts, the maximum air temperature
difference within the occupied zone (between 0.1m and 1.7m above the floor) was much less than the maximum dry-bulb temperature difference of 3°C recommended by the ASHRAE Standard 55-1992 to prevent local discomfort. The results also indicate that no workstation had a vertical air temperature difference between these two heights within the occupied zone greater than 3°C for all the three diffuser air jet angles considered. Also shown in Tables 3a, 3b and 3c, except for one sampling location (1.1m above floor, Test III a, b, and c) where the measured mean air speed was between 0.30 and 0.32 m/s, for all the other workstation layouts the measured mean air speed within the occupied zone at all sampling locations was equal to or less than 0.25 m/s. The ASHRAE
Standard 55 does not specify the maximum allowable mean air speed directly. However, it states that the allowable mean air speed is a function of air temperature and turbulence intensity. For sedentary persons, it is necessary to avoid draughts; therefore the effect of mean air speed will be discussed together with the risk of draught later.
3.5.1.5.2 Predicted mean vote (PMV), predicted percentage of dissatisfied (PPD), and risk of draught (PD)
The calculated values of PMV, PPD, and PD are listed in Tables 3a, 3b, and 3c, for Direct-Flow, Indirect-Flow and No-Flow workstations, respectively.
Table 3a indicates that in the Direct-Flow workstations, for the 10°diffuser angle, the PMV and PPD indices exceeded the +/- 0.8 (PMV) or 20% (PPD) recommended values at the measurement point located at 1.1m above the floor in all test layouts with six and eight workstations. This also happened in some of the layouts with ten workstations at 1.7m above the floor, which suggests that more than 20% of the occupants would find their environment somewhat uncomfortable in these situations. Table 3a also indicates that the risk of draught index, PD, exceeded the recommended value of 15% (ASHRAE, 1992) for almost all the layouts with a 10°diffuser angle(Tests I, II, III, IV, and V), suggesting that cold draughts may be a concern in these cases.
The PMV, PPD and PD indices were all within their recommended values for both diffuser air jet angles of 45° and 90° in the Direct-Flow workstation, as well as for all layouts and locations in the Indirect- and No-Flow workstations (Tables 3b and 3c).
The PMV and PPD indices are strongly dependent on the assumed level of clothing insulation. For the assumed thermal resistance of 0.11 m2 °C/W considered in these calculations, it was predicted that most occupants would be on the cool side of neutral on the 7-point thermal sensation scale (ISO 7730-1984, PMV negative). In these cases, measures that increase temperature and/or reduce air velocity will improve thermal comfort and reduce draught discomfort. The opposite would be true in cases where occupants would be too warm.
Nevertheless, all the other variables being equal, for the 10°diffuser angle the thermal comfort and draught conditions in the Direct-Flow workstations were worse than those in the Indirect- and No-Flow workstations. This appears to be due to the generally lower temperatures and higher air velocities close to the source of supply air. Changing the diffuser angle to 45° or 90° improved both thermal comfort and draught in the
Direct-Flow workstation. This was a result, primarily, of an increase in air temperature and a decrease in air velocity at the measurement point in the workstation. The relative humidity (RH) was also higher during Tests V and VI (due to external conditions), but this did not substantially affect the PMV, PPD and PD indices.