ANALYSIS OF DEMAND AND INVESTMENT OUTLOOK IN OFFICE MARKET IN JAKARTA -INDONESIA
by
B. Chandra Maulana Makmoen Sarjana Teknik Jurusan Arsitektur (B. Arch)
Institut Teknologi Bandung (Bandung Institute of Technology) Bandung, Indonesia
1982
M.Arch,
California Polytechnic State University, San Luis Obispo, CA
1989
SUBMITTED TO THE DEPARTMENT OF ARCHITECTURE
IN PARTIAL FULFILLMENT OF THE REQUIREMENTS OF THE DEGREE
MASTER OF SCIENCE IN REAL ESTATE DEVELOPMENT AT THE MASSACHUSETTS INSTITUTE OF TECHNOLOGY
July 1993
@ Chandra Makmoen 1993
All Rights Reserved
The Author hereby grants to M.I.T. permission to reproduce and to distribute publicly copies of this thesis document in whole or in part.
Signature of the author
B. Chandra M. Makmoen Department of Architecture July 31, 1993 Certified by William C. Wheaton Professor, Economics Thesis Supervisor Accepted by William C. Wheaton Chairman Interdepartmental Degree Program in Real Estate Development
MASSACHUSETTS INSTITUTEOr~ rF:
ANALYSIS OF DEMAND AND INVESTMENT OUTLOOK IN OFFICE MARKET IN JAKARTA - INDONESIA
by
B. Chandra Maulana Makmoen
Submitted to the Department of Architecture on July 31, 1993, in Partial Fulfillment of the Requirements of the Degree of
Master of Science in Real Estate Development ABSTRACT
Real estate development is a long and often complicated process especially in the market of a developing country like Indonesia. Despite the latest trend of globalization of real estate, the business is still perceived to be very locally oriented. Understanding the market behavior is part of the early process of setting a good strategy that would become valuable inputs for the next stages in the development process.
Indonesia enjoys high economic growth measured by the growth of the real gross domestic product. As the economy grows, so does 'office' employment and hence the need of office space. Based on data from 1976, econometric model was developed and analyzed. The macroeconomic analysis concluded that space per worker is inelastic to rent from the landlords' perspective, but the opposite for tenants, and most of the tenants whose rents are expiring would like to expand to their target occupancy but only willing to pay a small increment. The vacancy in the market or of the building would be used by tenants as the bargaining power to expand, since rents negatively correlate with vacancy. The analysis suggests that the higher the vacancy rate, the lower the target rent or the equilibrium rent accepted by both landlords and tenants. Rents and vacancy rate, along with the total stock determine the level of new supply to the market.
At the micro level, rents is considered as the overall reflection of the quality of product demanded and agreed to be paid by tenants. The model can be used by tenants to optimize their renting decisions who may rent at GSB area in a medium rise building with parking facility and communication services; or by landlords to respond to the tenant's demand.
The forecasts of the market is based on economic growth forecast and confirmed the consolidation of office market for the next 3 years. The model suggests improvement of the market thereafter. This is consistent with the short cycle activity suggested in the completion model, which in turn suggest that the timing may be right to invest and start the early stage of development to be completed within 3 years, provided that the financing can be secured. Developers may set the strategy using the hedonic model and choose SPR location to build a medium rise building with a reasonable number of parking spaces. Thesis Supervisor: William C. Wheaton
ACKNOWLEDGEMENTS
By the time I write this acknowledgements, I have survived two theses. This one
is special, because this is a challenging new subject for me, because this is MIT, and because I got help from Bill Wheaton. It was Bill's insightful guidance that helped me finished this thesis in such a tight time frame. I cannot say enough to thank him for this.
I would like to express my appreciation to Mr. Susila Budi Moeffreni and Mr.
Michael J. Williams at Procon Indah / Jones Lang Wootton, and Mr. Trevor Peach at Colliers Jardine for their information and insight on current issues in real estate industry in Jakarta and Indonesia.
And then, there is an army of people in 'without whom' category. All of them have helped me directly or indirectly to make this happen.
First and foremost are my parents, especially my father. If it was not for my father,
I may not even think about taking another graduate program. His encouragement and
support has been so valuable. I dedicate this thesis to them.
The contribution of Mr. Rizal Ahadiat was very significant. Without his help, I may not even be able to apply to this program. I would also like to thank my sisters and their husbands, especially Deetje and Iken Nasution. These are the people that I would like to thank the most, because they have made the writing of this thesis possible. At this moment, I can only express my deep gratitude for all their willingness to help, effort, and the time they have set aside for me.
I would like to thank DR. Jens Pohl at Cal Poly, and my mentors and good friends Mr. Gary Nagamori and Mr. Tony Alexander at M&C for their support. Cheers to my friends at the Center that made life at MIT memorable.
I will not forget the 'little help' from my little one. My son, Arri, just knows the
'right' time for me to take an 'I want to play Mickey' or 'I want to draw a red dinosaur' breaks. People do need little breaks, don't they.
Finally, this thesis is also dedicated to my wife, Susie, for her patience, her presence, and her care and love that make me feel so fortunate.
TABLE OF CONTENTS
-ABSTRACT 2 ACKNOWLEDGEMENTS. 3 TABLE OF CONTENTS 4 LIST OF TABLES .. 6 LIST OF FIGURES. 7 CHAPTER 1. INTRODUCTION. . . . . 9Statement of the Problem . . . 9
Objectives / Purposes of the Thesis . . . . 10
Thesis Organization and Methodology . . . 10
References . . . 12
2. ECONOMIC PROFILE OF JAKARTA. . . . . 13
Jakarta and the Indonesian Economy . . . 13
Economic Indicators of Jakarta. . . . . . 16
Demography and Employment . . . 17
References . . . 24
3. THE JAKARTA OFFICE MARKET . . . 25
Real Estate / Property Market in Jakarta . . . . 25
Indicators of the Jakarta Office Market. . . . . 28
References . . . . 31
4. MACROECONOMIC ANALYSIS OF JAKARTA OFFICE MARKET 32 Introduction . . . 32
Determinants of Demand . . . 32
Estimating Office Employment . . . 34
Analysis of Office Space Market in Jakarta . . . . 40
Rent Movements and Vacancy in the Jakarta Office Market . . 48
Analysis of Office Space Supply . . . 53
Chapter Conclusions . . . 59
5. HEDONIC MODEL FOR JAKARTA OFFICE PROPERTIES . 62
Introduction . . . 62
Organizing the Variables . . . . 62
Analysis of Hedonic Models . . . 67
Inferences of Regression . . . 68
Application of Hedonic Model . . . 75
Chapter Conclusions . . . 78
References . . . 80
6. FORECAST AND FUTURE OUTLOOK OF JAKARTA OFFICE MARKET. Introduction . . . 81
Forecasting Office Employment. . . . 81
Forecasting Office Market Determinants . . . . 84
Financing and Investment Outlook of Jakarta Office Market . . 94
Joint Ventures . . . 95
The 'Superblock'. . . . 96
Strata Titles . . . 96
Multi-use Development and Product Diversifications . . . 97
References . . . 99
7. CONCLUSIONS . . . 100
APPENDICES. . . . . 104
A. 82 Observation Data Set for Hedonic Model . . 104
B. 54 Observation Data Set for Hedonic Model . . . 106
C. 30 Observation Data Set for Hedonic Model . . . 107
LIST OF TABLES
CHAPTER 2
2.1. Selected Indonesian Economic Indicators
2.2.a Gross Regional Domestic Product for Jakarta at Constant 1985
Market Price . . . .
b. Percentage of Distribution of Gross Regional Domestic Product
for Jakarta . . . .
c GRDP of Jakarta as a Percentage of National GDP at Constant 1985
Price . . . .
2.3.a Gross Domestic Product at Constant 1985 Price
b Percentage of Distribution of National Gross Domestic Product at Constant 1985 Price. . . .
c Sectoral GRDP as Percentages of Sectoral GDP 2.4. Ten Main Urban Centers in Indonesia .
2.5. Employment in Jakarta by Main Industrial Sector
CHAPTER 4
4.1. 'Office Occupation' and Estimates of Office Employment. 4.2. Office Space Absorption by Top Three Industries.
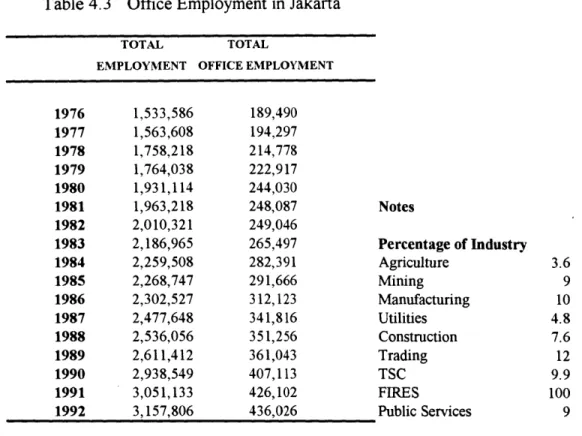
4.3. Office Employment in Jakarta. . . .
4.4. Jakarta Office Market Indicators . .
4.5. Statistical Regression Results for Absorption Models
.4.6. Statistical Regression Results for Vacancy Rent Adjustment Model 4.7. Statistical Regression Results for Completion Model.
CHAPTER 5
5.1. Variables for Hedonic Models . . .
5.2. Statistical Regression Results for Hedonic Model 5.1, 5.2, and 5.3
5.3. Rents by Location, 82 Observation Model .
5.4. Rents by Location, 54 Observation Model .
5.5. Rents by Location, 30 Observation Model . .
CHAPTER 6
6.1. GDP Forecasts . . . .
6.2. Pessimistic Forecast, Model . . . .
6.3. Optimistic Forecast, Model . . . .
6.4. Pessimistic Forecast, Brokerage Firms' Estimates .
LIST OF FIGURES
CHAPTER 2
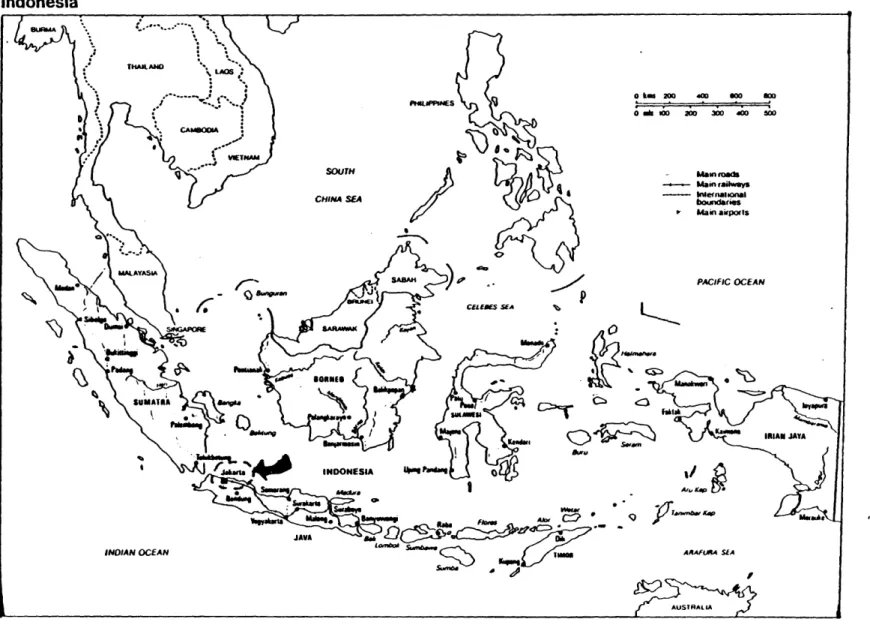
2.1. Map of Indonesia . . . 14
2.2. GDP of Indonesia and GRDP of Jakarta . . . 17
2.3. Indonesia's GDP and Employment Level in Jakarta . . . 22
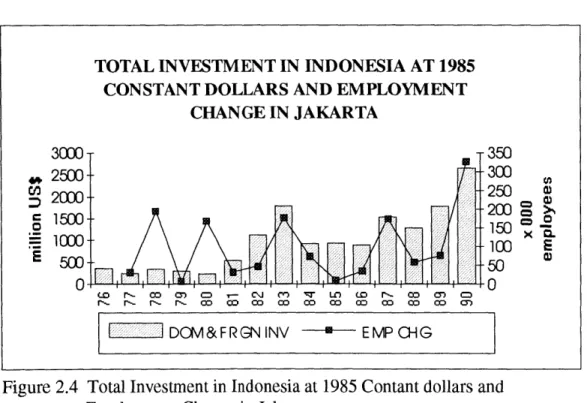
2.4. Total Investment in Indonesia at 1985 Constant Dollars and Change of
Employment in Jakarta . . . 22
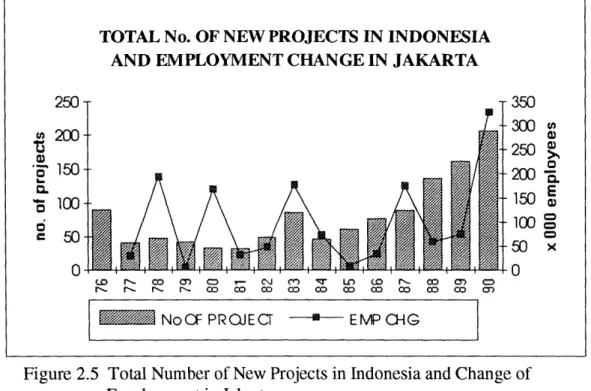
2.5. Total Number of New Projects in Indonesia and Change of
Employment in Jakarta . . . 23
2.6. Employment Growth of Jakarta, and Real GDP Growth and Export
of Indonesia. . . . 23
CHAPTER 3
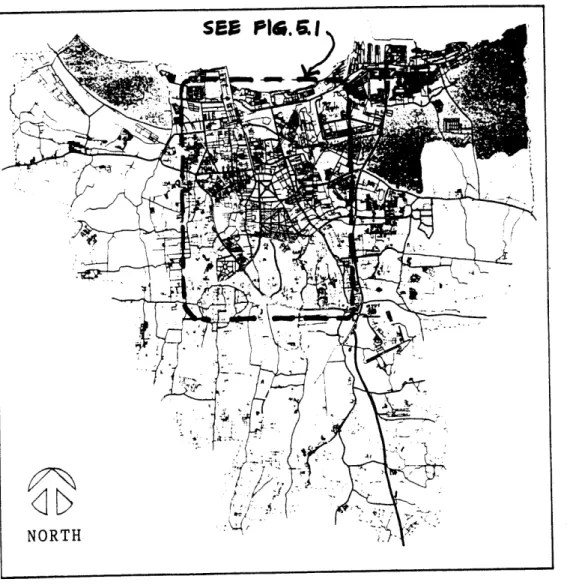
3.1. Map of Jakarta . . . 27
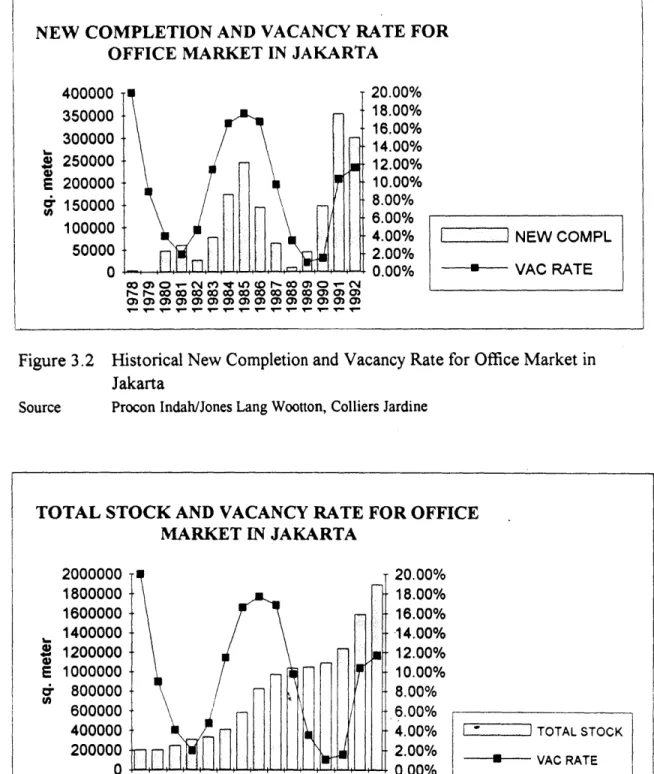
3.2. Historical New Completion and Vacancy Rate for Office Market in
Jakarta . . . 29
3.3. Total Office Stock and Vacancy Rate for Office Market in Jakarta . 29
3.4. Vacancy Rate and Rent in Real Term for Jakarta Office Market. . 30
CHAPTER 4
4.1. Demand and Supply Flow Chart. . . . 33
4.2. Absorption Level, Office Employment Level and Office Employment
Change . . . 42
4.3. Average Rent at 1992 Constant Price and Vacancy Rate in Jakarta
Office Market . . . 48
4.4. Rent Inflation and Vacancy Rates in Jakarta Office Market . . 49
4.5. Rent - Vacancy Adjustment Model. . . . . 51
4.6. Equilibrium Rent - Vacancy Tradeoffs . . . 52
4.7. New Completion and Vacancy Rate for Office Market in Jakarta. . 54
4.8. Office Employment Growth and Percentage Of New Completion . 55
LIST OF FIGURES (continued)
CHAPTER 5
5.1. Property Locations for Hedonic Models . . . . 66
5.2. Rents by Location, 82 Observation Model . . . . 76
5.3. Rents by Location, 54 Observation Model . . . . 77
5.4. Rents by Location, 30 Observation Model . . . . 77
CHAPTER 6
6.1. Forecasts of Growths of Employment and Real GDP. . . . 83
6.2. Pessimistic and Optimistic Forecasts of Absorption and Employment
Growth. . . . 86
6.3. Pessimistic and Optimistic Forecasts of Absorption and Employment
Growth using Brokerage Firms' Estimates. . . . . 86
6.4. Pessimistic and Optimistic Forecasts of Vacancy Rate and Completion 90
6.5. Pessimistic and Optimistic Forecasts of Vacancy and Completion
CHAPTER 1
INTRODUCTION
Statement of the Problem
Only one year ago, an article written in an Indonesian business magazine by a leading commercial brokerage and real estate consulting firm stated that despite the softening of real estate market, the competition among real estate brokers was still increasing and the overall development rate in all real estate product did not seem to be slowing down [1]. The statement indicated that oversupply of office space is very likely to occur in Jakarta. As a matter of fact in the first half of 1992, office space supply reached a record high in the last 15 years [2]. This is confirmed by analysts, developers, and other parties that have interests in the office market. Some opinions are quoted the following:
"The office market continued to consolidate over the second half of 1992 as new space completion slowed down".
"Future supply over the next two years is expected to fall to about the level of 1992, again due the difficulties of developers to secure funding" [3]. "Office rentals will remain the same this year, but rental growth is expected in the first half of 1994" [4].
"The property market is going through its trough of its mainstream cycle period albeit with some limited bright spot. The sector that bears the brunt of the current soft market conditions is the office market; while the retail, hotel, residential and industrial sectors... are still holding their own... Even though residential market is promising now, there are indications to show that it is heading towards an oversupply situation in the not-too-distant future" [5].
Analysts now are trying to forecast the prospect of investments in office market in Jakarta. A quick glance at annual property reports published by major commercial brokers
indicates that the market is experiencing the downturn in the cycle. The question now is how close can one forecast the turning point of the cycle of the office market? Which approach would make a better prediction? What kind of exogenous factors would contribute to uncertainties in the office market cycles?
Objectives / Purposes of the Thesis
Real estate development is a long and often complicated process. Some said that the process is partially setting good planning and strategy, but mostly execution. Nevertheless, understanding the market behavior is very critical even for a highly speculative developer. This thesis is intended as a start to understand the macroeconomic aspects of the market that would become valuable inputs in making investment decisions.
The main focus of this thesis is the office market of Jakarta, particularly the prime office (class A) market. Market performance indicators as well as other factors affecting the demand and supply of office space are analyzed, based on certain economic models that have already been developed, and forecasts would be made based on these findings.
At micro level, rent are also considered as the reflection of the overall character of the product demanded and paid by tenants. The thesis discusses the factors that affect the overall consideration of the rent and the result can be used as a tool to understand and to respond to the tenants' demand.
Furthermore, the thesis will discuss the findings and suggestions that can be made from the forecast analysis for the Jakarta office market. The thesis will also discuss the general direction of investment opportunities in office market in Jakarta: the potentials as well as the hurdles, what has been done and what the prospects would be.
Thesis Organization and Methodology
The two chapters following the introduction are the overview of the macro-economic context of the Jakarta office market. These chapters present the roles of Jakarta
as the barometer of Indonesia's economy and Indonesia, and claimed by some analysts, as the late comer of the Newly Industrialized Countries in Southeast Asia. And one measure of this is the real estate development in the region.
The emphasize of the thesis is quantitative analysis that apply statistical regressions to economic models for the Jakarta office market. Endogenous and exogenous factors are identified, organized based on the equation developed for each model, and the regression will be run and analyzed. The bulk of the analysis are presented in Chapters 4 and 5,
followed by the forecast analysis in Chapter 6.
Chapter 4 discusses the macroeconomic analysis of market determinants to determine the behavior of the market. While Chapter 5 focuses on the microeconomic aspect. Here, real estate is analyzed as a product that reflect the overall considerations of tenants' demand.
There are, however, some problems with the data from Jakarta. Computerization and automation for data management and coordination are relatively new to institutions performing statistical surveys such as the Central Bureau of Statistics and the Jakarta Statistical Office, who are the two main sources of macroeconomic data. This may be one reason of some incompleteness, inconsistency, or incompatibility of data between these two sources. Whenever possible correction and reconciliation measures will be taken for conflicting data. Otherwise, some reasonable assumptions may have to be taken. The incompleteness of the data may be approached with estimates using ratios, multiples, inter and extrapolations which will be identified accordingly in the references or notes.
Business situation and capital market in Jakarta or Indonesia are far less open than those of the U.S. Property market data are proprietary data that are mainly held by major commercial brokers and it is a common practice to be very selective in disclosing these data mainly to maintain some competitive advantage in the market. Another issue is the fact that there are data that can only be identified as originated from 'private independent sources' for the same proprietary and exclusiveness reasons. The data used in the analysis,
however, are the aggregate data, compiled or computed from these sources, which the writer thinks should comply with the validity as well as the necessary confidentiality of the sources.
The relatively short period of the available data has made it difficult to do time-series analysis that normally require at least 20 years of data. But it is still worth doing as the results of analyses are discussed in the conclusion sections in each chapter and summarized in Chapter 7. Chapter 7 closes the thesis with the discussion on what had been learned and what kind of prospect of investment in the office market in Jakarta.
References
[1] Agung Firmansyah and Robinson P., "Degup dibalik Keluh", Prospek, Weekly
Economic News (March 21, 1992), p. 32; (in Indonesian).
[2] "Property Market Outlook", Procon Indah /JLWResearch, January 1993, p.1
[3] See [2], p.2
[4] "Office Rentals Will be the Same This Year. The Colliers Jardine Update," Property
Link, Real Estate News in the Asia Pacfic Region, (February 1993) p.4 5
[5] Handy Lim, "Property Market Has Its Bright Spots", Property Link, Real Estate
CHAPTER 2
ECONOMIC PROFILE OF JAKARTA
Jakarta and the Indonesian Economy
As the capital of Indonesia, Jakarta becomes the center and the barometer of political, economic, social, and cultural activities. The city development outgrows any other major cities in Indonesia. From the long history of the city, even before it became the capital and called Jakarta, the city had always shown its significant and important roles in the development of the country as a whole. The growth of the national economy also reflects the economic growth of Jakarta.
Indonesia is now in its Fifth Development Plan. The Plan was started in 1969 as the government efforts to improve the economy, promote exports, and reduce the country's debts. The targets of the Plan were first the basic industry of agriculture and development of infrastructure and gradually expanded until now Indonesia has one of the fastest growing manufacturing in Asia . In most of the Plan, Indonesia rely on its oil production and exports, and foreign capitals to support the expenditures and investments. In fact, until the mid eighties, oil and petroleum products became the backbone of Indonesian economy, account for 80% of total export value [1]. The Plans, despite several disruptions of oil crises that force the government to defer some of the projects, has enjoyed high economic growth. Table 2.1 exhibits selected Indonesian economic
indicators.
The growth rate of real GDP is down compare to previous years, but there are non-oil export gains that would help Indonesia to gradually decrease its dependency to oil exports. Part of this gains are stimulated by deregulatory measures taken by the government in late 1987 that increase activities in the capital market, especially in the
k k=s 200 400 000 00 0k 0 200 360 400 o 0 Main roads Main railways - Malemiporonal boundaries or Main airports PACIFIC OCEAN p
CEL EMS SEA A
Sau
10 ;J K4b &
ARAFIRA SiA
Figure 2.1 Map of Indonesia Indonesia ftLiPPA$ES SOUTH CHINA SEA
/
INDIAN OCEAN -1o- ~Table 2.1 Selected Indonesian Economic Indicators YEAR REAL GDP ar85 PRICE (billion Rp) [1] 1976 1977 1978 1979 1980 1981 1982 1983 1984 1985 1986 1987 1988 1989 1990 REAL GDP at'85 PRICE (billion US$) [2] 56,204.0 61,128.0 65,921.0 70,045.0 76,965.0 83,006.0 84,932.0 88,493.0 94,666.0 96,997.0 102,696.0 113,455.0 113,982.0 122,581.0 131,614.0 49.96 54.34 58.60 62.26 68.41 73.78 75.50 78.66 84.15 86.22 91.29 100.85 101.32 108.96 116.99 EXPORT INCL OIL (million US$) [3] 8,547.0 10,853.0 11,643.0 15,591.0 21,909.0 22,260.0 22,293.0 21,152.0 21,902.0 18,586.7 14,305.0 17,081.8 19,224.9 22,140.2 25,675.2 DOMESTIC INVESTMT (million Rp) [4] 67,128.0 63,282.0 70,663.0 63,912.0 96,201.0 277,510.0 267,762.0 978,703.0 653,001.0 767,281.0 535,684.0 1,080,263.0 1,130,197.0 1,736,324.0 2,113,451.0 FOREIGN INVESTMT (000 US$) [5] 103,818.0 51,380.0 99,156.0 143,521.0 91,609.0 224,251.0 951,744.0 791,856.0 305,409.0 247,408.0 283,786.0 501,291.0 390,758.0 557,307.0 1,250,799.0 TOTAL INVESTMT (million Rp) [6] 43,151,598 21,385,982 62,043,163 90,051,579 57,516,722 144,695,154 659,350,482 788,083,567 328,662,267 279,101,281 466,228,510 828,210,413 677,532,295 1,003,217,003 2,379,882,350 TOTAL INV AT '85 PRICE (million US$) [7] 355.99 241.81 341.69 299.21 231.26 535.57 1,119.99 1,789.41 918.39 929.44 890.23 1,541.12 1,288.06 1,781.03 2,657.43 TOTAL No. OF PROJECT [8] 90 41 48 42 33 32 49 86 46 61 77 89 136 161 206 CPI EXCH 85=100 RATE Rp/US$ 1 [9] [10] 38.2 42.4 45.9 53.5 62.9 70.6 77.3 86.4 95.5 100 105.9 115.6 124.9 133 142.9 415 415 625 627 627 644 693 994 1,074 1,125 1,641 1,650 1,731 1,797 1,901 Sources International Monetary Fund : [1] -[3], [9], [101
stock market with the permission for foreign investors to purchase Indonesian stocks and the establishment of the OTC. Further deregulation in capital market in 1988 opened up even more opportunities for business expansion in the Indonesian capital market shown by significant increases in the number of banks and stock exchange activities [2].
In this Fifth Development Plan, Indonesia has set a target to obtain offshore capital as the source of government financing to account for roughly 60% of the development expenditure[3]. But the fact is that since the first half of 1992 foreign investment has
dropped. Investors continue to put their money to other Asian countries, mainly the People's Republic of China. Indonesia even has to compete with countries like Vietnam for the more scarce offshore capital [4].
The level of domestic investments has dropped recently. The sources of domestic financing have also become more difficult to obtain. Creditors such as banks has implemented tight money policy that translate into high lending rates. Some lenders may charge up to 25% [5]. Foreign financing in real estate is still under tight regulations, especially concerning ownership or control of properties on Indonesian land.
Economic Indicators of Jakarta.
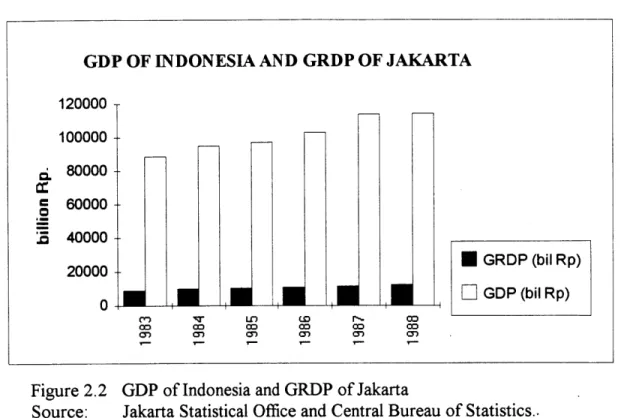
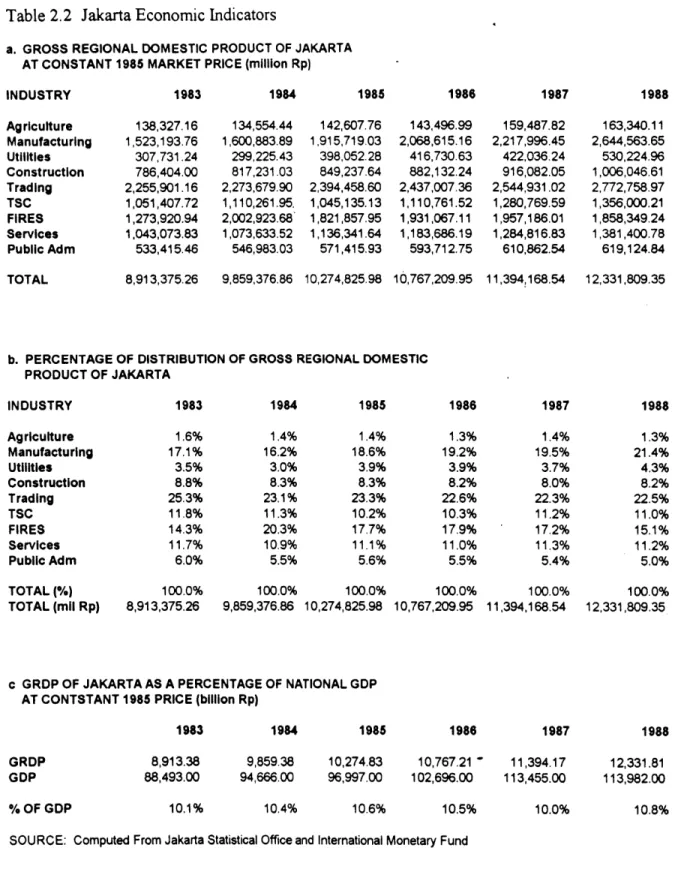
The economy of Jakarta follow that of Indonesia almost proportionally. The gross domestic products of Jakarta, for example, account consistently for 10 % of the national gross domestic products, as shown in Tables 2.2 c and Figure 2.2. The largest portion of this gross regional products came from trading (25%). The financial sector in Jakarta, although less than trading, accounted for about half of the national gross domestic products coming from the this sector.
The capital market and the flow of foreign investments are basically controlled through Jakarta. The central government policy would almost directly affect Jakarta's economy. The significant number of banks emerged in the mid 80s was the direct results of government deregulation in capital market. The increase activities in the capital market
GDP OF INDONESIA AND GRDP OF JAKARTA 120000-- 100000--Ci 80000-- 60000- 40000-20000 - GRDP (bil Rp) 0 [ GDP (bil Rp) CM co Mc cc Mc 00 C" CM C C) M M
Figure 2.2 GDP of Indonesia and GRDP of Jakarta
Source: Jakarta Statistical Office and Central Bureau of Statistics..
increased the competition among banks during that period, which in turn stimulated the Jakarta economy. The real estate 'boom' in the 80s was part of the effects of this policy to the Jakarta economy.
Demography and Employment
Indonesia is now the fourth most populated country. It used to be the fifth before the dissolution of USSR. The population based on 1990 census is just under 180 million.
Of this population, about 60% live in the island of Java, which is only about 7% of the
whole land area of Indonesia. In 1990, over 8 million people live in Jakarta. With the growth rate of 2.38% per year, it is the fourth highest among the ten main cities in
Indonesia. The second largest city, also in Java, is at a distant second in term of total number of population.
Table 2.2 Jakarta Economic Indicators
a. GROSS REGIONAL DOMESTIC PRODUCT OF JAKARTA
AT CONSTANT 1985 MARKET PRICE (million Rp) INDUSTRY Agriculture Manufacturing Utilities Construction Trading TSC FIRES Services Public Adm TOTAL 1983 138,327.16 1,523,193.76 307,731.24 786,404.00 2,255,901.16 1,051,407.72 1,273,920.94 1.043,073.83 533,415.46 1984 134,554.44 1,600,883.89 299,225.43 817,231.03 2,273,679.90 1,110,261.95. 2,002,923.68 1,073,633.52 546,983.03 1985 142,607.76 1,915,719.03 398,052.28 849,237.64 2,394,458.60 1,045,135.13 1,821,857.95 1,136,341.64 571,415.93 143,496.99 2,068,615.16 416,730.63 882,132.24 2,437,007.36 1,110,761.52 1,931,067.11 1,183,686.19 593,712.75 8,913,375.26 9,859,376.86 10,274,825.98 10,767,209.95
b. PERCENTAGE OF DISTRIBUTION OF GROSS REGIONAL DOMESTIC
PRODUCT OF JAKARTA INDUSTRY Agriculture Manufacturing Utilities Construction Trading TSC FIRES Services Public Adm TOTAL (%) TOTAL (mil Rp) 1983 1.6% 17.1% 3.5% 8.8% 25.3% 11.8% 14.3% 11.7% 6.0% 100.0% 8,913,375.26 1984 1.4% 16.2% 3.0% 8.3% 23.1% 11.3% 20.3% 10.9% 5.5% 1985 1.4% 18.6% 3.9% 8.3% 23.3% 10.2% 17.7% 11.1% 5.6% 1986 1.3% 19.2% 3.9% 8.2% 22.6% 10.3% 17.9% 11.0% 5.5% 100.0% 100.0% 100.0% 9,859,376.86 10,274,825.98 10,767,209.95 1987 1.4% 19.5% 3.7% 8.0% 22.3% 11.2% 17.2% 11.3% 5.4% 100.0% 11,394,168.54 1988 1.3% 21.4% 4.3% 8.2% 22.5% 11.0% 15.1% 11.2% 5.0% 100.0% 12,331,809.35
c GRDP OF JAKARTA AS A PERCENTAGE OF NATIONAL GDP
AT CONTSTANT 1985 PRICE (billion Rp) 1983 8,913.38 88,493.00 10.1% 1984 1985 1986 9,859.38 10,274.83 10,767.21 - 11,394.17 94,666.00 96,997.00 102,696.00 113,455.00 10.4% 10.6% 10.5%
SOURCE: Computed From Jakarta Statistical Office and International Monetary Fund
1986 1987 159,487.82 2,217,996.45 422,036.24 916,082.05 2,544,931.02 1,280,769.59 1,957,186.01 1,284,816.83 610,862.54 11,394,168.54 1988 163,340.11 2,644,563.65 530,224.96 1,006,046.61 2,772,758.97 1,356,000.21 1,858,349.24 1,381,400.78 619,124.84 12,331,809.35 GRDP GDP % OF GDP 1987 1988 12,331.81 113,982.00 10.0% 10.8%
Table 2.3 Jakarta Economic Indicators
a. GROSS DOMESTIC PRODUCT AT CONSTANT 1985 PRICE INDUSTRY 1985 1986 1987 1988 Agriculture 23,250.18 24,287.60 26,593.85 24,016.01 Mining 16,925.98 18,033.42 18,527.20 18,214.32 Manufacturing 12,929.70 13,781.80 15,849.66 20,972.69 Utilities 717.78 801.03 941.68 626.90 Construction 5,460.93 5,679.09 6,308.10 5,847.28 Trading 15,083.03 16,020.58 18,107.42 17,906.57 TSC 5,422.13 5,709.90 6,376.17 5,972.66 FIRES 2,939.01 3,163.04 3,517.11 4,114.75 Services 6,450.30 6,757.40 7,556.10 7,237.86 Public Adm 7,817.96 8,462.15 9,677.71 9,072.97 TOTAL 96,997.00 102,696.00 113,455.00 113,982.00
b. PERCENTAGE OF DISTRIBUTION OF NATIONAL GROSS DOMESTIC PRODUCT AT CONSTANT 1985 PRICE
INDUSTRY 1985 1986 1987 1988 Agriculture 24.0% 23.7% 23.4% 21.1% Mining 17.5% 17.6% 16.3% 16.0% Manufacturing 13.3% 13.4% 14.0% 18.4% Utilities 0.7% 0.8% 0.8% 0.6% Construction 5.6% 5.5% 5.6% 5.1% Trading 15.6% 15.6% 16.0% 15.7% TSC 5.6% 5.6% 5.6% 5.2% FIRES 3.0% 3.1% 3.1% 3.6% Services 6.7% 6.6% 6.7% 6.4% Public Adm 8.1% 8.2% 8.5% 8.0% TOTAL (%) 100.0% 100.0% 100.0% 100.0%
c. SECTORAL GRDP AS PERCENTAGEs OF SECTORAL GDP
INDUSTRY t985 1986 1987 1988 Agriculture 0.6% 0.6% 0.5% 0.6% Mining Manufacturing 11.8% 11.6% 12.1% 9.9% Utilities 42.9% 37.4% 42.3% 66.5% Construction 14.4% 14.4% 13.5% - 15.1% Trading 15.0% 14.2% 13.2% 13.6% TSC 19.4% 19.4% 16.4% 18.6% FIRES 43.3% 63.3% 51.8% 46.9% Services 16.2% 15.9% 15.0% 16.4% Public Adm 6.8% 6.5% 5.9% 6.5%
Table 2.4
Ten Main Urban Centers in Indonesia Population (000) Growth rate 1980 1990 1 Jakarta 6,504 8,228 2.38 2 Surabaya 2,028 2,484 2.05 3 Bandung 1,463 2,058 3.47 4 Medan 1,379 1,730 2.29 5 Semarang 1,027 1,251 1.99 6 Palembang 787 1,144 3.81 7 Ujung Pandang 709 945 2.91 8 Malang 696 9 Lampung 637 10Padang 631
Source: The Economist Intelligence Unit, Indonesia Country Profile
In this Fifth Development Plan which began in April 1989, the main concern is to generate adequate employment opportunities for a projected increase in the labor force by almost 12 million new job seekers [6]. Jakarta alone has about 3 million of employed population at working age since 1990.
According to the Indonesia Central Bureau of Statistics, employment is measured as the number of people over the age of 10, which is considered as the starting working age in Indonesia, who are employed. The data on employment in Jakarta are recorded by the Central Bureau of Statistics as part of provincial employment data and the Jakarta Statistical Office. Indonesia is considered as a special district that has the same level of government as provinces.
Table 2.3 shows that agriculture is still the main industry of Indonesia. By contrast it accounts only about 1% of Jakarta employment which indicates the diminishing of agricultural land around the city and the concentration of administrative works in agriculture as well as in other sectors involving natural resources.
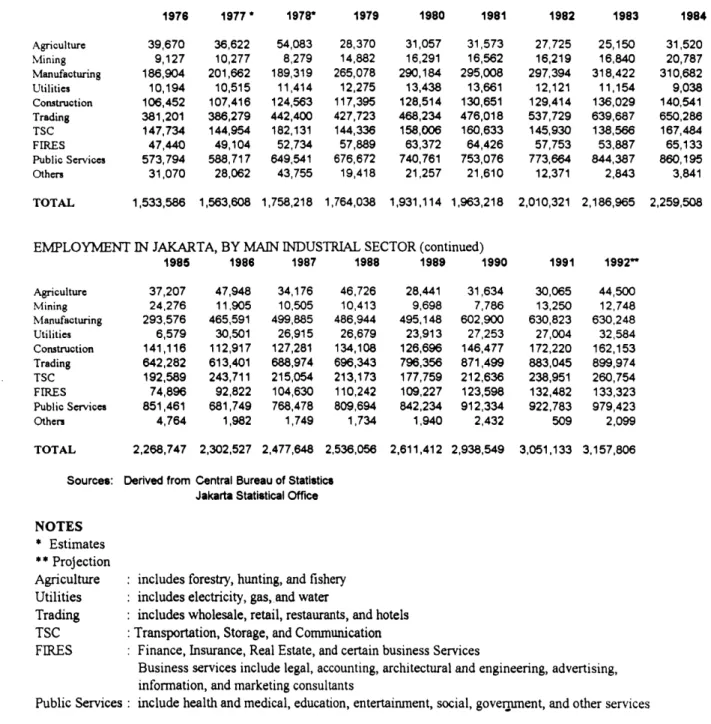
Table 2.5 EMPLOYMENT IN JAKARTA, BY MAIN INDUSTRIAL SECTOR 1976 1977* 1978* 1979 39,670 9,127 186,904 10,194 106,452 381,201 147,734 47,440 573,794 31,070 36,622 10,277 201,662 10,515 107,416 386,279 144,954 49,104 588,717 28,062 54,083 8,279 189,319 11,414 124,563 442,400 182,131 52,734 649,541 43,755 28,370 14,882 265,078 12,275 117,395 427,723 144,336 57,889 676,672 19,418 1980 1981 31,057 16,291 290,184 13,438 128,514 468,234 158,006 63,372 740,761 21,257 31,573 16,562 295,008 13,661 130,651 476,018 160,633 64,426 753,076 21,610 1982 1983 27,725 16,219 297,394 12,121 129,414 537,729 145,930 57,753 773,664 12,371 25,150 16,840 318,422 11,154 136,029 639,687 138,566 53,887 844,387 2,843 TOTAL 1,533,586 1,563,608 1,758,218 1,764,038 1,931,114 1,963,218
EMPLOYMENT IN JAKARTA, BY MAIN INDUSTRIAL SECTOR (continued)
1985 1986 1987 1988 Agriculture Mining Manufacturing Utilities Construction Trading TSC FIRES Public Services Others TOTAL 37,207 24,276 293,576 6,579 141,116 642,282 192,589 74,896 851,461 4,764 47,948 11,905 465,591 30,501 112,917 613,401 243,711 92,822 681,749 1,982 34,176 10,505 499,885 26,915 127,281 688,974 215,054 104,630 768,478 1,749 46,726 10,413 486,944 26,679 134,108 696,343 213,173 110,242 809,694 1,734 2,268,747 2,302,527 2,477,648 2,536,056 1989 1990 28,441 9,698 495,148 23,913 126,696 796,356 177,759 109,227 842,234 1,940 31,634 7,786 602,900 27,253 146,477 871,499 212,636 123,598 912,334 2,432 2,611,412 2,938,549 2,010,321 2,186,965 2,259,508 1991 1992" 30,065 13,250 630,823 27,004 172,220 883,045 238,951 132,482 922,783 509 44,500 12,748 630,248 32,584 162,153 899,974 260,754 133,323 979,423 2,099 3,051,133 3,157,806
Sources: Derived from
NOTES * Estimates ** Projection Agriculture Utilities Trading TSC FIRES
Central Bureau of Statistics Jakarta Statistical Office
includes forestry, hunting, and fishery includes electricity, gas, and water
includes wholesale, retail, restaurants, and hotels Transportation, Storage, and Communication
Finance, Insurance, Real Estate, and certain business Services
Business services include legal, accounting, architectural and engineering, advertising, information, and marketing consultants
Public Services : include health and medical, education, entertainment, social, government, and other services Agriculture Mining Manufacturing Utilities Construction Trading TSC FIRES Public Services Others 1984 31,520 20,787 310,682 9,038 140,541 650,286 167,484 65,133 860,195 3,841
Public services in Jakarta, which include most of the employees government agencies (sometimes referred as 'civil servants' in statistical reports) accounts for almost one-third of total employment each year for the past 6 years.
INDONESIA'S GDP AND EMPLOYMENT LEVEL IN JAKARTA r-_ ccc C c, CcC i r - r-_ r_ Mc Mc Mcc c C CC CO cO c , 13000.00 -2500.00 -2000.00 U--1500.00
6
-1000.00 z -500.00 00 n0n --- GDP (bIl$) * EMPLOYMENT IN JAKART AFigure 2.3 Indonesia's GDP and Employment Level in Jakarta
Sources: Central Bureau of Statistics, Jakarta Statistical Office, International Monetary Fund
TOTAL INVESTMENT IN INDONESIA AT 1985 CONSTANT DOLLARS AND EMPLOYMENT
CHANGE IN JAKARTA 3000 350 4 2500 300 W20 250 ~2000--a -
/o200
%
1500- 1 50 =* 10001/\- 0 E 100 E 0-to r- CD cm c e-C\ co 'ur w t i CD o r r- r M C CO CM CO C C O C C M CDOM& F R GN NV EMP OHG
Figure 2.4 Total Investment in Indonesia at 1985 Contant dollars and Employment Change in Jakarta.
Sources: Central Bureau of Statistics, Jakarta Statistical Office, International Monetary Fund
120- 100- 80-601 40-
20-z
0 04-ro .TOTAL No. OF NEW PROJECTS IN INDONESIA AND EMPLOYMENT CHANGE IN JAKARTA
250-- 350 200--300 250 i 150 -- 0 20 M. E 100-- 150 100 50- '/ 0- 0 Fl-
r_
fa-f1.
o O M o o o O M co o M NoOF PROJECV 7 EMP CHGFigure 2.5 Total Number of New Projects in Indonesia and Change of Employment in Jakarta.
Sources: Central Bureau of Statistics, Jakarta Statistical Office, International Monetary Fund
EMPLOYMENT GROWTH OF JAKARTA, REAL GDP GROWTH AND EXPORT OF INDONESIA
14.00%---- 30000 12.00/-- - 25000 10.00% -- 20000 15000 4.00%0 2.00% 5000 E 0.00% 0 r- 00 M~ CD~ Mi :U ic r~- Mcc r ~C=) r-. r- r-_ 0 co 00 cc co Oc co cc co 00 CYc U M) M) M) 0 M) 0 M) M 0 M M) ) 0M 0) 0) 0D --- E MP. GR WT H REAL GDP - - - -EXPORT GR OW T H
Figure 2.6 Employment Growth of Jakarta, Real GDP Growth and Export of Indonesia.
References
[1] Victor Mallet, "Exporter Will Join the Importers," Financial Times Survey, May 13, 1993, p.111.
[2] Iwan J. Azis, The Politics of Economi Reforms: The Indonesian Experience, (Cornell University and University of Indonesia, 1993), p.41.
[3] "Indonesia, Country Profile, Annual Survey of Political and Economic Background",
The Economist Intelligence Unit, 1993, 20.
[4] Victor Mallet, "Everything to Play For", Financial Times Survey, May 13, 1993,
p.II
[5] "Property Market Outlook", Procon Indah /JLW Research, Jakarta, Indonesia January 1993, p. 1
CHAPTER 3
THE JAKARTA OFFICE MARKET
Real Estate / Property Market in Jakarta
The real estate industry in Jakarta is commonly referred as property business. Development of the prototype of commercial areas started as early as the middle of 17th century in the coastal areas of Jakarta which was known then under the Dutch name of Batavia. The commercial and residential then developed along the river of Ciliwung south of the coastal area. This area, now called Hayam Wuruk / Gajah Mada (referred later as GHK) still become one of the prime office locations in Jakarta.
The development of a satellite city of Kebayoran Baru, at the south of Jakarta, was planned in 1949. When the plan was implemented shortly after, office buildings were built along the artery road connecting the two centers. A major hotel was built in 1962 and considered as the beginning of the era of modem multi-story buildings in Jakarta. But it was not until the first 32 story high rise office building was built across the hotel by a joint venture of the government of Indonesia, Japan Air Line and Mitsui, a major real estate developer in Japan, that the development of real estate in Indonesia was in its full gear to take off.
The main artery, known as Jalan (or road) M. Husni Thamrin (MHT) and Jalan Jenderal Sudirman (SDM) were then established as the primary financial district or central business district of Jakarta. The development of the area along Jalan (or Road) Jenderal Gatot Subroto (GSB) and Jalan HR Rasuna Said (HRS) transformed the area into what is now known as the 'Golden Triangle' of Jakarta [1]. The completion of toll expressway at the inner ring road of Jakarta, passing the GSB area has prepared the triangle for further development. The price of land around the area is soaring high. With the skyrocketing
price of land in this Golden Triangle, development now also expands to the outer perimeter of this area (fringe area). The development along the inner ring road to the west direction started to connect the 'old' CBD (GHK location) with the Golden Triangle, while to the east, the road will lead to the industrial estate area.
Soon residential areas are pushed to the suburban which creates the problems of traffic for commuters. Along with the development of residential areas, shopping centers have been developed. The development of shopping centers basically follows the pattern of residential development. The latest trend in residential development in Jakarta, especially those developed by major developers are to build an 'integrated small town' complete with shopping facilities, social facilities such as schools, religious buildings and sport centers, and sometimes even health care centers. These shopping centers may then turn out to be large enough to serve a larger service area [2].
Another 'new' phenomenon is the development of multi-story apartments. The target market of this is usually the expatriates working for foreign or multi national firms. Therefore, the preferred locations are to be minutes away from the main CBD, which in turn results in the high rent rates. Some commercial broker reports indicates that at this time this is the type of real estate product that stays relatively stable in terms of returns on investment [3].
In the industrial sector, industrial real estate is considered to be highly regulated mainly concerning the ownership and the large capital required for development and also concerning environmental issues. The east of Jakarta has been developed into the largest urban industrial estate in the country.
Other than Jakarta, Surabaya the provincial capital of East Java is considered as second in real estate development. Although still distant, the gap of the development levels between the two cities seems to be narrowing. Bandung, Medan, and Semarang,
Figure 3.1 Map of Jakarta
the provincial capitals of West Java, North Sumatra, and Central Java, respectively, also experience significant increase in real estate development activities compare to previous years [4].
In general, Jakarta can be considered as the indicator of real estate development in Indonesia. Recent reports of Asian Property Market Survey by Brooke Hillier Parker shows that despite the downturn of real estate business, the percentage of yields of investment, especially in retail and residential are among the highest compared to other Asia Pacific countries. The office market performance, however, is at relatively mediocre levels, both in the percentage of investment yields and market rental values [5].
Indicators of the Jakarta Office Market
In the Jakarta office market, the total stock of prime commercial office had grown from about 200,000 square meters in 1978 to 1,900,000 square meters in 1992, or more than nine times within 15 years, as shown in Figure 3.3. The highest level of new office supply occurred when the office market experienced boom periods in 1985 and 1991, as shown in Figure 3.2. The high development activities during these periods reflected the response of developers to the economy growth of Indonesia, measured by the growth rate of the national gross domestic product.
Although the peaks of the economic growth are higher in 1980 and 1987 as shown in Figure 2.6, development activities did not occur immediately after these two periods. Figure 2.6 shows very sharp declines in economic growth after the two peaks. Oil crisis in
1982 certainly prevented developers to immediately start development after the 1980 high
economic growth, so did the very growth rate in 1988. But the reactions to the next peaks following these two economic downturns were quite prompt resulting in the two boom periods in the anticipation of better economy.
NEW COMPLETION AND VACANCY RATE FOR OFFICE MARKET IN JAKARTA
400000 20.00% 350000 18.00% 300000 16.00% 14.00% . 250000 12.00%
E 200000
H0.08
150000 1.00% 100000-50000 50000 ~ ~4.00%NE OP 12.00% 0 at 0.00% - ACRATEFigure 3.2 i-storical New Completion and Vacancy Rate for Office Market in Jakarta
Source Procon IndalJones Lang Wootton, Colliers Jardine
TOTAL STOCK AND VACANCY RATE FOR OFFICE MARKET IN JAKARTA 2000000 20.00% 1800000.00% 1600000- 16.00% 1400000 014.00% -S 1200000- 12.00% E 1000000 -10.00% &r 800000
11
8.00% 600000- 6.00% 400000 4.00% - TOTAL STOCK 200000712.00%
---- VCRT 0 n- 0.00%- VAC RATEFigure 3.3 Total Office Stock and Vacancy Rate for Office Market in Jakarta
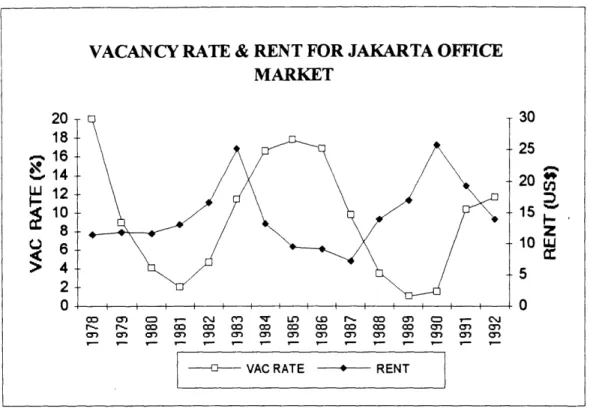
VACANCY RATE & RENT FOR JAKARTA OFFICE MARKET 20 30 18-16- 25 ~14 -2 0 U 12 10 15 . 8 2 Q 6 10 U >4 5 2 0 - cc- '- ' q u n -. c 0cci I- T~- cc cc cc Tc cc I- cc cc- Tc cc r- r-
?--- VAC RATE - RENT
Figure 3.4 Vacancy Rate and Rent in Real Term for Jakarta Office Market Source: Procon Indah / Jones Lang Wootton and Colliers Jardine
The market then experienced oversupply conditions. By the time new completion reached the highest levels, total employment, which includes office employment, the target market of office real estate, experienced slow growth. Figure 3.2 and 3.3 show that vacancy rates soared high especially around the 1985 boom. Accordingly, the vacancy rates were low during the low development activities as firms started to occupy the available office spaces.
Rents, as shown in Figure 3.4, seemed to follow some pattern of lagged cycle with respect to that of the vacancy rates. The rent rose to the highest point within two years after the vacancy rate dropped the lowest. In the reverse situation, the rent reaction was in the opposite direction but the lagged period appeared to be similar.
As reported by commercial brokers, confirmed office supply for the next three years can reach 460,000 square meters, not to include about more than 500,000 square
meters of potential new supply. If this prediction of new supply will materialize, then the vacancy rate may be still on the way to another peak, while rent is expected to drop.
The next three chapters will discuss how the market behaved the way it has been exhibited in these charts. The factors that determine the market and how they interact will be analyzed and modeled and the model will be used to forecast the future of the market.
References
[1] Mohamad Cholid et.al, "Gairah Membeli dan Arus Menguasai," Tempo, (June 23,
1990), p.84.(in Indonesian).
[2] "Property Market Outlook," Procon Indah /JL WResearch, January 1993, p.5
[3] Didin Abidin Masud et. al, "Adu Cepat Memetik Laba," Prospek, Weekly Economic
News (November 21, 1992), p. 18; (in Indonesian).
[4] "Property Market Outlook," Procon Indah /JLWResearch, July 1982, p. 11-12.
[5] "Asian Property Market Survey," Brooke Hillier Parker, Research Department, February 1993, p.1.
CHAPTER 4
MACROECONOMIC ANALYSIS OF JAKARTA
OFFICE MARKET
Introduction
This chapter will start with an analysis of demand in the Jakarta office market. The determinants of demand and their behavior will be identified. Econometric models will be developed to analyze the correlation between these variables. These models will later be used to make forecasts of demand and to see the outlook of investment in this market.
Determinants of Demand
The demand for office space in a market is primarily determined by employment in the area or region that requires an 'office space'. This employment is referred to as office
employment. The employment, hence the office employment, of a region is mainly determined by the region's economy. A change in office (or overall) employment , as the result of the change of the region's economy as a whole, is an exogenous variable that will create a demand shock to the office market.
One measure of demand in office market is absorption. Absorption is defined as the net change in total leased office space per period [1], measured in square meters in Jakarta. Although gross absorption measures the total leasing activity, at the same time it also measures the mobility of tenant or tenant turnover, thus cannot be considered as a correct measure of market demand. Therefore gross absorption will not be used in the analysis. Data on net absorption can be derived from the data of office stock and vacancy rate that are usually easy accessible to public.
In the short run, the net absorption is also affected by exogenous variables such as total stock of office and vacant space, and rent as the endogenous variable. The rent itself
is expected to react to the changes in vacancy, for example as the higher the vacancy the tighter the competition to get the office space rented. The rent affects the firm's decision on the space consumption and on how much the firm is willing to pay. This decision
determines the net absorption or the demand of office space.
As demand increases, office space from existing space are absorbed and captures vacant spaces. The space then becomes more scarce and the rents would increase. The prospect on return on investments from rental income would encourage developers to start building. This, in turn, would affect the market's vacancy and rent and the cycle starts again (see Figure 4.1). The reverse occurs when demand declines.
OE AB V R C OFFICE EMPLOYMENT ABSORPTION VACANCY RATE MARKET RENT COMPLETION LEVEL
Estimating Office Employment
Office employment in Jakarta is estimated from the employment data obtained from Central Bureau of Statistics and Jakarta Statistical Office (see Table 2.2 ). The term office employment itself implies the use of an office space to perform tasks. Thus, the estimate of office employment can determined by examining whether or not the type of occupation require an office. Another way to estimate this is by examining the category of industry of firms that are likely to be housed in an office building and therefore occupy office space [2].
Each industrial category or even each firm may have different type of occupation performed by its workers. In the U.S., this may be referred, in a very broad category, as white and blue collar workers. Office employment then suppose to consist of the white
collar workers.
However, the white and collar distinction itself may not truly reflect the office and 'non-office' classifications. Some of these workers, such as technicians and salespersons may not actually need or may require working area other than desks or tables typically found in an 'office space'. In another situation, the office space used by workers doing 'office works' may not be located in a separate building or complex. The office space in this case is integrated as part of a facility. The occupation approach has to consider both office spaces: the one in a separate building, and the other as an office room in other types of buildings [3].
The offices of statistics in Jakarta actually provide data of employment by the type of occupation for Jakarta, in addition to the data of employment by industrial sector. The problems with these data are first that they are not published regularly every year, and second, there is no indication whether the occupations were performed in an office building or in an office room of other type of building.
The industry approach considers the type of industry that tend to occupy space in separate office buildings. In the U.S., such data are available based on surveys conducted
by government agencies which recorded the number of workers in total and those who
occupy separate administrative or auxiliary structures. Studies using this survey, such as that described by DiPasquale and Wheaton [4] suggested several conclusions on the distribution of office employment originated from each SIC. The study found that almost three-fourth of office employment were from Financial, Insurance, and Real Estate (FIRE) and service sectors, while the administrative components of manufacturing came in second. These ratios were then applied to estimate office employment in each category in each period. The problem here is the absence of such data for Jakarta from the statistical offices. Therefore, the employment data by the type of occupation will be used as a starting point.
Employment data by type occupation available for this analysis are those for 1985 and 1990 published by the Jakarta Statistical Office and Central Bureau of Statistics. The data are presented in the form of percentages. The types of occupation included in the data are managerial, administrative / clerical, professional / technical, services, sales, production, agriculture, and others.
As defined by the statistical offices, in general, workers under the category of managers and administrative / clerical are 'office' workers which include those working in office buildings and in other types of buildings. Some professionals / technical, may be categorized into office employment working in office buildings; while sales and service workers may buildings other than offices. Most of production workers and other category
are not office employment.
At this point, it will be assumed that the 'office occupation' roughly consists of managers, most administrative, and some professional/technical workers. Thus, this would include those who occupy office buildings and those who do not. From the percentages of the 'office occupations' in 1985 and 1990, the estimates of percentages of
office employment that will be used in this analysis will be derived. The summary of 'office occupation' as well as the estimates are presented in Table 4.1.
Table 4.1 'Office Occupation' and Estimate of Office Employment
1985 1990
%OFF EMP BY 'OFF 'OFF %'OFF EMP BY 'OFF 'OFF EST OCCPN' INDUST OCCPN' OCCPN' OCCPN' INDUST OCCPN' OCCPN' % OFF PER IND BY IND % TOT PER IND BY IND % TOT EMP
1 2 3 4=2x3 5 6 7 8=6x7 9 10 AGRI 2.7% 37,207 998 0.34% 3.7% 31,634 1,178 0.29% 4% MINE 25.3% 24,276 6,130 2.11% 13.0% 7,786 1,012 0.25% 9% MFG 10.1% 293,576 29,531 10.15% 9.7% 602,900 58,327 14.33% 10% UTIL 2.9% 6,579 188 0.06% 4.4% 27,253 1,206 0.30% 5% CONST 11.5% 141,116 16,277 5.59% 11.0% 146,477 16,112 3.96% 8% TRADE 5.7% 642,282 36,779 12.64% 6.1% 871,499 53,178 13.06% 12% TSC 9.0% 192,589 17,333 5.96% 9.0% 212,636 19,137 4.70% 10% FIRE 93.3% 74,896 69,878 24.02% 91.0% 123,598 112,474 27.63% 100% PUBL 12.7% 851,461 108,502 37.29% 14.3% 912,334 130,819 32.13% 9% OTH 6.6% 4,764 314 0.11% 50.2% 2,432 1,221 0.30% 28% TOTAL 2,268,74 285,930 2,938,54 394,666 6 9
Source: 2 and 6 are calculated from the Jakarta Statistical Office and Central Bureau of Statistics, Employment by Type of Occupation.
3 and 7 are from Table 2.5, derived from the same source.
The survey by DiPasquale and Wheaton assumed that all workers under FIRE category are office workers. Based on the Census of Economy for Jakarta, also published
by the Jakarta Statistical Office [5], the FIRES category also includes certain services such as accounting, legal, architectural consulting, advertising, information, and marketing. Based on the nature of the works performed, firms in this category require office spaces and very likely to be housed in an office building. Then the assumption that all (100%) of FIRES' workers occupy office space can be applied here. This is in fact close with the average 'office occupation' pcrcentage in Table 4.1 and therefore will be used.
A report on Property Market Outlook by Procon Indah / JLW Research indicated
the demand of office space by FIRES, trading and manufacturing as the top three industries based on their leasing deals in 1991 and 1992. This is exhibited in Table 4.1.
During these years, the employment in FIRES, manufacturing, and trading are approximately 133,000, 630,000, and 890,000 square meters, respectively. If the amount of space per worker is assumed to be the same for each category, then the percentage of demand (absorption) may also reflect the percentage of the number of working people seeking for space to work.
Table 4.2 Office Space Absorption by Top Three Industries
(% absorbed space)
1990 1991 1992
FIRES 65 47 34
Manufacturing N/A 25 19
Trading N/A 6 23
Source: Procon Indah / JLW Research
The high demand from FIRES in 1991 is actually a drop from 65% the year before, following the 'booming' of financial firms as the result of government deregulation in the late 80s [6]. The drop of demand from manufacturing may be due to the slowing down of foreign investment in Indonesia, while trading experienced a big gain that lead the industry to high demand on prime office space. If the assumption that all (100%) of FIRES' workers are office workers and the figures in Table 4.2 are used, then: x% of 630,000 manufacturing employment = (19/34)*100%*133,000, or solving for x, x% =
(19/34)*(133/630) = 11.7% Using the same approach for trading results in 10%.
The estimate for manufacturing is fairly consistent with the figures from Table 4.1. Considering a strong gain in trade and a more conservative outlook of foreign investment in manufacturing, then 10% for manufacturing and 12% for trading seems to be reasonable estimates to be used here.
In making the estimates for the other industries, there are several things that must be considered concerning government employees and the public sector in Indonesia. Table 2.5, Employment in Jakarta by Main Industrial Sectors, shows that public service sector accounts for about 30% of total employment, which is in fact the largest share of employment. As defined in the Census of Economy for Jakarta, businesses involved in this sector may be different than what might be under the same category in the U.S. In this case, this sector includes health care, education, radio and TV broadcasts, entertainment, and the likes [7].
Government employees also are expected to fall in this category. However, in Indonesia, there are employees of government agencies and there are those of state-owned firms. Together, they account for roughly 10% of the total employees [8]. Both have the status of government employees (or sometimes referred as civil servants). The main difference is that the government agencies deal with administrative tasks, while state-owned firms do technical or professional works. Government agencies are categorized under the public sector while state-owned firms are under the industry correspond to the type of service or works these firm provide. State-owned companies may be incorporated
or may form a multi national joint ventures just like private companies.
In term of space use, in Indonesia, government agencies usually occupy their own buildings (government buildings). While state-owned companies may or may not occupy their own building. It is not too common that government agencies in Indonesia occupy commercial offices. According to a report on office properties in Indonesia published by Indonesian Business Data Centre in 1991, in 1989 - 1990, only 0.43% of commercial
office spaces in Jakarta occupied by government agencies [9]. This shows a very low occupancy and should confirm the assumption that government agencies, although included in the office employment, usually occupy government buildings and therefore should be excluded from the office employment in public sector.