HAL Id: hal-01144088
https://hal.archives-ouvertes.fr/hal-01144088
Submitted on 20 Apr 2015
HAL is a multi-disciplinary open access archive for the deposit and dissemination of sci-entific research documents, whether they are pub-lished or not. The documents may come from teaching and research institutions in France or abroad, or from public or private research centers.
L’archive ouverte pluridisciplinaire HAL, est destinée au dépôt et à la diffusion de documents scientifiques de niveau recherche, publiés ou non, émanant des établissements d’enseignement et de recherche français ou étrangers, des laboratoires publics ou privés.
Assessing Allometric Models to Predict Vegetative
Growth of Yams in Different Environments
Denis Cornet, Jorge Sierra, Régis Tournebize
To cite this version:
Denis Cornet, Jorge Sierra, Régis Tournebize. Assessing Allometric Models to Predict Vegetative Growth of Yams in Different Environments. Agronomy Journal, American Society of Agronomy, 2015, 107 (1), pp.241-248. �10.2134/agronj14.0370�. �hal-01144088�
Biometry, Modeling & Statistics
Assessing Allometric Models to Predict Vegetative Growth
of Yams in Different Environments
Denis Cornet,* Jorge Sierra, and Régis Tournebize
Published in Agron. J. 107:241–248 (2015) doi:10.2134/agronj14.0370Copyright © 2015 by the American Society of Agronomy, 5585 Guilford Road, Madison, WI 53711. All rights reserved. No part of this periodical may be reproduced or transmitted in any form or by any means, electronic or mechanical, including photocopying, recording, or any information storage and retrieval system, without permission in writing from the publisher.
ABStRACt
Yams are a neglected crop, grown mostly in West Africa by resource-poor farmers. Little is known about the physiology of the crop, and researchers lack practical and effi cient tools to conduct growth analysis. Th e objective of this study was to develop allometric models able to predict yam leaf area and leaf and stem dry mass with acceptable accuracy. Th e models were calibrated using a data set comprising 10 cultivars belonging to the two main species (Dioscorea alata L. and D. rotundata Poir.) grown at two locations in Guadeloupe (Lesser Antilles) and two locations in Benin (West Africa). Th e best models were selected based on Akaike’s information criteria and validated against independent data sets. A power regression was best for predicting leaf area from leaf measurements while linear relationships were suffi cient to predict the relationship between crop leaf area and leaf and stem mass. Th e use of species-specifi c models for the estimation of leaf and stem mass signifi cantly improved the models’ performance. Models predicting yam leaf area and leaf mass proved to be reliable and accurate (no signifi cant deviation and adjusted R2 > 0.95). For stem mass, overestimation always occurred during validation (9%). To overcome this discrepancy, a
methodology was proposed that allows the user to calibrate the model by tailoring the sampling size to obtain the required precision. Th e use of the selected models provides a nondestructive and reliable alternative to estimate leaf area and leaf and stem biomass for diff erent cultivars and sites.
D. Cornet, CIRAD, UMR AGAP, Petit-Bourg, F-97170, Guadeloupe, France, and IITA-Benin, BP 08-0932, Cotonou, Republic of Benin; J. Sierra and R. Tournebize, INRA, UR1321 ASTRO, Agrosystèmes Tropicaux, Petit-Bourg, F-97170, Guadeloupe, France. Received 16 July 2014. *Corresponding author (denis.cornet@cirad.fr).
Abbreviations: AIC, Akaike’s information criterion.
Yams are grown
throughout the tropical parts of the world and are important staple crops in at least 10 countries (ranging from Nigeria to Jamaica and the Solomon Islands), accounting for 155 million consumers (FAO, 2012). Despite their economic value, research on yam is still scarce (Varshney et al., 2012), and there is little literature available on the crop’s physiology (Onwueme and Haverkort, 1991; Marcos et al., 2011). To address this lack of knowledge, there is a clear need for practical methods allowing basic growth analysis. An essential aspect of crop growth analysis lies in the accurate and nondestructive estimation of key variables such as leaf area or crop biomass (Normand and Lauri, 2012). To perform such estimations, modern equipment (e.g., hand scanners or laser optic apparatus) may be expensive and too complex for basic and simple studies. Moreover, 85% of world yam production is in rural areas of West Africa, where modern facilities and instruments may be unavailable, yet simple practical tools and methods may suffi ce for researchers. Th e use of predictive allometric models allows this diffi culty to be circumvented byquantifying statistical relationships between key variables and some easily measured predictors (Niklas, 2004).
Estimation of leaf area is a key part of classical growth analysis and is necessary in many plant physiological studies (Sestak et al., 1971). Models for the nondestructive estimation of leaf area are useful tools for researchers in agronomic experiments. Th e linear measurement method allows the leaf area to be estimated without disturbing the growth of the plant (Sestak et al., 1971). Th is simple, nondestructive, and accurate method is based on linear regressions of leaf area on various leaf measurements. For heart-shaped leaves, the most frequently used measurements are leaf maximum length, leaf maximum width, midrib length, or their combination (Sinoquet and Andrieu, 1993). Although simple methods exist for estimating the leaf area of some common crops (Kandiannan et al., 2002; Lu et al., 2004; Pompelli et al., 2012), only fragmentary studies are reported for yam (Gumbs and Ferguson, 1976; Ravi and Chowdhury, 1989; George, 1992). Unfortunately, these published reports on yam fail to show that any one specifi c approach for deriving leaf area is adequate across cultivars and environmental conditions. Moreover, sometimes the adequacy of the model’s assumptions for estimating leaf area has not been carefully examined (e.g., there may be no validation step).
Predictive models for estimating key variables at the crop level have been developed for agronomic or ecological purposes (Müller et al., 2000; Shipley and Meziane, 2002; McCarthy and Enquist, 2007). Some relate the leaf area to the leaf biomass through the specifi c leaf area, while others investigate Published January 13, 2015
allometric biomass partitioning. These classical allometric models differ from the models at the level of the leaf because they integrate all the growth processes of the plant (Normand and Lauri, 2012) and are thus often less accurate.
The objective of this study was to develop predictive models to estimate leaf area and leaf and stem mass of 10 cultivars belonging to the two main yam species (D. alata and D. rotundata). This study focused on two levels: the individual leaf and the whole crop. At the level of the individual leaf, we evaluated the currently used models and propose a reliable and accurate model using nondestructive linear measurements for the estimation of the leaf area of yam. At the crop level, we link the stem and leaf mass to the leaf area of the crop.
MAtERiAlS AnD MEthODS Data Collection
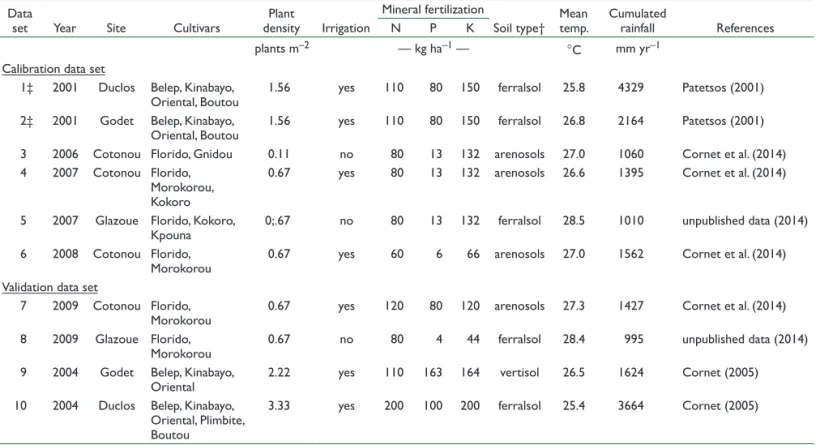
Ten data sets from field experiments with a wide range of cultivars and cultural practices (Table 1) were selected. The experiments were performed in Guadeloupe (Lesser Antilles) at the INRA experimental stations of Duclos (16°12¢ N, 61°39¢ W, 250 m asl) and Godet (16°24¢ N, 61°29¢ W, 30 m asl) and in Benin (West Africa) at the IITA experimental stations of Cotonou (6°25¢ N, 2°19¢ E, 23 m asl) and Glazoue (7°56¢ N, 2°15¢ E, 200 m asl). Each field experiment consisted of 300 to 550 plants.
At the crop level, plants were sampled from an area of 1.5 to 3 m2 every 2 to 3 wk from vine emergence to the beginning of
tuber growth (approximately 110 d) to measure leaf and stem biomass and crop leaf area index. There were four replicates of one to four plants at each sampling date, depending on plant density. Crop leaf area was measured with a planimeter (Li-Cor Model 3100) and expressed as the area of leaves (m2) per square
meter of ground. Leaf biomass (LM in g m–2) and stem biomass
(SM in g m–2) were determined after drying the material at
70°C. To study the allometric relationships between crop leaf area and leaf or stem dry mass, the field experiments were divided into two groups: Exp. 1 to 6 (520 samples) were used to select models and estimate their parameters, while Exp. 7 to 10 were used to test the chosen models (259 samples). All cultivars belonged to the two main species (i.e., Florido, Belep, Oriental, Kinabayo, Boutou, and Plimbite for D. alata and Kpouna, Morokorou, Gnidou, and Kokoro for D. rotundata).
At the individual leaf level, samples were collected in 2001, 2004, and 2007 (Table 1) to study the relationship between linear measurements of leaf blade and leaf area. All samples consisted of at least 40 leaves collected randomly from different positions on the vine. All cultivars had heart-shaped leaves on which maximum length (L in cm), maximum width (W in cm), and midrib length (M in cm) were measured. Afterward, individual leaf area (A in cm2) was measured with a
planimeter. Samples from 2001 and 2007 were used for model calibration and investigation of the effects of site and cultivar (456 samples), while samples from 2004 were used for model validation (354 samples).
Statistical Analysis
Statistical analysis was performed in four steps. First, all the models were evaluated and the best equations for each of the three allometric relationships selected. Second, the effects of the covariates (cultivar, species, site, and year) on the allometric models were tested and the selected models were calibrated. Third, the calibrated models were validated against an independent data set and compared with other published models. Finally, if a significant deviation in the model estimates was found during the validation step, the minimum sample size for the parameterization of such a model was then evaluated. Table 1. Experiment characteristics of each data set used in this study.
Data
set Year Site Cultivars densityPlant Irrigation
Mineral fertilization
Soil type† Mean temp. Cumulated rainfall References
N P K
plants m–2 — kg ha–1 — °C mm yr–1
Calibration data set
1‡ 2001 Duclos Belep, Kinabayo,
Oriental, Boutou 1.56 yes 110 80 150 ferralsol 25.8 4329 Patetsos (2001)
2‡ 2001 Godet Belep, Kinabayo,
Oriental, Boutou 1.56 yes 110 80 150 ferralsol 26.8 2164 Patetsos (2001)
3 2006 Cotonou Florido, Gnidou 0.11 no 80 13 132 arenosols 27.0 1060 Cornet et al. (2014)
4 2007 Cotonou Florido, Morokorou, Kokoro
0.67 yes 80 13 132 arenosols 26.6 1395 Cornet et al. (2014)
5 2007 Glazoue Florido, Kokoro,
Kpouna 0;.67 no 80 13 132 ferralsol 28.5 1010 unpublished data (2014)
6 2008 Cotonou Florido,
Morokorou 0.67 yes 60 6 66 arenosols 27.0 1562 Cornet et al. (2014)
Validation data set
7 2009 Cotonou Florido,
Morokorou 0.67 yes 120 80 120 arenosols 27.3 1427 Cornet et al. (2014)
8 2009 Glazoue Florido,
Morokorou 0.67 no 80 4 44 ferralsol 28.4 995 unpublished data (2014)
9 2004 Godet Belep, Kinabayo,
Oriental 2.22 yes 110 163 164 vertisol 26.5 1624 Cornet (2005)
10 2004 Duclos Belep, Kinabayo, Oriental, Plimbite, Boutou
3.33 yes 200 100 200 ferralsol 25.4 3664 Cornet (2005)
† FAO (1998).
All statistical analyses were performed using R software (R Core Team, 2013).
Model Selection
For each allometric relationship, several linear and nonlinear regression models were run using combinations of predictors and response variables. These were either chosen from the literature or derived for the present study based on their logical mathematical relation to the published models. Preliminary regression analysis showed that most of the relationships between crop leaf area and leaf and stem dry biomass followed linear patterns, while the relationship between linear measurements and leaf area was better modeled with power functions typical of allometric models. Hence, in this study, only linear models are presented for the estimation of leaf and stem mass, while only power models are presented for leaf area. A logarithmic transformation was used to make the assumption of homogeneous variances reasonable in the power models (e.g., y = axb):
ln
y b x
=
ln
+
ln
a
where y is the response variable, x the predictor, and a and b the model parameters.
Models were selected using Akaike’s information criterion (AIC). The AIC is a common model selection criterion that deals with both the goodness of fit and the complexity of the model (i.e., number of parameters) and enables several models to be compared simultaneously (Johnson and Omland, 2004). The lower the value of the AIC, the better the model. Because the AIC tells nothing about the quality of the model in an absolute sense, the adjusted coefficient of determination (R2) and the mean standard error percentage (S%) were
also calculated to illustrate the mean size of the error as a percentage of the estimated values:
1
ˆ
100
%
n iˆ
i i iy
y
S
n
=y
-=
å
where yi is the actual value, ˆyiis the estimated value, and n is the number of observations (Shaeffer, 1980). Because the model estimates were computed on a logarithmic scale, they must then be back-transformed to their original, arithmetic scale. Because this transformation is nonlinear, and there is variability in the observed data around the fitted relationship, a simple “naive” exponential-based transformation will generate bias (Clifford et al., 2013). Consequently, correction factors are typically calculated to remove this bias when back-transforming. As proposed by Clifford et al. (2013), we calculated the uniform minimum variance unbiased estimations described by Bradu and Mundlak (1970). The R codes required to fit a log–log allometric model and to make predictions using the uniform minimum variance unbiased estimations were adapted from Clifford et al. (2013).
testing Covariates and Model Calibration
Experimental factors (i.e., cultivars, sites, and year) can affect the slope and/or the intercept of the relationships and thus were studied as covariates. To test the influence of these covariates on the allometric relationships, a maximal model was fitted (i.e., a
model including explanatory variables, covariates, and first-order interactions). Furthermore the maximal model was simplified according to Crawley’s (2007) procedure. The model summaries were inspected and the least significant term was removed. The full and simplified models were then compared using the F-test. If no significant difference was observed, the simplified version was kept and the least significant highest order term was again deleted. If the F-test revealed a significant difference (P < 0.05), the previous model was kept. Finally, a 1000 bootstrap resampling in conjunction with automated variable selection methods was applied to check the efficiency of the selected models (Austin and Tu, 2004). Variables that were identified as independent predictors of the response variable in at least 60% of the bootstrap samples were kept, and this last model was called the minimal adequate model. The relative importance of each term of the minimal adequate model was estimated using the Lindeman, Merenda, and Gold metric (Lindeman et al., 1980), allowing an estimation of the percentage of the variance explained by each term. The confidence intervals for relative importance were estimated using a bootstrap procedure on 1000 samples (Grömping, 2006). Differences in model performance (i.e., DR2, DAIC, and DS%) were calculated between the
minimal adequate model and the classical pooled regression.
Model Validation and Minimum Sample Size
To validate the calibrated models, leaf area, leaf mass, and stem mass were estimated using the selected allometric models on independent data. The estimated values were compared with observed ones using S%, R2, and the bias (b%). The bias
is defined as the scaled mean error (i.e., the mean difference between estimated and observed values expressed as a percentage of the mean observed value):
1
ˆ
% 100
n i i i iy
y
b
y
=-=
å
The bias indicates whether the model, on average, overestimates (b% > 0) or underestimates (b% < 0) data (Walther and Moore, 2005).
Paired t-tests were run to determine whether the differences between the estimated and the observed values were
statistically significant at P < 0.05. When this difference was significant, we estimated the minimum sample size allowing user recalibration with minimum bias. In this case, parameter values and bias were calculated on randomly selected subsamples of increasing size. All sample sizes were submitted to a bootstrapping procedure with 100 resamples with replacement. The mean bias was then expressed as a function of the sample size.
RESultS AnD DiSCuSSiOn Model Selection
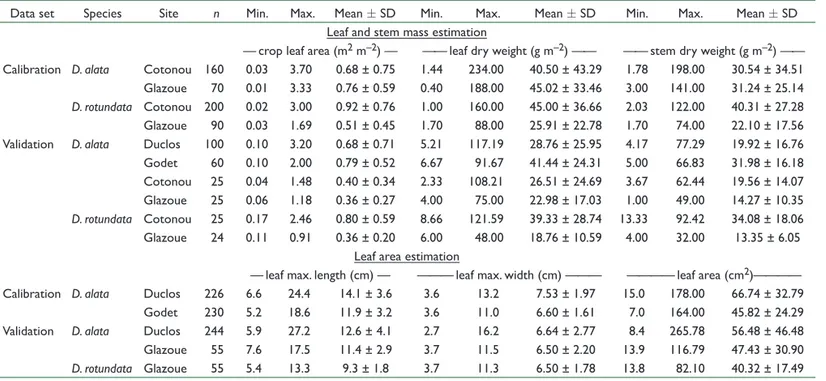
The domain of validity of the allometric models is defined by the experimental range for crop leaf area, leaf and stem mass, and individual leaf area used for model calibration. A summary of the data sets is given in Table 2. Table 3 summarizes the performance of candidate models during the calibration phase. Models were fitted to the calibration data set and ranked according to their performance. Individual leaf area was best explained by a power
function of the square of the maximum leaf width multiplied by the maximum leaf length (S% of 5.4% of mean leaf area and R2
of 0.987; Table 3). Leaf and stem mass were better explained with a linear function of crop leaf area. The best allometric models for leaf and stem mass were not as good (i.e., S% of 10.5 and 15.3% and R2 of 0.977 and 0.935, respectively; Table 3) as for leaf area
but similar to those reported in previous studies (Normand and Lauri, 2012; Pompelli et al., 2012; Kandiannan et al., 2002). The higher S% and lower R2 for leaf mass estimation may be due
to the large variation in specific leaf area within a single stand, plant (Cooper and Qualls, 1967; Reddy et al., 1989), or even leaf (Sestak et al., 1971). Moreover the specific leaf area could have been influenced by the growth stage of the plant (Koller, 1972) and by the time of day (Chatterton et al., 1972) when samples were taken. Cornet et al. (2014) showed that yam emergence may
occur over >1 mo, creating a very heterogeneous population of individuals of different ages with different specific leaf areas. This variability in specific leaf area may explain some of the scatter of leaf mass estimates with the evaluated model.
The leaf area/stem mass allometric model showed the highest %
S and lowest R2. This was also observed by other researchers
and may be due to changes in both specific leaf area and leaf/ stem ratio (Normand and Lauri, 2012). In fact, herbaceous self-supporting plants show an ontogenetic trend toward a decreasing leaf/stem allocation ratio of assimilates, with an increasingly larger investment in the support tissues needed by larger plants (Poorter et al., 2012). Because all yam species grown for food have a climbing growth habit, they are likely to behave differently. Unfortunately, literature on the functional anatomy of climbing species is scarce. Some studies have indicated that vines and lianas have a higher leaf/stem ratio but also higher plasticity (i.e., greater variation) in their anatomical characteristics in response to changing environmental
conditions than their self-supporting relatives (Gianoli, 2003; den Dubbelden and Verburg, 1996; Werth et al., 2013). Thus, the increasing competition between plants with age can modify the leaf/stem ratio and therefore increase the variability of related allometric relationships.
Year, Site, and Cultivar Effects on Allometric Models
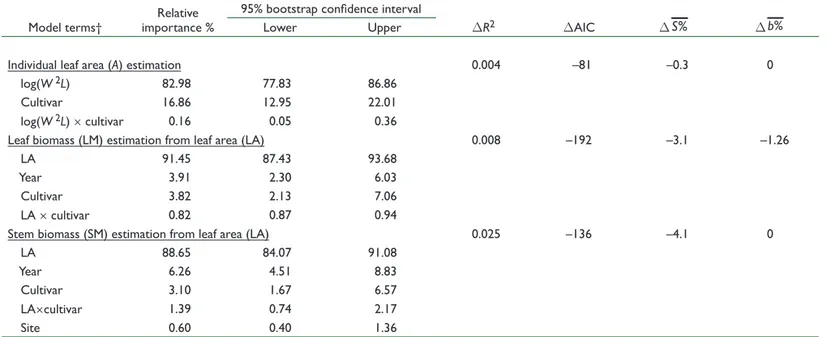
Once the best model for each allometric relationship was selected, the relative importance of cultivar and environmental factors (year and site) was investigated. A summary of all terms of the minimally adequate model and their relative importance is presented in Table 4. Explanatory variables (i.e., linear measurements and crop leaf area for the estimation of leaf area or leaf and stem mass, respectively) always accounted for >83% of the variance explained by the model. Among covariates, cultivar was the most influential and accounted for 17, 4, and 3% of the explained variance for leaf area, leaf mass, and stem mass, respectively, while year accounted for 0, 4, and Table 2. Summary (minimum, maximum, and mean ± SD values) of the calibration and validation data sets used to build predictive allometric models to assess the vegetative growth of the two main species of yam.
Data set Species Site n Min. Max. Mean ± SD Min. Max. Mean ± SD Min. Max. Mean ± SD
Leaf and stem mass estimation
— crop leaf area (m2 m–2) — —— leaf dry weight (g m–2) —— —— stem dry weight (g m–2) ——
Calibration D. alata Cotonou 160 0.03 3.70 0.68 ± 0.75 1.44 234.00 40.50 ± 43.29 1.78 198.00 30.54 ± 34.51
Glazoue 70 0.01 3.33 0.76 ± 0.59 0.40 188.00 45.02 ± 33.46 3.00 141.00 31.24 ± 25.14
D. rotundata Cotonou 200 0.02 3.00 0.92 ± 0.76 1.00 160.00 45.00 ± 36.66 2.03 122.00 40.31 ± 27.28
Glazoue 90 0.03 1.69 0.51 ± 0.45 1.70 88.00 25.91 ± 22.78 1.70 74.00 22.10 ± 17.56
Validation D. alata Duclos 100 0.10 3.20 0.68 ± 0.71 5.21 117.19 28.76 ± 25.95 4.17 77.29 19.92 ± 16.76
Godet 60 0.10 2.00 0.79 ± 0.52 6.67 91.67 41.44 ± 24.31 5.00 66.83 31.98 ± 16.18 Cotonou 25 0.04 1.48 0.40 ± 0.34 2.33 108.21 26.51 ± 24.69 3.67 62.44 19.56 ± 14.07 Glazoue 25 0.06 1.18 0.36 ± 0.27 4.00 75.00 22.98 ± 17.03 1.00 49.00 14.27 ± 10.35 D. rotundata Cotonou 25 0.17 2.46 0.80 ± 0.59 8.66 121.59 39.33 ± 28.74 13.33 92.42 34.08 ± 18.06 Glazoue 24 0.11 0.91 0.36 ± 0.20 6.00 48.00 18.76 ± 10.59 4.00 32.00 13.35 ± 6.05 Leaf area estimation
— leaf max. length (cm) — ——— leaf max. width (cm) ——— ———— leaf area (cm2)————
Calibration D. alata Duclos 226 6.6 24.4 14.1 ± 3.6 3.6 13.2 7.53 ± 1.97 15.0 178.00 66.74 ± 32.79
Godet 230 5.2 18.6 11.9 ± 3.2 3.6 11.0 6.60 ± 1.61 7.0 164.00 45.82 ± 24.29
Validation D. alata Duclos 244 5.9 27.2 12.6 ± 4.1 2.7 16.2 6.64 ± 2.77 8.4 265.78 56.48 ± 46.48
Glazoue 55 7.6 17.5 11.4 ± 2.9 3.7 11.5 6.50 ± 2.20 13.9 116.79 47.43 ± 30.90 D. rotundata Glazoue 55 5.4 13.3 9.3 ± 1.8 3.7 11.3 6.50 ± 1.78 13.8 82.10 40.32 ± 17.49 Table 3. Candidate allometric models ranked by performance metrics: Akaike information criterion (AIC), mean standard error percentage (S%), adjusted coefficient of determination (R2) , and the model bias (b%). Model† AIC S% R2 b% Individual leaf area (A) estimation A = a(W 2L)b –663 5.4 0.987 –0.08 A = a(W 2M)b –663 5.6 0.987 –0.09 A = a(WL)b –615 5.4 0.985 0.15 A = a(WM)b –612 6.0 0.984 0.15 A = a(WLM)b –407 8.2 0.968 0.29 A = aWb –311 11.2 0.955 –0.63 A = aLb –39 15.1 0.884 0.04 A = a(LM)b –14 16.0 0.873 0.03 A = aMb 44 18.0 0.845 –0.09 Leaf mass (LM) estimation from leaf area (LA) LM = bLA 1972 10.5 0.977 –1.26 LM = aLAb 1975 10.6 0.963 1.45 Stem mass (SM) estimation from leaf area (LA) SM = a + bLA 1956 15.3 0.935 0.00 SM = aLAb 1978 16.4 0.875 –1.73 † L is the maximum length, M is the midrib length, W is the maximum width, and a and b are model parameters.
6%, respectively (Table 4). The relative importance of site and interaction terms was always <1.5%. These results suggest that the effects of year, site, and their interaction had negligible impact on the performance of the models.
Despite the quite large fraction of the variance explained by cultivars for the estimation of leaf area (17%), their inclusion only slightly improved model performance compared with the pooled regression (S% decreased by only 0.3). In view of the lack of bias when using a common model for leaf area estimation, it seemed a reasonable approximation to apply a common equation derived from the pooled data. Conversely, the use of cultivar-specific models decreased S% by 3.1 and 4.1% for leaf and stem mass estimates, respectively. However, this study included 10 cultivars, whereas Dansi et al. (1999) reported that there were 560 cultivars just within Benin, so the use of cultivar-specific models limits the scope of their application. To include genotypic differences while keeping the method sufficiently generic, we defined species-specific models. Indeed, the studied species cover 90% of yam production worldwide (FAO, 2012). Hence, leaf and stem mass species-specific models were fitted and compared with the pooled regression. Because they performed significantly better, they were kept for the validation step. Final model parameters and
their confidence intervals are summarized in Table 5. Leaf area estimation was best described by a power model calibrated on pooled data. Conversely, leaf and stem mass estimations were best fitted with species-specific linear models. Only in the estimation of the stem mass of D. rotundata was the intercept significantly different from zero. Differences between species may be due to the heteroblastic growth of D. rotundata. Indeed, leaves at the first few nodes of this species may be reduced to form modified shield-shaped cataphylls (Onwueme, 1978). These cataphylls are thick, lack a distinct leaf lamina, and are limited in aerial spread. Cornet (unpublished data, 2014) observed that a D. rotundata plant can bear up to 16 nodes carrying cataphylls before the appearance of the first true leaf, while cataphyll occurrence in D. alata was scarce (<2%). Thus, plants bearing cataphylls produce significant stem mass before developing any leaf area and thus could modify the intercept of the leaf area–stem mass relationship.
Model Validation
Final models were validated against a completely independent data set (Table 1). The S% of the model was distinctly higher for validation than for calibration (Table 5). However, the adjusted coefficient of determination was Table 5. Summary of final model parameter values (mean and confidence interval, CI) and performance at the calibration and validation stages accord-ing to the adjusted coefficient of determination (R2), mean standard error percentage (S%), and model bias (b%).
Model Model parameters Model performance a b Calibration phase Validation phase Mean CI Mean CI R2 S% b% R2 S% b% Individual leaf area estimation (A) from leaf maximum width (W) and maximum length (L): A = a(W 2L)b Pooled 0.74 (0.7–0.78) 1.941 (1.92–1.96) 0.987 5.4 0.0 0.969 9.7 1.2 Leaf biomass (LM) estimation from crop leaf area (LA): LM = bLA D. alata 0 (0–0) 57.52 (56.5–58.5) 0.990 8.3 –1.1 0.975 11.6 –0.8 D. rotundata 0 (0–0) 48.81 (48.1–49.5) Stem biomass (SM) estimation from crop leaf area (LA): SM = a + bLA D. alata 0 (0–0) 42.08 (41.1–43.1) 0.943 13.8 0.0 0.935 23.2 9.3 D. rotundata 7.83 (6.27–9.39) 34.40 (32.9–35.9) Table 4. Summary of the relative influence of the experimental factors and their interactions on the allometric models. Bootstrap confidence intervals for relative importance were based on 1000 samples. Differences in model performance were calculated between the minimum adequate model and the equivalent pooled regression (DR2, difference in adjusted coefficient of determination; DAIC, difference in Akaike information criteria; DS%
, dif-ference in mean standard error percentage; and Db%, difference in the model bias).
Model terms† importance %Relative
95% bootstrap confidence interval DR2 DAIC DS% D %b Lower Upper Individual leaf area (A) estimation 0.004 –81 –0.3 0 log(W 2L) 82.98 77.83 86.86 Cultivar 16.86 12.95 22.01 log(W 2L) × cultivar 0.16 0.05 0.36 Leaf biomass (LM) estimation from leaf area (LA) 0.008 –192 –3.1 –1.26 LA 91.45 87.43 93.68 Year 3.91 2.30 6.03 Cultivar 3.82 2.13 7.06 LA × cultivar 0.82 0.87 0.94 Stem biomass (SM) estimation from leaf area (LA) 0.025 –136 –4.1 0 LA 88.65 84.07 91.08 Year 6.26 4.51 8.83 Cultivar 3.10 1.67 6.57 LA×cultivar 1.39 0.74 2.17 Site 0.60 0.40 1.36 † L is the maximum length, M is the midrib length, and W is the maximum width.
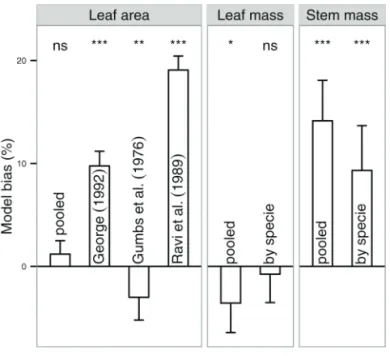
always above 0.93 and, except for stem mass (b% = 9.3%), the bias was negligible (–0.8 and 1.2 for leaf mass and leaf area estimation, respectively). Comparing the leaf area model obtained in this study with available models from the literature confirmed its greater accuracy (Fig. 1). Indeed, the model developed in this study always outperformed models from the literature. A paired Student’s t-test did not reveal any differences between the estimated and observed leaf areas using our model, but significant differences were observed when using the published models.
Models to estimate yam leaf and stem mass could not be found in the available literature. No differences between estimated and observed leaf mass were observed using our model. Moreover, the use of species-specific models decreased the model bias for both leaf and stem mass estimation (Fig. 1). However, the estimation of stem mass was very biased. The diagnostic plot shows clear differences between the stem mass model and the leaf area model (Fig. 2). Estimated and observed values were closely correlated for both leaf area and stem mass models (0.99 and 0.95, respectively), but the slope of the regression line was significantly different from 1 for stem mass but not for leaf area. This confirmed the formerly observed bias in stem mass estimation and showed that this bias was greater for D. rotundata than D. alata (slopes of 1.09 vs. 1.05, respectively). Residuals of the stem mass model, particularly those for D. rotundata, showed a biased and heteroscedastic pattern, with a clear overestimation for stem mass >30 g. The potential number of cataphylls per stem depends on the seed-tuber physiological age and weight (unpublished data, 2014). Because of differences in agricultural practices, the mean physiological age and weight of the seed tuber varied among trials. This could have led to the presence of varying numbers of cataphylls per stem, which may explain the large differences in the leaf/stem
ratio among trials. To overcome this lack of reliability, we analyzed the relationship between the number of samples and the performance of the stem mass model. The variation in the estimate of the model parameter b tended to decline as the sampling size increased (Fig. 3A). The inferred model bias decreased sharply with an increased number of samples and fell below 2% with 86 samples (Fig. 3B). Depending on the user’s requirements from the model, a suitable sample size may be chosen to obtain the necessary precision.
The proposed models were tested and calibrated for a given range of validity (Table 2). The leaf area estimation from linear measurements was performed on heart-shaped leaves and should be applied to species presenting different leaf shapes (e.g., D. dumetorum or D. trifida). Moreover, while the leaf area estimation from linear measurements is independent of the growth stage and could be applied throughout the growing season, the estimation of leaf and stem mass from the crop leaf area may depend on the growth stage and thus cannot be estimated with the same expected accuracy after tuber initiation. Moreover, senescence may change these relationships Fig. 1. Statistical analysis (Student’s t-test for paired data) of the deviation between the estimated and observed leaf area, leaf mass, and stem mass. Estimates were based on the final best models (pooled or species specific) of this study and models from the literature where available. Vertical bars denote the bias, and spreads denote 95% confidence intervals; ns = nonsignificant, *significant at P < 0.05, **significant at P < 0.01, and ***significant at P < 0.001. Fig. 2. Diagnostic plots of allometric models to predict (A) leaf area and (B) stem mass for the two main yam species (D. alata and D.
rotundata): (A) main plot presents the regression of estimated vs. actual values (black line and equation) of the pooled allometric model for leaf area estimation from linear measurement, while the inset presents the residuals of the model compared with the data estimated by the model; (B) main plot presents the regression of estimated vs. actual values (lines and equations) of the species-specific allometric model for stem mass estimation from crop leaf area, while the inset presents the residuals of the model compared with the data estimated by the model.
drastically. Finally, building models can take time and it is important to continue to test and improve them as new data become available.
COnCluSiOn
In this study, very close relationships were found between the estimated and observed values of leaf area at the leaf level and those of leaf and stem mass at the crop level. Simple models were selected and calibrated. A power model applicable to both yam species was found to best predict a leaf’s area in square centimeters (A) from its linear dimensions: A = 0.74(W 2L)1.94, where W is the maximum leaf width
and L is the maximum leaf length, both in centimeters. Conversely, linear relationships were found between crop leaf area (LA in m2 of leaves m–2 of ground) and leaf mass (LM
in g m–2) and stem mass (SM in g m–2). The use of
species-specific models for leaf and stem mass estimation significantly improved model performance: LMD. rotundata = 48.81 LA, LMD. alata = 57.52 LA, SMD. rotundata = 7.83 + 34.40 LA, and SMD. alata = 42.08 LA, where LA is the crop leaf area.
Models were all validated against a completely independent data set. Models predicting the leaf area and leaf mass of yam (D. alata and D. rotundata) proved to be reliable and accurate. Unfortunately, such a relationship for stem mass was found to be less reliable, and a systematic overestimation of predicted values was observed during validation. To overcome the significant differences in the leaf/stem ratio among years, experiments, and cultivars, a method that allows the user to calibrate the model, tailoring the sample size to the desired precision, is proposed. All proposed models
represent practical, cheap, and reliable alternatives for an accurate and nondestructive estimation of key variables of yam vegetative growth.
ACknOwlEDgMEntS
We thank M. Sodanhoun, C. Adiba, D. Damissi, J. Lawson, and E. Patetsos for field assistance and data acquisition, Dr. R. Bonhomme for helpful comments on the manuscript, and A. Scaife and K. Cockshull for English revision.
REFEREnCES
Austin, P., and J. Tu. 2004. Bootstrap methods for developing predictive models. Am. Stat. 58:131–137. doi:10.1198/0003130043277
Bradu, D., and Y. Mundlak. 1970. Estimation in lognormal linear models. J. Am. Stat. Assoc. 65:198–211. doi:10.1080/01621459.1970.10481074 Chatterton, N.J., D.R. Lee, and W.E. Hungerford. 1972. Diurnal change in
specific leaf area weight of Medicago sativa L. and Zea mays L. Crop Sci.
12:576–578. doi:10.2135/cropsci1972.0011183X001200050008x Clifford, D., N. Cressie, J.R. England, S.H. Roxburgh, and K.I. Paul. 2013.
Correction factors for unbiased, efficient estimation and prediction of biomass from log–log allometric models. For. Ecol. Manage. 310:375– 381. doi:10.1016/j.foreco.2013.08.041
Cooper, C.S., and M. Qualls. 1967. Morphology and chlorophyll content of shade and sun leaves of two legumes. Crop Sci. 7:672–673. doi:10.2135/ cropsci1967.0011183X000700060036x
Cornet, D. 2005. Etude du fonctionnement physiologique d’un couvert végétal d’igname (Dioscorea alata L.). M.S. thesis. Univ. of Gembloux,
Gembloux, Belgium.
Cornet, D., J. Sierra, R. Tournebize, and B. Ney. 2014. Yams (Dioscorea spp.)
plant size hierarchy and yield variability: Emergence time is critical. Eur. J. Agron. 55:100–107. doi:10.1016/j.eja.2014.02.002
Crawley, M.J. 2007. The R book. John Wiley & Sons, New York.
Dansi, A., H.D. Mignouna, J. Zoundjekpon, A. Sangare, R. Asiedu, and F.M. Quin. 1999. Morphological diversity, cultivar groups and possible descent in the cultivated yams (Dioscorea cayenensis/D. rotundata)
complex in Benin Republic. Genet. Resour. Crop Evol. 46:371–388. doi:10.1023/A:1008698123887
den Dubbelden, K.C., and R.W. Verburg. 1996. Inherent allocation patterns and potential growth rates of herbaceous climbing plants. Plant Soil 184:341–347. doi:10.1007/BF00010463
FAO. 1998. World reference base for soil resources. World Soil Resour. Rep. 84. FAO, Rome.
FAO. 2012. FAOSTAT. FAO, Rome. http://faostat3.fao.org/home/E (accessed 11 Oct. 2012).
George, J. 1992. Leaf area estimation in dwarf white yam (Dioscorea rotundata)
by linear measurements. J. Root Crops 18:134–135.
Gianoli, E. 2003. Phenotypic responses of the twining vine Ipomoea purpurea
(Convolvulaceae) to physical support availability in sun and shade. Plant Ecol. 165:21–26. doi:10.1023/A:1021412030897
Grömping, U. 2006. Relative importance for linear regression in R: The package relaimpo. J. Stat. Softw. 17(1).
Gumbs, F.A., and T.U. Ferguson. 1976. Effect on tuber yield of the exposure of yam to light. Agron. J. 68:831–832. doi:10.2134/agronj1976.000219 62006800050040x
Johnson, J.B., and K.S. Omland. 2004. Model selection in ecology and evolution. Trends Ecol. Evol. 19:101–108. doi:10.1016/j.tree.2003.10.013 Kandiannan, K., C. Kailasam, K.K. Chandaragiri, and N. Sankaran.
2002. Allometric model for leaf area estimation in black pepper (Piper nigrum L.). J. Agron. Crop Sci. 188:138–140.
doi:10.1046/j.1439-037X.2002.00540.x
Koller, H.R. 1972. Leaf area–leaf weight relationships in the soybean canopy. Crop Sci. 12:180–181. doi:10.2135/cropsci1972.0011183X0012000200 07x
Lindeman, R.H., P.F. Merenda, and R.Z. Gold. 1980. Introduction to bivariate and multivariate analysis. Scott Foresman, Glenview, IL.
Lu, H.-Y., C.-T. Lu, M.-L. Wei, and L.-F. Chan. 2004. Comparison of different models for nondestructive leaf area estimation in taro. Agron. J. 96:448– 453. doi:10.2134/agronj2004.0448 Fig. 3. The main plot (A) presents the bootstrapped (n = 100) estimate of the parameter b of the stem mass (SM) model based on leaf area (LA) (SM = a LAb) as a function of the sample size. The dashed gray lines represent the 99% confidence intervals of the mean of the conversion factor for each sample size. The inset (B) presents the model bias as a function of the sample size.
Marcos, J., D. Cornet, F. Bussière, and J. Sierra. 2011. Water yam (Dioscorea alata L.) growth and yield as affected by the planting date: Experiment
and modeling. Eur. J. Agron. 34:247–256. doi:10.1016/j.eja.2011.02.002 McCarthy, M.C., and B.J. Enquist. 2007. Consistency between an
allometric approach and optimal partitioning theory in global patterns of plant biomass allocation. Funct. Ecol. 21:713–720. doi:10.1111/j.1365-2435.2007.01276.x
Müller, I., B. Schmid, and J. Weiner. 2000. The effect of nutrient availability on biomass allocation patterns in 27 species of herbaceous plants. Perspect. Plant. Ecol. Evol. Systematics 3:115–127. doi:10.1078/1433-8319-00007 Niklas, K.J. 2004. Plant allometry: Is there a grand unifying theory? Biol. Rev.
Camb. Philos. Soc. 79:871–889. doi:10.1017/S1464793104006499 Normand, F., and P.E. Lauri. 2012. Assessing allometric models to predict
vegetative growth of mango (Mangifera indica; Anacardiaceae) at
the current-year branch scale. Am. J. Bot. 99:425–437. doi:10.3732/ ajb.1100249
Onwueme, I.C. 1978. Set weight effects on time of tuber formation and on tuber yield characteristics in water yam (Dioscorea alata L.). J. Agric. Sci.
91:317–319. doi:10.1017/S0021859600046402
Onwueme, I.C., and J.A. Haverkort. 1991. Modelling growth and productivity of yams (Dioscorea spp): Prospects and problems. Agric. Syst. 36:351–
367. doi:10.1016/0308-521X(91)90015-3
Patetsos, E. 2001. Etude du comportement de quatre variétés d’igname
Dioscorea alata en fonction de contraintes agropédoclimatiques
différentes en Guadeloupe. M.S. thesis. Ecole d’Agro-Economie Int., Cergy-Pontoise, France.
Pompelli, M.F., W.C. Antunes, D.T.R.G. Ferreira, P.G.S. Cavalcante, H.C.L. Wanderley-Filho, and L. Endres. 2012. Allometric models for non-destructive leaf area estimation of Jatropha curcas. Biomass Bioenergy
36:77–85. doi:10.1016/j.biombioe.2011.10.010
Poorter, H., K.J. Niklas, P.B. Reich, J. Oleksyn, P. Poot, and L. Mommer. 2012. Biomass allocation to leaves, stems and roots: Meta-analyses of interspecific variation and environmental control. New Phytol. 193:30– 50. doi:10.1111/j.1469-8137.2011.03952.x
R Core Team. 2013. R: A language and environment for statistical computing. R Found. for Stat. Comput., Vienna. http://www.R-project.org (accessed 14 May 2014).
Ravi, V., and R.S. Chowdhury. 1989. A method for leaf area determination in
Dioscorea. J. Root Crops 15:45–48.
Reddy, V.R., B. Acock, D.N. Baker, and M. Acock. 1989. Seasonal leaf area–leaf weight relationship in the cotton canopy. Agron. J. 81:1–4. doi:10.2134/ agronj1989.00021962008100010001x
Sestak, Z., J. Catsky, and P.G. Jarvis, editors. 1971. Plant photosynthetic production: Manual of methods. Dr. W. Junk, The Hague.
Shaeffer, D.L. 1980. A model evaluation methodology applicable to environmental assessment models. Ecol. Modell. 8:275–295. doi:10.1016/0304-3800(80)90042-3
Shipley, B., and D. Meziane. 2002. The balanced-growth hypothesis and the allometry of leaf and root biomass allocation. Funct. Ecol. 16:326–331. doi:10.1046/j.1365-2435.2002.00626.x
Sinoquet, H., and B. Andrieu. 1993. The geometrical structure of plant canopies: Characterization and direct measurement methods. In: C. Varlet-Grancher et al., editors, Crop structure and light microclimate, characterization and applications. INRA, Paris. p. 131–158.
Varshney, R.K., J.M. Ribaut, E.S. Buckler, R. Tuberosa, J.A. Rafalski, and P. Langridge. 2012. Can genomics boost productivity of orphan crops? Nat. Biotechnol. 30:1172–1176. doi:10.1038/nbt.2440
Walther, B.A., and J.L. Moore. 2005. The concepts of bias, precision and accuracy, and their use in testing the performance of species richness estimators, with a literature review of estimator performance. Ecography 28:815–829. doi:10.1111/j.2005.0906-7590.04112.x
Werth, M., A.K. Spiegel, and M. Kazda. 2013. Leaf allocation patterns and
13C and 15N natural abundances of tropical lianas (Passiflora sp.) as
dependent on external climbing support. Isot. Environ. Health Stud. 49:98–108. doi:10.1080/10256016.2012.715159