HAL Id: hal-01820559
https://hal.archives-ouvertes.fr/hal-01820559
Submitted on 21 Jun 2018
HAL is a multi-disciplinary open access
archive for the deposit and dissemination of
sci-entific research documents, whether they are
pub-lished or not. The documents may come from
teaching and research institutions in France or
abroad, or from public or private research centers.
L’archive ouverte pluridisciplinaire HAL, est
destinée au dépôt et à la diffusion de documents
scientifiques de niveau recherche, publiés ou non,
émanant des établissements d’enseignement et de
recherche français ou étrangers, des laboratoires
publics ou privés.
Distributed under a Creative Commons Attribution| 4.0 International License
Florent Murat, Sébastien Duplessis, Sébastien Faye, Nicolas Francillonne,
Karine Labadie, Grégoire Le Provost, et al.
To cite this version:
Christophe Plomion, Jean-Marc Aury, Joelle Amselem, Thibault Leroy, Florent Murat, et al.. Oak
genome reveals facets of long lifespan. Nature Plants, Nature Publishing Group, 2018, 4 (7),
pp.440-452. �10.1038/s41477-018-0172-3�. �hal-01820559�
1BIOGECO, INRA, Université de Bordeaux, Cestas, France. 2Commissariat à l’Energie Atomique (CEA), Genoscope, Institut de Biologie François-Jacob,
Evry, France. 3URGI, INRA, Université Paris-Saclay, Versailles, France. 4GDEC, INRA-UCA, Clermont-Ferrand, France. 5IAM, INRA, Université de Lorraine,
Champenoux, France. 6HelixVenture, Mérignac, France. 7INRA, US 1279 EPGV, Université Paris-Saclay, Evry, France. 8BIOFORA, INRA, Orléans, France. 9AGAP, Université de Montpellier, CIRAD, INRA, Montpellier SupAgro, Montpellier, France. 10Department of Ecology and Genetics, Evolutionary Biology
Centre, Science for Life Laboratory, Uppsala University, Uppsala, Sweden. 11CIRAD, UMR AGAP, Montpellier, France. 12Université de Montpellier, CIRAD,
INRA, Montpellier SupAgro, Montpellier, France. 13CNRGV, INRA, Castanet, France. 14UMR Silva, INRA, Université de Lorraine, AgroPariTech, Nancy,
France. 15Department of Soil Ecology, UFZ–Helmholtz Centre for Environmental Research, Halle/Saale, Germany. 16Plateforme bioinformatique Toulouse
Midi-Pyrénées, INRA, Auzeville Castanet-Tolosan, France. 17Université de Toulouse, CNRS, UMR 5546, LRSV, Castanet-Tolosan, France. 18German Centre
for Integrative Research (iDiv), Halle–Jena–Leipzig, Leipzig, Germany. 19SVQV, Université de Strasbourg, INRA, Colmar, France. 20Université de Perpignan,
UMR 5096, Perpignan, France. 21Laboratori del Suro, University of Girona, Girona, Spain. 22Department of Biological Sciences, George Washington
University, Washington, DC, USA. 23Génomique Métabolique, Genoscope, Institut de Biologie François-Jacob, Commissariat à l’Energie Atomique (CEA),
CNRS, Université d’Evry, Université Paris-Saclay, Evry, France. 24These authors contributed equally: Christophe Plomion, Jean-Marc Aury, Joëlle Amselem.
*e-mail: christophe.plomion@inra.fr
Oaks are an important part of our natural and cultural
heri-tage. Not only are they ubiquitous in our most common
land-scapes
1but they have also supplied human societies with
invaluable services, including food and shelter, since
pre-historic times
2. With 450 species spread throughout Asia,
Europe and America
3, oaks constitute a critical global
renew-able resource. The longevity of oaks (several hundred years)
probably underlies their emblematic cultural and historical
importance. Such long-lived sessile organisms must persist
in the face of a wide range of abiotic and biotic threats over
their lifespans. We investigated the genomic features
associ-ated with such a long lifespan by sequencing, assembling and
annotating the oak genome. We then used the growing
num-ber of whole-genome sequences for plants (including tree and
herbaceous species) to investigate the parallel evolution of
genomic characteristics potentially underpinning tree
longev-ity. A further consequence of the long lifespan of trees is their
accumulation of somatic mutations during mitotic divisions of
stem cells present in the shoot apical meristems. Empirical
4and modelling
5approaches have shown that intra-organismal
genetic heterogeneity can be selected for
6and provides direct
fitness benefits in the arms race with short-lived pests and
pathogens through a patchwork of intra-organismal
pheno-types
7. However, there is no clear proof that large-statured
trees consist of a genetic mosaic of clonally distinct cell
lin-eages within and between branches. Through this case study
of oak, we demonstrate the accumulation and transmission of
somatic mutations and the expansion of disease-resistance
gene families in trees.
We sequenced the highly heterozygous genome of
peduncu-late oak (Quercus robur L.; Supplementary Notes 1 and 2) using
a combination of long and short sequence reads (Supplementary
Table 1). We generated a highly contiguous haploid genome
sequence of a heterozygous tree comprising 1,409 nuclear
scaffolds, with an N50 of 1.35 Mb (Supplementary Note 2.2,
Supplementary Table 2, Supplementary Fig. 1). A comparison
with existing tree genomes is shown in Supplementary Table 3.
In total, 871 scaffolds, covering 96% (716.6 Mb) of the estimated
Oak genome reveals facets of long lifespan
Christophe Plomion
1,24*, Jean-Marc Aury
2,24, Joëlle Amselem
3,24, Thibault Leroy
1,
Florent Murat
4, Sébastien Duplessis
5, Sébastien Faye
2, Nicolas Francillonne
3, Karine Labadie
2,
Grégoire Le Provost
1, Isabelle Lesur
1,6, Jérôme Bartholomé
1, Patricia Faivre-Rampant
7,
Annegret Kohler
5, Jean-Charles Leplé
8, Nathalie Chantret
9, Jun Chen
10, Anne Diévart
11,12,
Tina Alaeitabar
3, Valérie Barbe
2, Caroline Belser
2, Hélène Bergès
13, Catherine Bodénès
1,
Marie-Béatrice Bogeat-Triboulot
14, Marie-Lara Bouffaud
15, Benjamin Brachi
1, Emilie Chancerel
1,
David Cohen
14, Arnaud Couloux
2, Corinne Da Silva
2, Carole Dossat
2, François Ehrenmann
1,
Christine Gaspin
16, Jacqueline Grima-Pettenati
17, Erwan Guichoux
1, Arnaud Hecker
5,
Sylvie Herrmann
18, Philippe Hugueney
19, Irène Hummel
14, Christophe Klopp
16, Céline Lalanne
1,
Martin Lascoux
10, Eric Lasserre
20, Arnaud Lemainque
2, Marie-Laure Desprez-Loustau
1,
Isabelle Luyten
3, Mohammed-Amin Madoui
2, Sophie Mangenot
2, Clémence Marchal
5,
Florian Maumus
3, Jonathan Mercier
2, Célia Michotey
3, Olivier Panaud
20, Nathalie Picault
20,
Nicolas Rouhier
5, Olivier Rué
16, Camille Rustenholz
19, Franck Salin
1, Marçal Soler
17,21, Mika Tarkka
15,
Amandine Velt
19, Amy E. Zanne
22, Francis Martin
5, Patrick Wincker
23, Hadi Quesneville
3,
physical size of the oak genome and containing 90% of the 25,808
predicted protein-coding genes (Supplementary Data Set 1,
Supplementary Note 3.3), were anchored to the 12 oak
chromo-somes. To this end, we used the existing high-density oak
gene-based linkage map
8combined with a synteny-driven approach
using Prunus persica as a pivotal genome. Non-anchored scaffolds
harbouring genes syntenic to peach were placed on the
pseudo-molecules based on the local microsynteny identified between oak
and peach (Fig.
1
, Supplementary Note 2.3, Supplementary Fig. 2,
Supplementary Data Set 2). Overall, 52% of the genome was found
to consist of diverse transposable elements (TEs), which were
dominated by class I retrotransposons (70%) (Supplementary
Table 4, Supplementary Fig. 3, Supplementary Notes 3.1 and
3.4). Genome-wide genetic diversity, as assessed by an analysis of
single-nucleotide polymorphisms (SNPs) at the individual level
(heterozygosity rate) and using a population of 20 genotypes (π ),
amounted to ~1%, with significant variation within and between
chromosomes (Fig.
1
, Supplementary Fig. 4). Nucleotide diversity
in protein-coding genes was 0.011 for fourfold degenerate sites
and 0.005 for non-degenerate sites, with a
non-synonymous-to-synonymous nucleotide diversity ratio (π
0/π 4) of 0.44. Acompari-son of these values with those obtained in a recent survey of plant
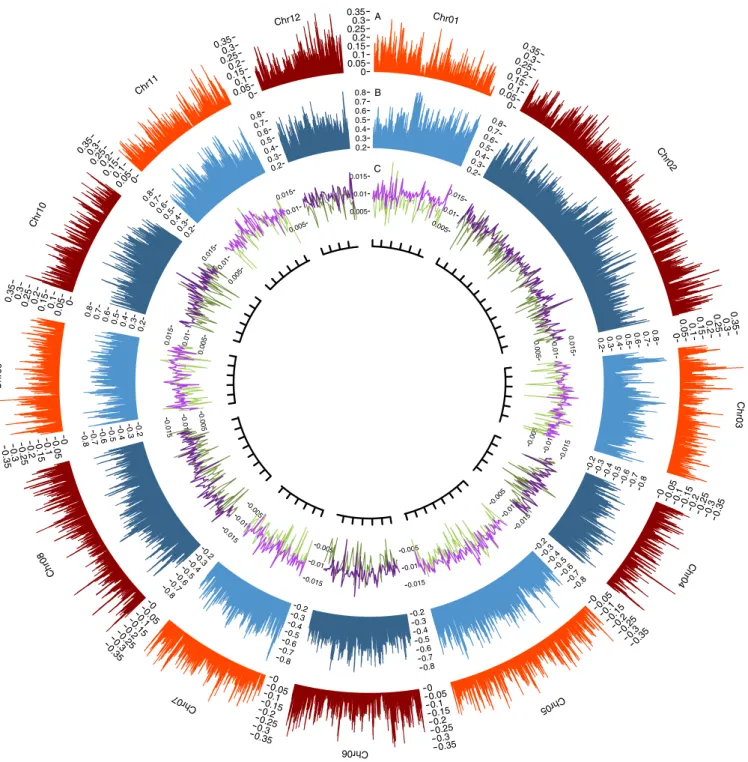
Chr01 0 0.050.1 0.150.2 0.250.3 0.35 Chr0 2 0 0.050.1 0.150.2 0.250.3 0.35 Chr03 00.05 0.10.15 0.2 0.25 0. 3 0.35 Chr04 0 0.05 0.10.15 0.2 0.25 0.3 0.35 Chr05 00.05 0.10.15 0.20.25 0.30.35 Chr06 0 0.05 0.1 0.15 0.2 0.25 0.3 0.35 Chr0 7 0 0.05 0.1 0.15 0.2 0.25 0.3 0.35 Chr0 8 0 0.0 5 0.1 0.15 0.2 0.25 0.3 0.35 Chr09 0 0.05 0. 1 0.15 0.2 0.25 0. 3 0.35 Chr10 0 0.05 0.1 0.15 0.2 0.25 0.3 0.35 Chr11 0 0.05 0.1 0.15 0.2 0.25 0.3 0.35 Chr12 0 0.050.1 0.150.2 0.250.3 0.35 0.2 0.3 0.4 0.5 0.6 0.7 0.8 0.20.3 0.40.5 0.60.7 0.8 0. 2 0.3 0.4 0.5 0.6 0.7 0.8 0.2 0.30.4 0.5 0.6 0.70.8 0.2 0.3 0.4 0.5 0.6 0.7 0.8 0.2 0.3 0.4 0.5 0.6 0.7 0.8 0.2 0.3 0.4 0.5 0.6 0.7 0.8 0.2 0.3 0.4 0.5 0.6 0.7 0.8 0. 2 0. 3 0. 4 0. 5 0. 6 0. 7 0. 8 0.2 0.3 0.4 0.5 0.6 0.7 0.8 0.2 0.3 0.4 0.5 0.6 0.7 0.8 0.2 0.3 0.4 0.5 0.6 0.7 0.8 0.005 0.01 0.015 0.01 0.015 0.00 5 0.01 0.01 5 0.005 0.01 0.015 0.005 0.01 0.015 0.005 0.01 0.015 0.005 0.01 0.015 0.00 5 0.01 0.01 5 0.005 0.01 0.015 0.005 0.01 0.015 0.005 0.01 0.015 0.005 0.01 0.015 A B C 0.005
Fig. 1 | Genomic landscape of the 12 assembled oak chromosomes. Gene (A) and TE (B) density, percentage heterozygosity (purple in C) and genetic diversity (green in C). These four metrics are calculated in 1-Mb sliding windows, moved in 250-kb steps. A ruler is drawn on each chromosome, with tick marks every 10 Mb.
and animal species
9indicated that oak was remarkable in terms of
both its high nucleotide diversity (π
4) and the high rate at which itaccumulates deleterious mutations (Fig.
2a
, Supplementary Note
4.1). Indeed, the value for oak shows the largest deviation from the
regression line, with the largest residual (0.25) compared with the
other 37 plant species (ranging from − 0.13 to 0.12).
−3.0 −2.5 −2.0 −1.5 −0.8 −0.7 −0.6 −0.5 −0.4 −0.3 a b log 10 (π0 /π4 ) log10(π4) A.thaliana S.bicolor M.truncatula P.trichocarpa P.nigra P.tremula P.tremuloides P.euphratica P.pruinosa B.pendula V.vinifera T.aestivum S.huaylasense C.hardwickii Z.mays G.soja C.sinensis O.rufipogon O.longistaminata O.barthii B.distachyon C.canephora C.lanatus lanatus E.grandis M.glaziovii C.grandiflora P.dactylifera A.trichopoda Annual selfer Annual outcrosser Perennial selfer Perennial outcrosser Pinus P.albicaulis P.aristata P.ayacahuite P.balfouriana P.flexilis P.monticola P.monophylla P.strobiformis P.strobus Quercus robur Chr 1 55 Mb 115 MbChr 2 57 MbChr 3 44 MbChr 4 70 MbChr 5 57 MbChr 6 52 MbChr 7 71 MbChr 8 50 MbChr 9 Chr 1050 Mb Chr 1152 Mb Chr 1238 Mb 15 years 47 years 85 years Age of the seed L1 L2 L3 XL2 XL1 Transmission of 19 somatic mutations to offspring n=93 n=23
Fig. 2 | Genetic diversity and somatic mutations. a, Distribution of π 0/π 4 plotted against π 4 among plants (modified from a previous publication9), including
oak (red square). Species names are according to9. b, Genomic location of somatic mutations along the 12 chromosomes of a 100-year-old oak tree. Mutations
are represented as coloured arrows according to where they took place during tree growth (see inset). Location and age (left of the trunk) of the three levels (L1, L2 and L3) sampled for somatic mutation detection in the reference pedunculate oak genotype 3P. L1, L2 and L3 represent the end of selected branches; XL1 and XL2 represent L1-branch and L2-branch initiation sites, respectively. For each branch, the recovery or non-recovery of mutations in acorns is indicated
In addition to the spontaneous meiotic mutations in each
gen-eration, long-lived plants are expected to accumulate somatic
muta-tions throughout their lifetime. These mutamuta-tions occur during the
mitotic divisions of stem cells in the shoot apical meristems
4. In
trees, unlike animals, these mutations can be passed from the soma
to the reproductive tissue and on to the offspring. Somatic
muta-tions may therefore increase genetic diversity in long-lived trees
such as oaks. Oaks have weak apical control (that is, an inability
to control the flushing and growth of lateral buds from the
previ-ous year
10), resulting in a multi-stemmed morphology. As such,
oaks constitute a particularly appropriate model for studies of the
somatic generation of diversity. We sampled buds at the extremities
of branches initiated at the ages 15, 47 and 85 years on the
refer-ence tree sequrefer-enced in this study (Fig.
2b
, Supplementary Fig. 5).
Using a frequency-dependent method for detecting somatic point
mutations in genomic DNA
11, we identified 46 reliable somatic
mutations (Supplementary Note 4.2, Supplementary Table 5) most
of which (44) were located on scaffolds anchored to the 12
chromo-somes (Fig.
2b
). Compared with a recent report that also used the
pedunculate oak as a model system
12, we detected 2.7 times more
somatic mutations on a tree that was 3 times younger. This
differ-ence is probably due to our superior ability to detect somatic
muta-tions on a higher fraction of the genome (owing to the quality of our
genome assembly) and smaller changes in allele frequency by
apply-ing a frequency-explicit method. This method was developed for
cancer research and, in our case, accounts for the mosaic of mutated
and non-mutated stem cells in shoot apical meristems. Given that
most somatic mutations have a low allele frequency (1/2N stem
cells) during growth
13, most somatic mutations are expected to
remain at frequencies too low to be unambiguously detected. Thus,
while this work provides clear evidence that somatic mutations exist
in trees, it still remains particularly challenging to determine the
actual rate of somatic mutations. Consequently, we consider that
the number of somatic mutations identified in the studied
geno-type reported here is only the tip of the iceberg of the total number
of somatic mutations. A previous study
12formulated an interesting
working hypothesis whereby stem cell mutagenesis protects shoot
apical meristems against ultraviolet damage. This hypothesis was
based on the discrepancy between theoretical expectations and the
low number of empirically identified somatic mutations. However,
considering the detection bias for low allele frequency variants, the
hypothesis remains unsupported even with the best genomic data
available to date. We then investigated the transmission of
muta-tions to the offspring by evaluating a subset of 19 somatic mutamuta-tions
(Supplementary Table 6) in 116 acorns collected from the
extremi-ties of lateral branches (Fig.
2b
). Despite the limited number of
seeds collected, we recovered 47% (9/19) of the somatic mutations
in the embryonic tissues of the acorns, confirming intergenerational
transmission (Fig.
2b
). Our work demonstrates that somatic
muta-tions exist in oak and are passed onto the next generation. However,
our results do not allow conclusions to be drawn on the
contribu-tion of somatic mutacontribu-tions to the high genetic diversity level and
large-scale evolution of oaks.
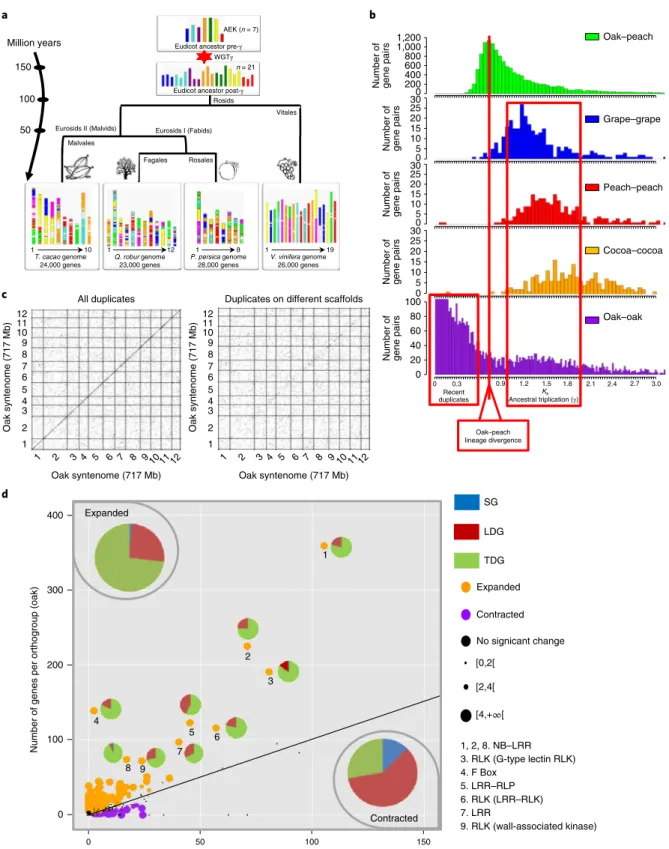
We searched for genomic features specific to oak that might
con-tribute to its longevity by first reconstructing its paleohistory within
the rosid clade. We compared the ancestral eudicot karyotype
(AEK
14) reconstructed from a comparison of the Vitales (grape
15),
Rosales (peach
16) and Malvales (cocoa
17) major subfamilies to reveal
that oak experienced 5 fissions and 14 fusions from 21 AEK
18chro-mosomes to reach the modern 12 chrochro-mosomes (Fig.
3a
). The
syn-onymous substitution rate (Ks) of paralogues (Fig.
3b
) indicated that
oak did not experience lineage-specific whole-genome duplication
in addition to the ancestral triplication shared among the eudicots
(γ
19). We also found that oak experienced a recent burst of local gene
duplications (accounting for 35.6% of the oak gene repertoire) after
the oak–peach lineage diverged (Fig.
3b
). The eucalyptus genome
is the only other plant genome shown to date to display such high
levels of tandem duplication
20(34%), contrasting strongly with the
other four genomes investigated (< 25% tandem duplicates). We
next validated that recent tandemly duplicated genes (TDGs) were
true duplicates rather than different alleles or duplication artefacts
generated during haplome construction (that is, during the
scaffold-ing or mergscaffold-ing steps of our hierarchical assembly pipeline). To this
end, we applied two verification procedures based on a comparison
of polymorphisms of allelic gene pairs (Supplementary Fig. 22) and
a sequence coverage analysis (Supplementary Fig. 23).
A comparison of gene families (36,844 orthogroups, including
435,095 genes from 16 plant species (Supplementary Table 7))
pro-vided further clues to the functional significance of tandem
duplica-tions. Of the 524 orthogroups found to have undergone expansion in
oak relative to the other 15 species (Supplementary Data Set 3), 73%
of the genes of concerned were tandem duplicates (Supplementary
Data Set 4). Such a tight relationship between TDGs and
lineage-specific selection is not a novel observation
21, and it seems to be
particularly common for disease-resistance (R) genes
22. However,
the higher frequency of such relationships in long-lived plants,
such as oak and eucalyptus, suggests that there may be a convergent
mechanism in trees towards an expansion of these families of genes
in long-lived species.
The orthogroups expanded in oaks are clearly enriched in Gene
Ontology (GO) terms relating to biotic interactions. They included
95% of the 1,091 nucleotide-binding site leucine-rich repeat (NB–
LRR)-related protein genes and 55% of the 1,247 receptor-like
kinase (RLK)-encoding genes (Supplementary Data Sets 5 and 6,
Supplementary Table 8, Supplementary Notes 3.5.6 and 3.5.7). We
detected a particularly strong expansion of two major clades of toll
interleukin receptor (TIR)–NB–LRRs in orthogroup 1 (shaded
areas in Fig.
4a
and Supplementary Fig. 6). In addition, three of
the nine orthogroups displaying the strongest expansions (Fig.
3d
,
Supplementary Data Set 3) corresponded to intracellular receptors
(NB–LRRs for orthogroups 1, 2 and 8) and four corresponded to
cell surface receptors of the innate immune response (RLKs for
orthogroups 3, 6 and 9, and LRR–receptor-like protein (RLP) for
orthogroup 5). The entire complement of NB–LRR and RLK genes
accounted for 9% of all oak genes, a proportion that is approximately
twice that reported for other plants
23,24. Moreover, 75% and 65% of
the NB–LRR and RLK expansions, respectively, can be accounted
for by tandem duplications. The distribution of the LRR–RLK genes
between the established subgroups based on an analysis of 31
angio-sperms
25also revealed remarkable expansions, with subgroup XIIa
(shown as orthogroup 6 in Fig.
3d
) and subgroup XIIb harbouring
the highest global expansion rates in oak. That is, 102 copies for
subgroup XIIa and 50 copies for subgroup XIIb, corresponding to
an expansion rate of 11.3-fold and 12.5-fold, respectively. Subgroup
XIIa (containing, for example, flagellin-sensitive 2 (FLS2), EF-TU
receptor (EFR) and Xa21) and subgroup XIIb (containing
Xoo-induced kinase 1 (XIK1), for example) included receptors known to
play a role in the response to bacterial infections
26. The orthogroups
expanded in oaks also presented a significantly (P < 2 × 10
−16) higher
π
0/π 4 ratio than contracted or stable orthogroups (SupplementaryTable 9). Moreover, the efficacy of purifying selection was
remark-ably low for the NB–LRR and RLK gene families, with mean π
0/π 4ratios of 0.68 and 0.58, respectively (Supplementary Note 4.1).
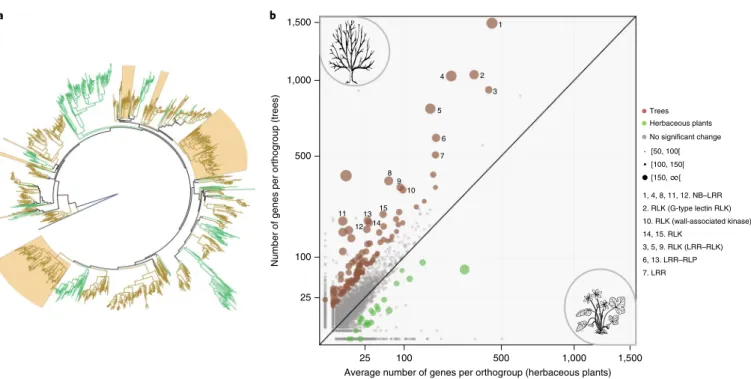
The enrichment of gene families relating to receptor-mediated
signalling in oak led us to investigate whether similar enrichment
had occurred in other trees. To this end, we compared trees and
herbaceous species among the 16 plant genomes investigated. In
eudicots, each distinct tree lineage provides an independent
evolu-tionary experiment for investigating the genomic features relating
to the tree lifestyle
27. We found that 126 of the 36,844 orthogroups
had undergone tree-specific expansion (Fig.
4b
, Supplementary
Data Set 7). These orthogroups were enriched in 61 GO terms,
Q. robur genome
23,000 genes P. persica genome28,000 genes V. vinifera genome26,000 genes
T. cacao genome 24,000 genes Eurosids I (Fabids) Eurosids II (Malvids) Rosales Fagales 1 10 1 12 1 8 1 19 Vitales Malvales Rosids Eudicot ancestor post-γ
Eudicot ancestor pre-γ WGTγ AEK (n = 7) n = 21 150 100 50 Million years a c d b
Duplicates on different scaffolds All duplicates Oak syntenome (717 Mb) 1 2 3 4 5 6 7 8 9 10 11 12 Oak syntenome (717 Mb)
Number of gene pairs Number of gene pairs Number of gene pairs Number of gene pairs Number of gene pairs
[0,2[ [2,4[ [4,+∞[ Expanded Contracted No signicant change 1, 2, 8. NB–LRR 3. RLK (G-type lectin RLK) 4. F Box 5. LRR–RLP 6. RLK (LRR–RLK) 7. LRR 9. RLK (wall-associated kinase) SG TDG LDG 1 2 3 4 5 6 7 8 9 150 100 50 0 0 100 200 300 400
Average number of genes per orthogroup (eudicots)
Number of genes per orthogroup (oak
) Expanded Contracted Oak–peach Grape–grape Peach–peach Cocoa–cocoa Ancestral triplication (γ) Recent duplicates Ks Oak–peach lineage divergence 3.0 0 0.3 0.9 1.2 1.5 1.8 2.1 2.4 2.7 0 20 40 60 80 1000 5 10 15 20 25 5 10 15 20 25 30 0 30 5 10 15 20 25 30 0 0 200 400 600 800 1,000 1,200 Oak–oak 1 2 3 4 5 6 7 8 9 10 11 12 Oak syntenome (717 Mb) 1 2 3 4 5 6 7 8 9 10 11 12 Oak syntenome (717 Mb) 1 2 3 4 5 6 7 8 9 10 11 12
Fig. 3 | Evolutionary history of the oak genome. a, Evolutionary scenario of oak from the AEK of 21 (post-γ ) and 7 (pre-γ ) protochromosomes
reconstructed from a comparison of the Vitales (grape), Rosales (peach) and Malvales (cocoa) major subfamilies. The modern genomes (bottom) are illustrated with different colours reflecting the seven ancestral chromosomes of AEK origin (top). WGT (red star) refers to the whole-genome triplication (γ ) shared among the eudicots. b, Ks distribution of gene pairs for oak–peach orthologues as well as the shared γ triplication in grape, peach, cocoa and
oak. Ks distribution of all gene pairs in oak illuminate gene pairs from the γ triplication as well as recent duplicates. c, Dot plot representation of the oak
genome against itself for the complete set of paralogous pairs (left) and without TDGs (right) representing the disappearance of the diagonal (TDGs) when low Ks values are removed. d, Expansion (524 orthogroups) and contraction (72 orthogroups) in oak relative to 15 other eudicot species. The pie
charts reflect the contribution of TDGs, LDGs and singleton genes (SGs) to the significantly expanded and contracted orthogroups and to outstanding outliers (labelled 1–9). Numbers in square brackets associated with circle sizes stand for -log(P-value), computed from the oak branch-specific P-value provided by CAFE.
largely (63%) related to plant immunity (Supplementary Data Set 8,
Supplementary Fig. 7). Ten of the 15 gene families displaying
strik-ing expansion in tree genomes (Fig.
4b
) corresponded to NB–LRRs
(orthogroups 1, 4, 8, 11 and 12), LRR–RLKs (orthogroups 3
(sub-group XIIb), 5 (sub(sub-group XIIa) and 9) or LRR–RLPs (ortho(sub-groups
6 and 13). A phylogenetic analysis of the orthogroup most strongly
expanded in trees (orthogroup 1 in Figs.
3
d and
4b
) clearly
high-lighted the expansion of TIR–NB–LRRs in woody perennials
rela-tive to herbaceous species (Fig.
4a
, Supplementary Fig. 6). Several
TIR–NB–LRR genes from this cluster are involved in the
percep-tion of bacterial or oomycete pathogens in Arabidopsis (for
exam-ple, Rps4 or Rpp5
28,29). We also investigated the adaptive value of R
genes within expanded orthogroups, making use of a recent
meta-analysis of these membrane-bound receptor genes in 31 angiosperm
genomes
25. We isolated 24 groups of oak lineage-specific expanded
LRR–RLK paralogues and explored footprints of positive selection
(Supplementary Data Set 9) based on the divergence between
paral-ogous copies. In total, 19 groups (80%) had a significant signature
of positive selection, with similar proportions reported for only two
other tree species (Malus, 73% and Populus, 87%). We identified 260
sites subject to positive selection after the manual curation of
pro-tein sequence alignments in oak. More than 78% of these sites were
located in LRR domains. As reported in a previous study
25,
posi-tive selection mostly targeted four amino acids of the hypervariable
region of the characteristic LXXLXLXX β -sheet/β -turn structure of
LRRs (Supplementary Fig. 8), which has been implicated in
pro-tein–protein interactions
30. The high proportion of sites under
positive selection in this domain therefore confirms the amino acid
sequence diversification of these genes through fixation of amino
acid changes.
In an opinion article
31, it was suggested that the following three
non-exclusive mechanisms could allow plants “to grow old
with-out antibodies”: numerous and highly diversified defence genes;
favoured expansion of R gene families; and accumulation of
somatic mutations, which can be transmitted to the next
genera-tion. Our study tackles all three genomic features that may
con-tribute to the success of long-lived trees and finds support for all
three suggested mechanisms.
In conclusion, we sequenced the oak genome and revealed its
considerable genetic diversity, to which heritable somatic mutations
may contribute. This work poses new research questions about the
contribution of this mutational load in adaptation, in particular
with regard to defences against new pests and pathogens. We also
showed that the genome of this iconic tree went through a single
paleohexaploidization event (γ , shared among the eudicots),
fol-lowed by a massive burst of recent local gene duplication. These
duplications have amplified families of genes involved in defence
against pathogens. We observed a parallel expansion of R
gene-related gene families across multiple tree species, suggesting that the
immune system makes an essential contribution to the survival of
long-lived plants over several centuries. The remarkable relaxation
of purifying selection observed in oaks may facilitate the
evolu-tion of a richer and more diverse set of R genes, thereby
confer-ring an advantage on these trees in their continuous arms race with
pathogens
32. This dynamic is likely to apply particularly to oaks,
with their remarkably long lifespan. However, the maintenance of
such a diversity of R genes may be costly, and future studies should
look at how trees control the expression of these immune receptors,
through microRNA control, for example
22.
Methods
Tree material. Pedunculate oak (Q. robur L., 2n = 2× = 24) is an outcrossing, highly heterozygous diploid species. Flow cytometry analysis has shown that this species has a genome of 740 Mb per C33, where the C-value is the amount, in picograms, of DNA contained within a haploid nucleus. The “3P” accession selected for establishment of the reference genome sequence for pedunculate oak is a tree of ~100 years of age located at the INRA Pierroton forestry research station (Aquitaine, France; 44 °44′ N, 00 °46′ W). This tree has already been characterized at the genetic34,35 and genomic36,37 levels. The tree (used as a female parent) has also
[50, 100[ [100, 150[ [150, ∞[ Trees Herbaceous plants No significant change
Number of genes per orthogroup (trees)
Average number of genes per orthogroup (herbaceous plants) 1 13 12 11 10 9 8 7 6 5 4 3 2 14 15 1, 4, 8, 11, 12. NB–LRR 2. RLK (G-type lectin RLK) 10. RLK (wall-associated kinase) 14, 15. RLK 3, 5, 9. RLK (LRR–RLK) 6, 13. LRR–RLP 7. LRR 1,500 a b 1,500 1,000 1,000 500 500 100 100 25 25
Fig. 4 | Expanded gene families in trees. a, Phylogeny of orthogroup 1 from Figs. 3d and 4b, established from the nucleotide-binding domains of 1,641
NB–LRR genes. Branches for trees and herbaceous species are shown in brown and green, respectively. Branches expanded in oak are shaded. For a higher resolution image see Supplementary Fig. 6. b, Scatter plot showing orthogroups expanded in trees and herbaceous plants (images from http://openclipart. org). Numbers in square brackets associated with circle sizes stand for -log(P-adjust), where P-adjust is the P-value of the binomial test adjusted for multiple testing.
been crossed with accession A4 (used as a male parent) to generate a full-sibling progeny for studies of the genetic architecture of quantitative traits38–47. A graft copy of 3P was placed in darkness in July 2009, to trigger the release of as much starch as possible from second-flush leaves, in an in-house procedure that has been shown to improve the quality of DNA extraction from oak leaves. We harvested 140 g of etiolated leaves and stored them at − 80 °C before DNA extraction.
DNA sample preparation for reference genome sequencing. An Invisorb Spin Plant Mini Kit (Stratec Molecular) was used to isolate genomic DNA and prepare short-read libraries for the Roche-454 and Illumina sequencing platforms. DNA concentrations were determined using a Quant-iT dsDNA Assay Kit (Life Technologies) and a Qubit Fluorometer (Invitrogen). We checked the integrity of the genomic DNA by agarose gel electrophoresis and pulsed-field gel electrophoresis. Agarose-embedded high-molecular weight (HMW) DNA was prepared as described previously48, and modified as described previously49, to construct Illumina TruSeq Synthetic Long Read (TSLR) libraries. Agarose gel plugs were washed three times in Tris EDTA buffer and subjected to digestion with 8 U of β -agarase (New England Biolabs) for 12–16 h at 42 °C. HMW DNA was then drop-dialysed for 2.5 h. DNA concentrations were quantified with the Quant-iT dsDNA Assay Kit. DNA quality was then checked using an Argus Qcard Kit (OpGen) and was estimated at 20–100 kb.
Sequencing. We prepared 454 single-end read libraries according to the standard procedure provided by Roche, with RL adaptors (GS FLX Titanium Rapid Library Preparation Kit; Roche Diagnostic). The libraries were sequenced with titanium chemistry on a 1/2 Pico Titer Plate on a 454 GS FlX instrument (Roche Diagnostic).
Illumina overlapping and tightly sized paired-end libraries were prepared using a semi-automated protocol. Briefly, genomic DNA (250 ng) was sheared using a Covaris E210 instrument (Covaris) to generate fragments of 150–400 bp or 200–800 bp in size for the overlapping and tightly sized libraries, respectively. End repair, A-tailing and ligation with Illumina-compatible adaptors (Bioo Scientific) were performed using a SPRIWorks Library Preparation System and a SPRI-TE instrument (Beckmann Coulter) according to the manufacturer’s protocol. We selected fragments of 200–400 bp or 300–600 bp in size for the overlapping and tightly sized libraries, respectively. DNA fragments were then amplified by 12 cycles of PCR with Pfx Platinum Taq polymerase (ThermoFisher) and Illumina adapter-specific primers. We selected amplified library fragments of ~300 bp in size by electrophoresis in a 3% agarose gel for the overlapping libraries. For tightly sized libraries, fragments of ~600 bp in size were selected by electrophoresis in a 2% agarose gel.
The 3-kb mate–pair library was prepared according to the initial Illumina protocol (Illumina Mate Pair Library Kit), with ~10 µ g of genomic DNA subjected to Covaris fragmentation in the first step. The other mate–pair libraries were prepared using a Nextera Mate Pair Sample Preparation Kit (Illumina). Briefly, genomic DNA (4 µ g) was simultaneously fragmented by enzymatic treatment and tagged with a biotinylated adaptor. The resulting fragmented and tagged (tagmented) DNA was subjected to size selection (3–5, 5–8 and 8–11 kb) by regular gel electrophoresis, and circularized by overnight incubation with a ligase. Linear, non-circularized fragments were digested and circularized DNA was fragmented to generate fragments of 300–1,000 bp in size with the Covaris E210 system. Biotinylated DNA was immobilized on streptavidin beads, end-repaired, then 3′ -adenylated, and Illumina adapters were added. DNA fragments were amplified by PCR with Illumina adapter-specific primers and purified.
All Illumina library traces were evaluated using an Agilent 2100 Bioanalyzer (Agilent Technologies) and quantified by quantitative PCR using a KAPA Library Quantification Kit (KapaBiosystems) on a MxPro instrument (Agilent Technologies). Libraries were then sequenced as described in Supplementary Table 1.
Finally, 39,092 BACs (corresponding to a physical coverage of 3.5× , Supplementary Note 2.1) were end-sequenced with dye terminator chemistry using an ABI 3730 sequencer (Applied Biosystems) as described previously50. The sequences can be obtained from GenBank (accession numbers HN154083– HN174138, JS673272–JS676292, JS676293–JS684825 and FO926004–FO981373).
We prepared 14 libraries (Supplementary Table 1) from 5 different extracted HMW DNA samples with TSLR technology (previously known as Moleculo) according to the Illumina protocol. Briefly, genomic DNA (500 ng) was sheared into fragments of approximately 10 kb in size with g-Tube (Covaris). The fragments were subjected to end repair, A-tailing and adaptor ligation, and the ligated products were size-selected by gel electrophoresis to obtained fragments of 8–10 kb in size, which were quantified by qPCR. The long-insert library was then diluted such that each well of a 384-well plate contained 3 fg of the library. The diluted products were subjected to long-range PCR, tagmentation and barcoding with 384 different barcoding PCR primers. The 384 barcoded libraries were pooled, purified and subjected to size selection. Each library was sequenced by 100 or 150 base-length read chemistry instrument (Illumina).
Sequence processing. Raw Roche/454 reads were used for subsequent analyses without processing. Illumina paired-end and mate–pair reads were cleaned in the following three-step procedure: sequencing adapters and low-quality nucleotides
(quality value < 20) were removed; sequences between the second unknown nucleotide (N) and the end of the read were removed; and reads shorter than 30 nucleotides after trimming were discarded, together with reads and their mates mapping onto run quality control sequences (PhiX genome). The TSLRs were generated using the BaseSpace workflow. The primary sequencing data were then uploaded without modification to the BaseSpace cloud and processed using the standard Illumina workflow to generate long synthetic reads.
Genome size estimation by k-mer analysis. Before assembly, we analysed the k-mer distribution of Illumina 100-bp paired-end reads (two lanes representing 95-fold coverage of the haploid genome) to obtain an independent estimate of the haploid size of the oak genome. The 31-mer distribution was generated using Jellyfish51 (with the following parameters: -m 31 -s 2048M -C) and was uploaded to the GenomeScope website (http://qb.cshl.edu/genomescope/). We obtained an estimated haploid genome size of 736 Mb (Supplementary Fig. 25), a value close to the 740 Mb estimated by flow cytometry33.
Genome assembly. We first assembled the longest reads together (obtained from 454 and Moleculo libraries) to maximize the separation of the two haplotypes of accession 3P and to overcome the high level of heterozygosity. We used Newbler and Celera52 as the overlap-layout-consensus (OLC) assemblers. We used Newbler software (version MapAsmResearch-04/19/2010-patch-08/17/2010) with default parameters, with the addition of the -large and -sio options. As Newbler does not accept reads longer than 2 kb, we split Moleculo reads into overlapping 1,999-bp fragments (with overlaps of 1,499 bp) and retained the origin of each fragment for further analysis (see next section). We obtained an assembly (named A1 in Supplementary Table 10) of 300,113 contigs with an N50 of 9.3 kb and a cumulative size of 1.31 Gb, corresponding roughly to the size of the two haplotypes. We ran Celera with the following parameters: unitigger= bogart; merSize= 31; merThreshold= auto*2; ovlMinLen= 800; obtErrorRate= 0.03; obtErrorLimit= 4.5; ovlErrorRate= 0.03; utgErrorRate= 0.015; utgGraphErrorRate= 0.015; utgGraphErrorLimit= 0; utgMergeErrorRate= 0.03; batThreads= 20; utgMergeErrorLimit= 0. This process produced an assembly (named C1 in Supplementary Table 11) composed of 29,255 contigs with an N50 of 9.5 kb and a cumulative size of 1.31 Gb. The Celera assembler allows the direct input of raw Moleculo reads and we performed the scaffolding (that is, ordering and orienting of contigs) step directly on the Celera contigs of the C1 assembly.
Use of long reads to simplify the contig graph. Once the initial Newbler assembly was obtained, we used long-range information from Moleculo reads to simplify the contig graph. The Newbler output file “454ContigGraph.txt” describes the contig graph, in which the nodes are contigs and the edges are links between two contigs spanned by a read. Contigs were generally fragmented due to the presence of repeat or heterozygous regions. We extracted links between the contigs created from different parts of single long reads. Finally, a file containing all the links was generated (in DE format) and used as input for the string graph assembler (SGA) scaffolding module53. We obtained an assembly (named A2 in Supplementary Table 10) composed of 198,695 contigs with a N50 of 16.2 kb and a cumulative size of 1.33 Gb.
Scaffolding step. We used Illumina paired-end and mate–pair libraries to organize contigs and to produce scaffolds. We ran three iterations of the SSPACE scaffolder54 with the parameters -k 5 and -a 0.7, using the following libraries, ranked by increasing fragment size: 400-bp paired-end, 3-kb mate–pairs, 5-kb mate–pairs and 8-kb mate–pairs. We then ran SSPACE again, with -k 2 and -a 0.7, using the Sanger BAC-ends and the previously scaffolded assembly. Sanger reads were transformed into Illumina-like reads by selecting the 100-bp window with the highest quality according to Sickle software55. We obtained two assemblies (A3 and C2 in Supplementary Tables 10 and 11, respectively). The most contiguous of these assemblies (A3) consisted of 9,025 scaffolds with an N50 of 818 kb and a cumulative size of 1.45 Gb (including 11.19% ambiguous bases).
Choice of the final assembly. The choice of the final assembly was based on the metrics of the two assemblies obtained with Celera and Newbler (assemblies C2 and A3) and comparisons with high-quality BACs (see Supplementary Note 2.1.3 and examples in Supplementary Fig. 9). We chose the Newbler assembly because it better discriminated between the two haplotypes.
Gap filling. The scaffold gaps of the A3 assembly were closed with GapCloser software56 and Illumina paired-end reads. As input, we used 95× coverage (of the haploid genome) of overlapping paired-end reads and 95× coverage (of the haploid genome) of a standard paired-end library (400–600-bp fragments). We obtained an assembly (named A4 in Supplementary Table 10) consisting of 9,025 scaffolds with an N50 of 821 kb and a cumulative size of 1.46 Gb (including 4.63% ambiguous bases).
Bacterial decontamination. SNAP gene finder57 was applied to the entire assembly
for draft gene prediction. We used an optimized calibration of SNAP based on the genewise alignment of P. persica coding sequences with the oak genome assembly.
Predicted genes were then aligned against the NCBI NR database with BLAST-p. We kept the best match for each predicted protein and used the corresponding taxon. The 198 scaffolds containing > 50% bacterial genes for the assigned proteins were considered to be putative contaminants and were removed from the assembly file (assembly A5 in Supplementary Table 10).
Single-haplotype assembly. We used the Haplomerger v.1 pipeline58 to
reconstruct allelic relationships in the released polymorphic diploid assembly and to reconstruct a reference haploid assembly. The diploid genome was first soft-masked with the following programs: TRF59 to mask tandem repeats; RepeatMasker60 to mask simple repeats, low-complexity and Viridiplantae-specific TEs; DUST61 to mask low-complexity sequences; and RepeatScout62 to mask unknown TEs. We then inferred a scoring matrix specific to the oak genome sequence, using 5% of the diploid assembly. The haploid genome was obtained from the soft-masked assembly and the specific scoring matrix with Haplomerger. We used the “selectLongHaplotype= 1” parameter to maximize gene content as recommended in the Haplomerger documentation, as we knew this would generate frequent switches between haplotypes (Supplementary Fig. 11). We also prevented Haplomerger from creating false joins between scaffolds by using external information. We used the genetic linkage map (see Supplementary Note 2.3) and prevented Haplomerger from joining scaffolds from different linkage groups by modifying the “hm.new_scaffolds” file. We obtained an assembly (named H1, Supplementary Table 2) composed of 1,409 scaffolds with an N50 of 1,343 kb and a cumulative size of 814 Mb (including 2.94% ambiguous bases). We halved the size of the assembly, while retaining a completeness of gene content (evaluated with BUSCO63, similar to that of the diploid assembly, see Supplementary Table 2). The haploid scaffolds were aligned with BACs for visual inspection to determine the correctness of this final release (Supplementary Figs. 11, 12 and 13). A comparison with an existing heterozygous plant genome shows that our assembly ranks among the best for a series of metrics (number of contigs and scaffolds, scaffold N50 size; Supplementary Table 3). As introduced in Supplementary Note 2.3, a chromosome-scale genome was finally established using a high-density linkage map based on SNP markers8. We assessed the linear association between the genetic and physical positions of the SNPs using Spearman rank correlation.
Detection and annotation of transposable element. The REPET pipeline (http:// urgi.versailles.inra.fr/Tools/REPET) was used for the detection, classification (TEdenovo64,65) and annotation (TEannot66) of TEs. The TEdenovo pipeline detects TE copies, groups them into families and defines the consensus sequence for each family containing at least five copies. The TEannot pipeline then annotates TEs using the library of consensus sequences.
The TEdenovo pipeline was used to search for repeats in contigs longer than 29,034 bp (50% of the genome) from the first diploid version (V1) of the Q.
robur reference genome sequence50. The first step used Blaster with the following
parameters: [identity > 90%, HSP (high-scoring segment pairs) length > 100 bp and < 20 kb, e-value ≤ 1e-300]. The HSPs detected were clustered using Piler67, Grouper66 and Recon68. Multiple alignments (with MAP69) of the 20 longest members of each cluster (n clusters) containing at least 5 members were used to derive a consensus. Consensus sequences were then classified on the basis of their structure and similarities relative to Repbase Update (v.17.11)70 and PFAM domain library v.26.071, before the removal of redundancy (with Blaster + Matcher as in the TEdenovo pipeline). Consensus sequences with no known structure or similarity were classified as ‘unknown’.
The library of 4,552 classified consensus sequences provided by the TEdenovo pipeline was used to annotate TE copies throughout the genome with the TEannot pipeline. Three methods were used for annotation (Blaster, Censor and RepeatMasker). The resulting HSPs were filtered and combined. Three methods (TRF, Mreps and RepeatMasker) were also used to annotate simple sequence repeats (SSRs). TE annotation covered only by SSRs were then removed. Finally a “long join procedure”72 was used to address the problem of nested TEs. This procedure finds and connects fragments of TEs interrupted by other more recently inserted TEs to build a TE copy. The nesting patterns of such insertions must respect the following three constraints: fragments must be collinear (both in the genome and with the same reference TE consensus sequence); of the same age; and separated by a more recent TE insertion. The percentage identity to the reference consensus sequence was used to estimate the age of the copy. Using the results of this first TEannot pipeline, we filtered out 2,047 consensus sequences that did not have a full-length copy in the genome. A copy may be built from one or more fragments joined by the TEannot long join procedure. We then performed manual curation to improve the TE annotation. We removed TE copies with consensus sequences identified as part of the host gene. These consensus sequences were built from a family of repeats containing at least five members and were classified as unknown by the TEdenovo pipeline. They were predicted to be host genes from multigene families. We also filtered out consensus sequences identified as chimeric. We obtained a final library of 1,750 consensus sequences, which together captured 52% of the oak genome, a value in the upper range of the values previously reported for plants.
Gene prediction and functional annotation of protein-encoding genes. We used EuGene v.4.073 to predict gene structure. EuGene predicts gene models from
a combination of several lines of in silico evidence (ab initio and similarity). The EuGene pipeline was trained on a set of 342 genomic and full-coding complementary DNA pairs for which coding sequences were confirmed by protein evidence. One-third of the dataset was used for training the following ab initio gene structure prediction software: Eugene_IMM74, which is based on probabilistic models for discriminating between coding and non-coding sequences; SpliceMachine75, which was used to predict coding sequence (CDS) start and intron splicing sites; and FGENESH, an ab initio gene finder (http://linux1. softberry.com/berry.phtml), which was used with Populus trichocarpa parameters. Another one-third of the dataset was used to optimize the EuGene parameters. The final one-third of the training dataset was used to calculate the accuracy of EuGene predictions. Sensitivity values of 85.8% and 75.2%, and specificity values of 87.7% and 74.6%, for exons and genes, respectively, were estimated.
We refined alignments with nucleotide similarity-based methods (Blat and Sim4) using transcript contigs from Q. robur and Quercus petraea76. We ensured that alignment quality was high by respecting the following criteria: 100% coverage and 98% identity for alignments with contigs shorter than 300 bp; < 98% coverage and 98% identity for alignments with contig lengths between 300 and 500 bp; < 95% coverage and an identity of 98% for alignments with contigs longer than 500 bp; and < 95% identity for all other cases. We also used BLAST-x 2.2.29+ to match protein sequences with sequences in protein databases, such as SwissProt, and databases built for species phylogenetically related to oak, such as P. persica v.1.39, Vitis vinifera v.1.45, P. trichocarpa v.2.10, Eucalyptus grandis v.2.01 and Arabidopsis thaliana v.1.67. We filtered out predicted genes overlapping TEs identified with the REPET package (see previous section), but retained TEs in introns and untranslated regions. The results of the various analyses were combined in EuGene to predict the final gene models. Predicted genes of < 100 nucleotides in length were automatically filtered out by EuGene.
We initially predicted 77,043 protein-coding genes from the diploid version (V2) of the Q. robur genome sequence. In total, 2,067 genes from different gene families were manually curated by experts (Supplementary Note 3.5). From the 77,043 predicted genes, 43,240 were entirely recovered in the haplome, including 1,176 of the manually curated genes. Genes were tagged as ‘unreliable’ if their coding sequences were < 500-bp long (corresponding to 166 amino acids), transcript coverage was < 90% or the genes were not curated manually. Based on these criteria, 13,575 genes were tagged as unreliable, and the remaining genes were tagged as ‘regular’ (28,484 genes) or ‘manual’ (1,176 genes).
We then performed a manual analysis of the 43,240 candidate gene models, guided first by an OrthoMCL run of the 16 genome sequences used in the evolutionary analysis (see the section “Oak karyotype evolution and genome organization”), in which we filtered out genes from OrthoMCL clusters associated with the following criteria: domains identified as plant mobile element domains (PMD domain) or TE domains (for example, transposases or GAG, a structural protein for virus-like particles within which reverse transcription takes place); and similarity to TE proteins, based on BLAST analyses against KEGG library results. We also checked that the OrthoMCL clusters contained > 90% Q. robur genes (that is, with only a minor contribution from other species) as follows: we filtered out ‘potential pseudogenes’ or small gene fragments predicted in regions of dubious assembly due to a high repeat content (that is, presence of TEs or repeated motifs in genes, such as NBS-LRR); we also filtered out unreliable and regular singletons (single genes not clustered with OrthoMCL) with a CDS < 500 bp. Some small genes were classified as regular, as they were sufficiently covered by mRNA contigs, but they could be mapped to multiple sites within the genome and could not therefore be considered specific for the gene tagged.
Automated functional annotation was performed on the 25,808 predicted proteins (listed in Supplementary Data Set 1), using an in-house pipeline (FunAnnotPipe), mostly largely on the InterProScan v.5.13–52.077 webservice for domain and motif searches. This included all the manually curated genes, 78% of the regular set and 17% of the unreliable set. Subcellular targeting signals and transmembrane domains were predicted with SignalP, TargetP and TMHMM78 and InterProScan. We also carried out similarity searches with BLAST-x V2.2.29+ against PDB, Swissprot and KEGG79, and rpsBLAST (14 June 2009) searches for conserved domains against the CDD database80 and KOG81. We also used the BLASTKoala webservice (http://www.kegg.jp/blastkoala/, January 2016) to associate KEGG orthology groups, and E2P2 to identify the associated enzyme codes when relevant (https://dpb.carnegiescience.edu/labs/rhee-lab/ software, v.3.0).
We assigned ‘definitions’ to the predicted proteins as proposed by Phytozome82 and D. M. Goodstein (personal communication). We used the annotation from the most accurate analysis as input: EC number (E2P2), KEGG orthology group (KO; KEGGKOALA), PANTHER (InterProScan), KOG (conserved domain database for eukaryotic organisms) and PFAM (InterProScan). We then calculated the multiplicity (M) of annotations across the entire genome, both as single (for example, KOG0157, PF0064 and PF0005) and same-type compound keys (for example, PF0064//PF0005). Mixed compound keys were not considered (for example, KOG0157//PF0064). Weighting (W) factors were applied to protein definitions to give priority to the most informative annotations as follows: EC = 1, KO = 1.1, PANTHER = 2, KOG = 3, PFAM = 4. The final protein definition corresponds to the least frequent description (minimum M × W value) from this
analysis. The key advantage of this approach is that it makes it possible to assign a protein definition without over-representing a single type of annotation found at multiple locations. As a result, a protein definition was assigned to 87% of the predicted oak proteins (Supplementary Data Set 1).
Estimation of heterozygosity of the reference genotype 3P. All the short Illumina paired-end reads used to produce the 3P oak reference genome were mapped against the haplome assembly with bowtie283, using standard parameters for the “fast end-to-end” mode. Duplicated mapped reads were removed with Picard (http://broadinstitute.github.io/picard/). SAMtools/bcftools84 were used to call variants. We then used a combination of custom-made scripts (available at http:// www.oakgenome.fr) to calculate coverage and estimated allele frequency from the “DP4” tag of the .vcf file. We discarded all SNPs with a minor allele frequency value < 0.25 and all insertions and deletions; the proportion of heterozygous sites on the chromosomes was then calculated with a sliding window approach. For each window, this proportion was weighted by the N% and the fraction covered, defined here as the proportion of bases within a window satisfying the same sequence depth criteria as used for SNP calling.
Pool-seq-based estimator of oak genetic diversity. Branches from 38 pedunculate oak trees were sampled in spring 2011 from oak stands within the maritime pine forest (Supplementary Table 17, Supplementary Fig. 53) of the Landes (Southwest France). Branches were harvested with a telescopic pole pruner and placed in darkness for 3 days to trigger the release of starch from chloroplasts. Etiolated leaves were then harvested and their DNA was extracted using a DNeasy Plant Mini Kit according to the manufacturer’s instructions (Qiagen). The amount of DNA was assessed using a NanoDrop ND-1000 spectrophotometer (NanoDrop Technologies Inc, Rockland, DE, USA) and DNA quality was assessed visually by electrophoresis in a 1.2% agarose gel. The 38 genotypes were genotyped with a 12-plex of expressed sequence tag SSRs and an 8-plex of genomic SSRs85. We estimated genetic relatedness between genotypes with COANCESTRY86, as described previously87, and the degree of introgression of sequences from sessile oak (Q. petreae) was assessed using STRUCTURE88, as described previously85. Following this analysis, we excluded three samples identified as possibly related and eight samples displaying a large degree of introgression from sessile oak. We then randomly selected 20 of the remaining 27 trees (Supplementary Table 18) for whole-genome sequencing by pool-sequencing (pool-seq) techniques89.
DNA from these 20 oaks was re-extracted from individual samples using an Invisorb Spin Plant Mini Kit (Stratec Molecular). We visually checked the DNA quality by gel electrophoresis (1.5% agarose) and estimated the concentration and purity using a NanoDrop 1000 spectrophotometer (NanoDrop Technologies). We then pooled DNA from individual samples to obtain an equimolar solution with a final concentration of 570 ng µ l–1. We used this pool of DNA to prepare a
paired-end genomic library with a Paired-End DNA Sample Preparation Kit (Illumina). This library was sequenced on 10 lanes of a HiSeq2000 sequencer (Illumina) (2× 100-bp paired-end reads), generating 1,732,899,595 paired-end reads (331 Gb, that is, ~400× haploid genome coverage).
Raw reads were trimmed to remove low-quality bases, as described in the “Sequence processing” section. All reads were then mapped against the oak haplome assembly with bowtie283, using standard parameters for the “sensitive end-to-end” mode. Potential PCR duplicates were removed using Picard (http://
broadinstitute.github.io/picard/). Samtools84 and PoPoolation290 were then used to
call SNPs with counts of at least 10 for the alternate allele and a depth between 50 and 1,000× at the position concerned. All SNPs with a minor allele frequency value < 0.05 were discarded. After subsampling the pileup at all retained positions to a uniform coverage of 30× (“subsample-pileup.pl”, PoPoolation suite91), we used the “variance-sliding.pl” script (PoPoolation91) to calculate π along chromosomes by a sliding window approach (1-Mb sliding windows, 250-kb steps, Supplementary Figs. 4 and 15).
Estimate of genetic diversity and π0/π4 ratio. We estimated genetic diversity as pairwise nucleotide diversity (π ) at zerofold and fourfold sites for each protein-coding gene, as described previously9. We then defined the π
0/π 4 ratio as the ratio
of mean π 0 to mean π 4 over all genes. We also computed these metrics on manually
curated genes, which showed that the gene model quality did not compromise our findings. We compared estimates between genes from expanded, contracted and unchanged gene families (orthogroups) in oak. We accounted for the different gene family sizes by randomly sampling 1,000 genes from each of these three categories and repeating the operation 100 times.
Detection of somatic mutations. Our objective was to show that somatic mutations (in terms of SNPs) exist in a long-lived plant and transmitted to the next generation. Because we did not intend to provide a comprehensive estimate of the number of somatic mutations in the studied 100-year-old tree, it is meaningless to compare our result to an expected number of somatic mutations because of the following unknown factors: the substitution rate per site and per generation; the number and pattern of mitotic divisions from zygote and axillary buds; and cell death and bud abortion rates.
We investigated somatic mutations by resampling the 3P genotype used to sequence and assemble the reference genome, as described below.
Vegetative buds were collected from the extremities of three second-order branches of the 2011 increment in February 2012: two lateral branches (L1 and L2) and the tree apex (L3). We used dendrochronology (tree-ring dating) to date the time of initiation of the L1 and L2 branches (Supplementary Fig. 5). To this end, we collected 5-mm diameter wood cores from the insertion point of the selected branches with an increment borer. We also dated the age of the tree by taking a core just above ground level and counting the number of rings under a microscope. We estimated that the L1 and L2 branches had been initiated 15 and 47 years earlier, respectively, and that the terminal branch was at least 85 years old.
DNA was extracted from three sets of vegetative buds sampled at location L1, L2 and L3 using the Invisorb Spin Plant Mini Kit (Stratec Molecular). For each sample, six independent DNA extractions were carried out on a pool of buds. DNA quality was checked by electrophoresis in a 1.5% agarose gel. DNA concentration and purity were assessed with a NanoDrop 1000 spectrophotometer (NanoDrop Technologies). Individual DNA samples from the same branch were the pooled in an equimolar solution to obtain a final concentration of 769–1,388 ng µ l–1. We
prepared tightly sized paired-end libraries (600 bp in size) as described in the “Sequencing” section and sequenced each of these libraries on one to four lanes of a HiSeq2000 or HiSeq2500 sequencer (Illumina) (Supplementary Table 19, 100-bp or 250-bp paired-end reads). We obtained 284-fold (L1), 250.5-fold (L2) and 264.9-fold (L3) haploid genome coverage for these samples. For each of the three branches (L1, L2 and L3), reads were mapped against the reference genome sequence with BWA-MEM92 using the default parameters, except for minimum seed length (k = 79). After sorting, PCR duplicates were removed with Picard (http://broadinstitute.github.io/picard/). We searched for somatic mutations using MuTect (a program developed for the detection of somatic point mutations in heterogeneous cancer samples11) to compare the three libraries (six pairwise combinations; Supplementary Table 20). This frequency-dependent detection approach was considered to be particularly well suited to identify somatic mutations in plants.
Because considering sequencing error (that is, false positives) is essential for detecting mutations and is vital for drawing valid conclusions, particularly with respect to the detection of somatic mutations within a single individual, we addressed this concern and took all possible actions to minimize it. Thus, the accuracy of somatic point mutations was ensured by considering only those sites with the following characteristics: a minimum depth of 50× in both the reference and potentially mutated libraries; no mutant (that is, alternative) allele in the reference library; and a minimum frequency of 20% for the mutant allele in the potentially mutated library (that is, each somatic mutation was supported by 10 alternative alleles or more). We then filtered out candidate somatic mutations by using a cross-validation procedure. Across all pairwise comparisons, we only kept somatic mutations with a temporal pattern coherent with the chronology of branch development (see Supplementary Table 20 for details). These multiple comparisons made it possible both to validate the detected mutations and to reconstruct their mutational history along the trunk or the two branches. Finally, we discarded 15 additional candidate mutations among the set of 61 reliable somatic mutations. Indeed, for this set of 15 somatic mutations, we recovered the same alternate allele in the pool of 20 pedunculate individuals (see the section “Pool-seq-based estimator of oak genetic diversity”) at a frequency > 0.005. Note that f(alt) < 0.005 remains a stringent criterion considering Illumina sequencing error calls (0.024). As a consequence, we cannot rule out that some true positives were excluded at this step. However, our objective was to be as conservative as possible in order to study the transmission of these somatic mutations to the next generation (Supplementary Table 5).
We studied the transmission of somatically acquired mutations to the offspring by extracting DNA using a DNAeasy 96-Plant Kit (Qiagen) from 116 acorns sampled from the extremities of the L1 and L2 branches (Fig. 2b). DNA was extracted after the dissection of embryonic tissues (radicle and plumule) from the acorn. We used 15 ng DNA to genotype the offspring using a MassArray iPLEX Assay (Agena Bioscience) according to the manufacturer’s instructions. Primers were designed, and 33 SNPs were multiplexed in the Assay Design Suite (Agena Bioscience). Allele calling was processed in Typer Viewer v.4.0.26.75 (Agena Bioscience). This 39-plex assay contained 12 control SNPs and 21 candidate somatic mutations (Supplementary Table 5). Control SNPs were used to provide an estimate of the selfing rate likely to impair interpretation of the segregation of somatic mutations in the offspring. The control SNPs were loci homozygous in the reference genotype 3P and found at a very low frequency in the pool of 20 pedunculate oaks; that is, with minimum allele frequencies ranging from 0.02 to 0.05. Embryos resulting from the self-pollination of 3P were expected to be homozygous for the reference allele, and most outcrossed embryos were expected to be heterozygous. We observed a mean heterozygosity of 0.54 over the 12 control loci. In the absence of selfing and based on allele frequencies estimated in the pool of 20 individuals, mean heterozygosity would have been close to 0.96, thus suggesting a relatively high rate of selfing (44%). Unamplified loci (2/21 SNPs; Supplementary Table 6) were excluded from the analysis. The overall rate of missing data was high (39% for missing somatic mutations and 54% for control