Application of Supply Chain Risk Management through Visualization and Value-at-Risk Quantification
By Diwei Xia
B.S. Mathematics, B.A. Economics, University of Chicago, 2006
-_---Fellow of the Society of Actuaries MASSACHUSETTS INSTItUTE OF TECHNOLOGY
And
01 41
1Kaiye Lu LIBRARIES
B.S. Management, Fudan University, 2009
Submitted to the Engineering Systems Division in Partial Fulfillment of the Requirements for the Degree of
Master of Engineering in Logistics at the
Massachusetts Institute of Technology June 2014
C2014 Diwei Xia and Kaiye Lu. All rights reserved.
The authors hereby grant to MIT permission to reproduce and to distribute publicly paper and electronic copies of this thesis document in whole or in part in any medium now
known or hereafter created. \
o
Signature of Authors ...
Signature redacted
Master of Engineering in Logistics Program, En neering Systems ivision
Signature redacted
Ma 9,2014Certified by ...
Dr. Bruce C. Arntzen Executive Director, Supply Chain Management Program Thesis Supervisor
AcepedbySignature
r'edacted
Accepted by ...
S i n t r
e
a t d
...
(
* Prof. Yossi SheffiProfessor, Engineering Systems Division Director, Center for Transportation and Logistics Professor, Civil and Environmental Engineering
Application of Supply Chain Risk Management through Visualization and Value-at-Risk Quantification By Diwei Xia And Kaiye Lu
Submitted to the Engineering Systems Division in Partial Fulfillment of the Requirements for the Degree of
Master of Engineering in Logistics at the
Massachusetts Institute of Technology ABSTRACT
Supply Chain Risk Management ("SCRM") is often discussed in business and academia but is still underdeveloped as a practical tool. Many studies have examined the effects of supply chain disruptions, and many studies have also produced tools for mitigating risk. However, there is still a need for an integrated, practical approach for SCRM that businesses can implement on an enterprise scale. Our thesis attempts to bridge this gap and produce a practical approach for corporations to deploy a SCRM strategy on an enterprise level. Through the use of supply chain visualization and catastrophe modeling software, we have developed a SCRM strategy for a large multi-national chemical company. Our SCRM framework focuses on four key steps: 1) defining the scope of supply chain disruptions; 2) mapping and visualizing the supply chain; 3) evaluating the probability of disruption; and 4) developing a strategy to create an economically resilient supply chain.
Thesis Supervisor: Dr. Bruce C. Arntzen
ACKNOWLEDGEMENTS
Thank you to my wife Casandra, my son Eliot, and the rest of my family for your inspiration and support. Thank you to the professors, staff, and students at MIT for your fellowship and ideas. Thank you to my SCM classmates of 2014 for your friendship and kindness.
- Diwei Xia
Thank you to my husband, Xiancheng Han, for always being with me however far away we are apart. Thank you to my parents, Huiping Guo and Yongchao Lu, for your unceasing love, encouragement and guidance. Thank you to the rest of my family and all my friends who shared my happiness and sorrow, and gave me support during my hard times. Thank you to the
professors, faculty members at CTL and all my SCM classmates for giving me a year full ofjoy and fulfillment.
- Kaiye Lu
We want to thank Dr. Bruce C. Arntzen, for coaching us in the past nine months and advising the thesis project. We also want to thank Dr. Leo Bonanni, Founder of Sourcemap, and Peter J. Civitenga, Senior Business Development Executive at AIR, for their extensive support over the course of our thesis research.
TABLE OF CONTENTS
A BSTRA CT ... 2
A CKN OW LED G EM EN TS ... 3
LIST O F FIGU RES ... 5
1. IN TRO D U CTION ... 6
2. LITERA TU RE REV IEW ... 8
3.M ETH OD O LO GY ... 13
3.1 Scope Identification ... 13
3.2 V isualization ... 13
3.3 V alue-at-Risk ... 18
3.4 Integrated Supply Chain Risk M anagem ent ... 26
4. D A TA AN A LY SIS & RESU LTS ... 28
4.1 V isualization ... 28
4.2 V alue-at-Risk ... 32
4.3 M itigating Raw M aterial Supply Risk ... 34
5. D ISCU SSION ... 36
5.1 Lim itations of the Research ... 41
5.2 Risk M itigation ... 36
5.3 Insights into a M ore Integrated and Autom ated Platform ... 39
6. CON CLU SION S ... 43
REFEREN CES ... 46
LIST OF FIGURES
Figure 1: D ata C ollection... 15
Figure 2: Loss Distribution with 1-year VaR 99%... 19
Figure 3: Earthquake Risk Heat Map (Source: U.S. Geological Survey)... 21
Figure 4: Exceedance Probability Curve ("EP Curve")... 24
Figure 5: Maps out the Pilot Supply Chain ... 29
Figure 6: Visualizes Nodes and Graphs Distribution of Risk Exposure... 29
Figure 7: Visualizes Nodes and Graphs Distribution of Recovery Time ... 30
Figure 8: Visualizes Nodes and Graphs Distribution of Revenue... 31
Figure 9: Displays Material Flows of Pilot Supply Chain... 31
Figure 10: Visualizes Nodes and Graphs Distribution of VaR... 32
Figure 11: Visualizes Related Vendors in a Cluster and Their VaR ... 33
Figure 12: Visualizes Nodes and Graphs Distribution of Disruption Probability ... 33
Figure 13: Displays Probabilities of Major Disasters at Certain Nodes... 34
Figure 14: Visualizes Nodes and Graphs Distribution of VaR After the Risk Mitigation... 35
LIST OF TABLES Table 1: Compares Effect of Risk Mitigation on Upstream Strategic Partners... 38
1. INTRODUCTION
Supply Chain Risk Management ("SCRM") is often discussed in business and academia. As a result of globalization, supply chains have become increasingly complex and vulnerable to disruption. For example, when Thailand experienced severe flooding in 2011, the crisis not only caused tremendous losses locally but also paralyzed the supply of automobiles, electronics, and other products in markets half a world away (Mullich, 2013). Catastrophes are unpredictable but the potential loss can be minimized if preventive measures are taken. Institutions often do not consider the risks within their supply chain until after disaster occurs. According to a 2013 World Economic Forum report, share prices are estimated to drop by 7% on average for companies that suffer a major supply chain disruption. To mitigate this risk, companies need a well-established strategy for supply chain resilience that incorporates a cross-functional risk management process, an integrated monitoring system, and close cooperation with upstream and downstream supply chain partners.
Many companies fail to mitigate supply chain disruptions effectively because they lack an integrated, practical approach for SCRM that can be implemented on an enterprise scale. There are a number of research studies that consider the effects of supply chain disruptions and suggest tools to mitigate those risks. Yet, most of this research is focused on tactical analysis, and the tools are very reactive in nature. Enterprise risk management is a developing area of research for academia and industry. Companies rarely have cross-functional teams dedicated to monitoring supply chain risks. Instead, functional departments within an organization usually have their own business continuity plans, very much limited to the department's own scope.
Generally, it is very difficult for senior management to see the full picture to make informed decisions.
Our thesis attempts to bridge the gap between isolated mitigation plans and a
comprehensive approach for corporations to deploy SCRM on an enterprise level. Through the use of supply chain visualization and catastrophe modeling software, we have developed a SCRM strategy for a pilot supply chain of a large multi-national chemical company. Our SCRM framework focuses on four key steps: 1) defining the scope of supply chain disruptions; 2) mapping and visualizing the supply chain; 3) evaluating the probability of disruption; and 4) developing a strategy to create an economically resilient supply chain. Our SCRM solution is developed on a web supply chain mapping platform that will interface with current enterprise resource planning ("ERP") systems so that the solution can be applied broadly across all of the company's product lines.
Nonetheless, our thesis research is just the first step in this field. We envision a more integrated tool that better interfaces with the commonly used ERP systems, corporate financial statements, shipping files and catastrophe modeling software, in a way to achieve a higher degree of automation. More training will have to be provided to the entire organization to strengthen the cooperative efforts. Furthermore, by extensively implementing the approach along the value
chain, we foresee a more vertically integrated supply chain and a shared platform for communication between suppliers and distributors.
2. LITERATURE REVIEW
SCRM is concerned with the vulnerability of critical components within a logistics system and the strategies to mitigate disruption risk. Many studies have contributed to research on the effects of SC disruption, including uncontrollable price increases, damaging effects to a company's reputation, and heavy financial losses. Research studies have also produced many tools for mitigating SC disruptions such as excess capacity options, vulnerability maps, dual sourcing, and multi-tier supplier planning. Our research focuses on developing an approach toward implementing SCRM at an enterprise level. Specifically, we will develop a methodology to help organizations identify risks, map and visualize the supply chain, evaluate the probability of disruption, and develop methods of risk mitigation. This review is based on the existing literature concerning these four components of our SCRM strategy.
Helping Organizations Identify Risks
It is important that organizations be prepared to respond to unexpected disasters that may seriously harm their ability to function. In March 2000, a fire in a Philips semiconductor plant disrupted production of integrated cellphone chips for Nokia and Ericsson. Nokia put the component on a "special watch" and immediately sought alternative suppliers elsewhere. Ericsson, however, failed to recognize the severity of the problem for weeks. By the time
Ericsson recognized the extent of the catastrophe, the company was unable to find a replacement supplier, and Ericsson suffered a $2.3 billion loss. Ericsson was forced to exit mobile phone manufacturing, and Sony purchased Ericsson's Mobile division soon afterwards (Sheffi, 2006). Furthermore, it does not take an enormous catastrophe to create heavy economic loss for a company or country. The loss of use of a U.S. port for as few as 12 days could cost the economy
roughly $59 billion (Datta and Palit, 2006). Events such as natural disasters, supplier problems,
organizational fraud, and regulatory reform are the major causes of a supply chain disruption. Organizations generally neglect disruption risk when operating conditions are normal, and it will often take a disaster for them to address risk management seriously. Many companies also fail to make proactive adjustments once they return to normal operations. As discussed by Levy (2007), organizations must avoid short-sightedness in their approach toward risk
evaluation. Instead, organizations must be encouraged to think about long-term sustainability, and our research attempts to simplify this approach by creating a straightforward visualization tool to help management understand the risks in their supply chain.
Mapping and Visualizing the Supply Chain
Visualization is a powerful tool for risk evaluation. People are naturally inclined to interpret visual data faster than textual information. A table of numbers may communicate the same information as a graph, but a person can recognize a trend much more quickly with a graph. Studies have shown that managers can understand a supply chain far more readily when it is overlaid with a map (Gardner, 2003). Different from a process map, a supply chain map is less detail-oriented and more designed for strategic purposes. A supply chain map incorporates the critical elements, including geography (e.g. spatial locations), assets (e.g. products, inventories), and connections (e.g. delivery methods, link to the database).
Early supply chain mapping studies done by Smith, Fannin, and Vlosky (2009) were more qualitative than quantitative. Using phone interviews and surveys, they clustered the suppliers and customers of one industry to analyze the commonality of their characteristics and behaviors within a region. In recent years, countless software vendors and consulting firms have attempted to create software solutions for supply chain mapping. Achilles, Amerigo, and
Llamasoft are just a few popular tools in circulation. Major operational consulting firms such as Accenture, Deloitte, and McKinsey have also developed proprietary solutions for supply chain mapping and risk assessment. However, most of these software tools examine risk through deterministic scenario testing, rather than a quantitative evaluation of disruption probability.
In our study, we used Sourcemap-a popular mapping tool created by Dr. Leo Bonanni at MIT-to draw a supply chain and overlay the picture with pertinent information, such as the relative risk of natural disasters in one region versus another. Our research adds to work that has been done in the past by overlaying a quantitative risk calculation on top of the qualitative information.
Evaluating Disruption Risk
Risk exposure and the probability of disruption are the two key factors for quantifying the value-at-risk of any node in a supply chain network. While organizations can easily calculate how much of their business is exposed to risk, they will not know the probability of any specific event occurring, which is critical to understanding the true value-at-risk. Schmitt and Singh (2009) describe methods of Monte-Carlo simulation that can stress test various nodes in a supply chain network. Their simulation methodology relies on historical disruption data and the
development of stress tests, and a key to calibrating a simulation model depends on the credibility of historical data. Hence, there is a need for reliable global supply chain disruption data.
Hopp and Yin (2006) formulated an optimization model to balance the cost of inventory and cost of disruption. Again, this model depends heavily on the reliability of disruption data to find the correct balance of cost and risk mitigation. Throughout our literature review, we found
many models for risk balancing or mitigation, but there was less detail in the calibration of the disruption probabilities. With our research study, we plan to address this deficiency.
Amendola, et. al. (2013) describes how probability models are increasingly being used to aid risk assessment and policy decisions. The insurance community has developed the most sophisticated catastrophe ("CAT") models in the world. Applied Insurance Research ("AIR") is the leading CAT modeling research firm. AIR tracks hurricane, storm surge, earthquake, winter storm, and wildfire frequency all over the world. They have built probability models for these events by combining location and property damage information to calculate a distribution of potential losses. This probability distribution is used to measure the amount of catastrophe risk to which each node in the network is susceptible. By combining their probability models and our visualization tool, we can build a powerful system for organizations to understand the risks in their supply chain and ultimately mitigate those risks.
Utilizing Risk Mitigation Tools
Knowing what disasters may affect a supply chain does not easily lead to what
preparations an institution must take. There are several tools for mitigating supply chain risk: dual sourcing, option contract, and higher inventories. Yet, implementation of these tools incurs an economic cost. These "insurance" costs need to be quantitatively evaluated to produce the most economically efficient method of risk management. Pochard (2000) has specifically used MATLAB to mathematically determine when a second supplier is most appropriate to use. Her models are mostly based on real options valuation to understand how to develop an agile supply chain. Wakolbinger and Cruz (2011) have conducted the research, both qualitatively and
quantitatively, on mitigation strategies of certain types of triggering events and their chain effects. Several other studies have developed frameworks for information sharing and risk
sharing between suppliers and buyers in order to lower the probability of operational risks. There are numerous ways to mitigate supply chain risk, and we do not need to add to the abundance of research that has already been done on this topic. From our perspective, the most important step an organization must make is to first identify and evaluate risks.
Closing Thoughts
While we have found a wealth of information on SCRM, we have yet to find a truly integrated approach on an enterprise level that consolidates all of this information toward a practical approach for SCRM implementation. We believe that our thesis can bridge this gap and add value for our thesis sponsor and other companies that are searching for a solution.
3. METHODOLOGY
Our methodology for supply chain risk management involves the visualization of a company's supply and the quantification of the value-at-risk ("VaR") at each node in the network. This approach solves two problems that companies face when evaluating the risks in their supply chain. The first is that companies will often be unfamiliar with how their supply chain is interconnected because of infrequent analysis and low visibility into their smaller suppliers. The second is that companies currently do not have a way of quantifying the amount of risk at each node in their network. Visualization and VaR quantification have distinct
methodologies that can be better understood separately, and in this section we will discuss each topic separately before finally integrating them in our holistic supply chain risk management strategy.
3.1 Scope Identification
Working with our sponsor company, we identified a major product line with a global supply chain to use as our pilot. After completing our research into the pilot, we then extended our methodology to two other product lines to demonstrate the scalability of our framework. We concentrated our risk selection to natural and man-made catastrophes ranging from hurricane, earthquake to terrorism, excluding general operating risks such as faulty equipment and accidents.
3.2 Visualization
Visualization of the supply chain is equally as important as the risk quantification. Studies have shown that the human brain interprets visual data more quickly than textual and
numeric information. When a supply chain is captured in a well-designed map or tree diagram, managers can quickly grasp the degree of complexity in their network as well as gain some general understanding of the risks inherent in its design. Since natural catastrophes are strongly related to geographic location, our method of overlaying supply chains networks on a map of the world is ideal in terms of communicating information quickly to management. In addition to that, a tree diagram is automatically generated from the map for management teams' easy review of the supply chain structure.
3.2.1 Data Collection
The first step in visualization is data collection and manipulation. In order to begin
mapping a supply chain network, we first need to choose a product line. Our thesis sponsor was a major multi-national chemical company with numerous divisions and product segmentations. We chose one pilot product line with an international supply chain, with the goal of designing an enterprise framework that will scale to any number of product lines.
In the following Figure 1, we have displayed our general data collection process. The vast majority of our data came from our sponsor company's enterprise resource planning ("ERP") system. Several functional departments such as corporate strategy, supply chain, and procurement teams delivered the necessary information for our research. Catastrophe statistics
came from our software vendor, Applied Insurance Research, who is further discussed in the Value-at-Risk quantification section of this methodology.
*
Figure 1: Data Collection
Collect Addresses for Each Node in the Network
In our first meeting with our sponsor, we stressed the need to obtain the manufacturing or distribution address of every point in the supply chain. In many corporations, this may be an unusual and difficult request because this information is not readily available. Enterprise
resource planning software will track receipts of orders and deliveries, but this information may only include supplier billing addresses. Since we are looking for natural catastrophe risk that would affect the supply chain, we need the actual location where the supplies are manufactured or stored. Our sponsor's purchasing organization supplied this data.
Request Bill of Materials and Inventory Data
After obtaining the node addresses, we then needed to understand how the supply flowed through the network. A bill of materials ("BOM") is the ideal source for this type of information. A BOM can be used to recreate the downstream flow of materials, from supplier through
manufacturing and distribution. This may be difficult if orders vary throughout a year. It may be important to aggregate information so that it reflects a full fiscal year or the full time horizon of the risk analysis. Once we had organized the BOM information to represent the flow of materials through the supply chain network, obtaining inventory data was the next natural step. At this point, we had already been in contact with the supply chain manager of our sponsor company.
The stock of inventory at each node was evaluated in terms of volume and number of days. After receiving all of this information, we calculated the percentage that each supplier contributes of a particular component. This information determined the relative importance of each supplier, which was used in the VaR calculation.
Gather Volume and Revenue Information
Next, we requested financial information on the annual volume and revenue of finished product. This information was used to determine the risk exposure and VaR of each node in the network. For our sponsor company, which markets thousands of chemical mixtures, there was some difficulty in distinguishing a final product and classifying revenue from product lines that are used as ingredients in other products. Clear definition of unique products may be an issue in many industries where a finished good is present in multiple stock keeping units ("SKU"). We included revenue from any SKUs that included our product line. Therefore, we included any revenue that would be affected by disruptions in our product's supply chain.
Obtain Recovery Time Information
Our final data request to our sponsor company was for recovery time information. Instead of working with the supply chain manager on this request, we needed to approach a procurement officer to understand how much time it would take to replace lost capacity if a supplier was suddenly removed from the network. We received guidance that we could assume that commoditized products would only take one to two weeks while specialized products would likely take a month to replace in an emergency. We reviewed the BOM and assumed that any materials that had more than one supplier were likely to only need 10 days to find a suitable replacement. Materials that were single-sourced would need 30 days to find a new supplier.
Recovery time was an important part of our risk exposure and VaR calculation, so additional attention was required to ascertain the quality of this assumption.
3.2.2 Mapping
By the start of our thesis project, we already had access to mapping software because our project was a small part of an ongoing Hi-Viz Supply Chain project led by our adviser, Dr. Bruce Arntzen, at the Massachusetts Institute of Technology's Center for Transportation and Logistics ("CTL"). The final stage of our visualization process required the actual mapping of the data we received from our sponsor company.
Sourcemap
Supply chain mapping and visualization has strong roots at MIT, where Dr. Leo Bonanni as a MIT doctoral candidate developed the supply chain visualization tool that was used in MIT CTL's Hi-Viz Supply Chain project. Dr. Leo Bonanni has since founded Sourcemap Inc., a company focused on delivering his tool for commercial and public use. Sourcemap was the tool at the center of our project. Its capabilities include the ability to upload vast volumes of location-based information and to overlay the information on a Google Earth display. Sourcemap
automates the creation of links and is capable of translating the information geographically or into a tree-based diagram. The tool also allows us to create node attributes that display
information such as inventory level, revenue, risk exposure, and VaR. Sourcemap can aggregate this information across nodes and graph a distribution of these metrics for the entire network.
Data Formatting and Automation
The final step to supply chain visualization was formatting and cleaning data for upload. For this step, we manually formatted data that we received from our sponsor to fit Sourcemap's
requirements. For enterprise purposes, a company would need to involve its information
technology department to automate a process for retrieving data from accounting, procurement, and enterprise resource databases. Automating data collection is vital for enterprise risk
management because it establishes protocols and makes risk management routine. When disruptions do occur, management can look back at the risk analysis and determine if their response was aided by their prior risk evaluation strategy. Feedback and iteration are important processes in the improvement of any skill, and making ERM a routine part of running a business will make that business more capable of handling future disruptions.
3.3 Value-at-Risk
VaR is defined as the threshold value such that probability of losses over the stated time horizon exceeding the threshold is no more than a predefined percentile. For example, if we
invest in a bond that has a 1-year VaR 99% threshold of $1 million, then over the course of one year, there is no more than a 1% probability that our losses will exceed $1 million. As shown in the following Figure 2, a VaR calculation requires the creation of a probabilistic loss distribution that uses two key assumptions: a risk exposure and a time horizon. For our thesis project, we defined our horizon to be one year and our risk classes to be all natural and man-made catastrophes.
Loss Distribution
1.00 0.80 - -0.40 / 0.20 - - - + .- --1-year VaR 99% 0.00 - -- _--0.0 0.2 0.4 0.6 0.8 1.0 1.2 1.4 Los ($ Millions)Figure 2: Loss Distribution with 1-year VaR 99%
VaR analysis has its roots in the financial services industry, where volatile movements in securities prices can affect company solvency. Over the past decade, VaR analysis has become a routine and vital part of any ERM framework in financial services. In the product and services industry, interest in ERM has grown dramatically, and we believe that the growth of VaR
analysis in other industries will mirror the financial services industry. In our project, VaR is used to simplify the way to calculate expected value of loss. Specifically it is equal to the product of risk exposure index and probability of disruption,
VaR = Risk Exposure Index * Pr(Disruption).
The purpose of VaR is to be an unbiased measure of risk, not particularly useful on a stand-alone basis, but more useful as a comparison tool across time or physical dimensions. It is generally the
change in VaR over time or the difference in VaR between two investments that gives management information on the company's risk exposure.
3.3.1 Hazard Selection
The first step in building our loss distribution was defining the risk classes. This key step determines what statistical information we will look for in order to build our probability
distribution of an event. The type of hazards we chose needed to be relevant and to occur with enough frequency that a credible probability model could be built from the historical data. Given these two constraints, we chose cyclones, storm surges, earthquakes, winter storms,
thunderstorms, wildfires, and terrorism as our covered risk classes. These hazards are all relevant to business operations, and there was enough historical data to create a probability distribution of the likelihood that one of these events may occur in the future.
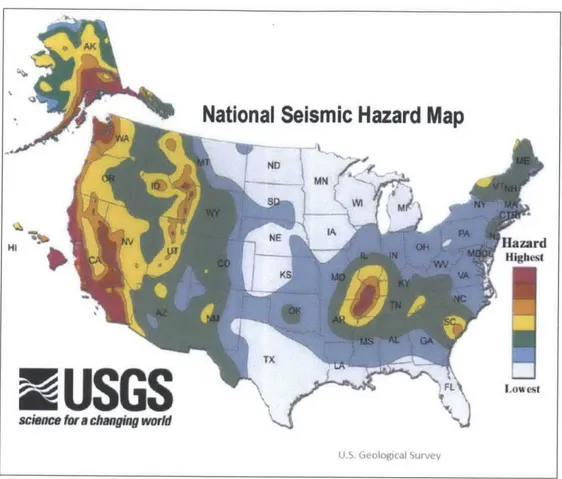
For each of our selected natural catastrophes, there is considerable historical frequency and severity data collected by public organizations such as the US Geological Survey and private organizations such as Applied Insurance Research. When visualized, we may view the hazards in risk heat maps, which can quickly assess the likelihood of such disruptions in any particular region of the world. Figure 3 shows a risk heat map of earthquakes in the United States. This information, when combined with a risk exposure index, can be used to calculate a VaR for every node in a supply chain network.
National Seismic Hazard Map
540 Hazard HighestIoet
NEUSGS
(1inc 1w chagin wouldc ureFigure 3: Earthquake Risk Heat Map (Source: U.S. Geological Survey)
Risk heat maps are often created for natural catastrophes, but there are very few instances of these maps for man-made disasters. Apart from our chosen hazards, we did not include
general operating risks in our model because not all manufacturing plants are built the same, and almost no supplier or distributor will face the same types of operating risks. Thus, general
operating risk was beyond the scope of our project.
3.3.2 Risk Exposure Index ("REI")
Risk exposure is a measure of the maximum loss potential should a disruption event occur. For our purposes, this would mean the amount of revenue lost should a node be removed from the supply chain network. For each node in our network, we defined this risk exposure
amount to be equal to the daily revenue dependent on this supplier, multiplied by the difference in recovery time and inventory days,
REI = Daily Revenue (Recovery Time - Inventory Days).
We worked backwards through BOM to determine how much revenue is dependent on each part and thus on each supplier. Suppliers are often connected to multiple different finished goods. For example, if a supplier were removed from our network because of a natural catastrophe, our total loss would be the daily revenue that was dependent on supplier, multiplied by the number of days it takes to find an alternate supplier less the number of days of inventory we were holding. We defined daily revenue not in terms of the value of goods we lost from the supplier but, rather, in terms of the value of daily sales from the company's standpoint. The lost supplier may have been providing relatively inexpensive components to our manufacturing plant, but the true economic loss was the disruption in production that occurred because of the loss of those components.
We chose this definition of risk exposure because of its ease of calculation and its explanatory power in capturing the financial exposure of each supply chain node. For sole supplier relationships, 100% of the revenue for dependent products is at risk in the event of losing the supplier. For multi-supplier relationships, we can adjust the risk exposure by the percentage of the materials that each supplier provides. This is a very imperfect approximation as we do not know the manufacturing capacity of each supplier. It is explained in more detail in the discussion section.
3.3.3 Exceedance Probability Distribution
The next step in building our loss distribution was calculating the probability of losing each node in our network to natural catastrophes. Exceedance probability ("EP") curves are a common way of displaying this information in the catastrophe modeling industry. These curves show the probability that certain levels of losses will be exceeded. We concentrate on the idea of exceedance because every location in the world is expected to have average annual losses
("AAL") caused by our selected hazards. Routine losses are uneventful in that they are expected and generally do not cause major disruptions.
EP curves allow us to identify the probability of novel events that may greatly exceed normal losses, which the insurance industry would then categorize as a "catastrophe event." In the example shown in Figure 4, we can see that there is a 1.3% probability of a catastrophe creating more than $1,000 of damage per $1 million of assets, which is approximately 1% of the total asset value. The position and shape of this curve differs for each node in the network based on location, altitude, proximity to coasts, etc. For acquiring this type of information, we
Exceedance Probability Distribution
2500 --2500 --- ---- --- -C 1000 E 0% 1.3% 5% 10% 15% 20% 25% ProbabilityFigure 4: Exceedance Probability Curve ("EP Curve")
Applied Insurance Research (Verisk Analytics)
Applied Insurance Research ("AIR") founded the catastrophe modeling industry in 1987 and is a member of the Verisk Analytics group. AIR is the leading provider of risk modeling software, and they have traditionally served clients in the property and casualty insurance industry, creating models that have become industry standards in determining the price of risk. Their database extensively documents the frequency and severity of all historical natural catastrophes reaching back 250 years. Their sources include public entities, such as the U.S. Geologic Survey and other government agencies, as well as privately collected weather research from their full-time staff of geologists. In order to calibrate their models to our specifications, we provided AIR with our selected hazards, the risk vulnerabilities, and the maximum loss for each
Hazard Module
The first piece of data that AIR required to generate EP curves was the hazard selection and locations of supply chain nodes. We provided AIR with our seven selected hazards and the addresses of every node in our supply chain network. All of our locations were based in East Asia, the Americas, and Europe; AIR had no difficulty in generating EP curves for these
locations because they are all major insurance markets. It should be noted that AIR does not have high-quality data for every region in the world because much of their past focus has been on major insurance markets. However, they have been researching models for developing regions in the world.
Vulnerability Module
Next, AIR requested information on the building construction and the types of assets located at each node. This information was necessary to further refine the EP curves since, for example, concrete buildings with no windows would be more durable than warehouses made of corrugated steel panels. Since AIR traditionally services the insurance industry, they requested information on the building construction and the types of assets located at each node. We decided that it would be impractical to build a calculation with this level of granularity. We instructed AIR to assume generic commercial building types at each node.
Financial Module
We instructed AIR to normalize all of our EP curves to $1 million of replacement value for each node in the network. With normalized results, we can scale our loss distribution to the actual amount of financial exposure at each node.
3.3.4 VaR Quantification
In our final step of the VaR quantification, we determined a loss threshold at which we believed we would lose a node in our supply chain. That threshold was set to 1% of the
building's replacement value. We chose this threshold in discussion with our sponsor company because commercial buildings do not need to sustain large financial damage for operations to be disrupted. This disruption can be real damage to products or facilities, or structural cracks to cause the municipal building inspection to evacuate facilities. Also, 1% damage to a commercial building may imply much greater damage to the nearby homes of the workers. The replacement value of an asset does not inherently represent the value of the asset in terms of operating capability. For example, relatively minor damage to the electrical or plumbing system of a manufacturing plant could cause operations to cease for the foreseeable future. Thus, a low threshold added conservatism to our model.
Once we determined our threshold, we used AIR's EP curves to determine the probability of outage at each node in our supply chain. We multiplied this probability against our REI to obtain our VaR amount for each node. It should be noted that we did not attempt to calculate a definitive VaR for all risk classes and exposures at each node. We used a less granular VaR calculation because our goal is to create a simple index to compare the relative risk between the nodes in a network.
3.4 Integrated Supply Chain Risk Management
Once we completed our VaR quantification, we integrated the information into our supply chain map in Sourcemap, which color-coded our network based on the relative VaR of
the highest concentration of risk; however, our task was not complete. Integrated SCRM does not stop at risk identification and quantification. It also refers to a comprehensive organizational understanding of the risks of doing business and developing a system for identification, mitigation, and recovery.
Following the completion of our work in Sourcemap, we reviewed our results with our sponsor company and discussed what we could do with our results in creating a framework for SCRM for the company. In our discussions, we determined the next following steps:
1. Work with IT to automate the flow of BOM and procurement data for SCRM; 2. Train employees to use software such as Sourcemap to identify risks;
3. Develop management reports to highlight areas of concern;
4. Build a culture of risk management with the corporate strategy group. In creating our methodology for SCRM, we realized that building a culture of risk management may be the most ambiguous and challenging step for any company because it involves not only building the technology to identify risk but also providing the organizational leadership to use the information to its fullest potential.
4. DATA ANALYSIS & RESULTS
We mapped an end-to-end supply chain of selected product lines, quantified the amount of risk at each node in the network, and demonstrated the new supply chain set up with risk mitigation. As a result of our study, we mitigated the VaR from single-source vendors with moderate disruption probabilities and primary vendors with high disruption probabilities. In order not to disclose any confidential information of the partner company, we presented
hypothetical data to illustrate the results. More detailed supply chain analysis and establishment of strategic plans in the following discussion section are based on the same set of hypothetical data. The supply chain demonstrated is carefully designed so that it shares very similar
characteristics with the actual one, which keeps the exhibition and analysis of the results representative and realistic.
4.1 Visualization
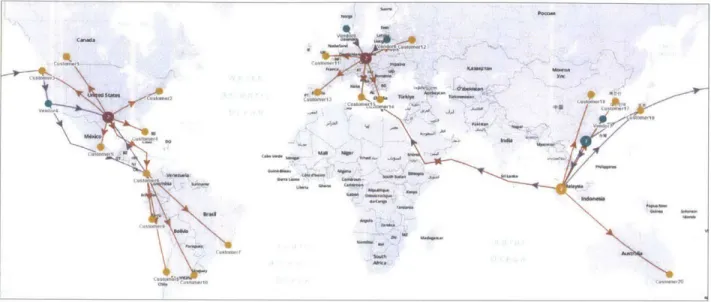
Figure 5 maps out the supply chain of the pilot product lines. It captures the material
flow from vendors to production sites and finally to customers. In this pilot supply chain, we have nine vendors who supply raw materials, located in China, Malaysia, Norway, Poland,
Latvia, and the U.S. The two manufacturing sites are located in the U.S. and Austria, shipping finished goods to the customers in Asia, Europe, North America, and Latin America. There is no distribution center in this supply chain. Strategic and operational guidelines are in place relating to the service scope of each manufacturing site geographically, provided no major disruption occurs. We manipulated the route of an ocean shipment by adding way points in the dataset, which came from the transportation department and expediting companies.
The color code of each node in this base view is different for each type of facility, which keeps the map more visual and user friendly.
VU--cost. 'S O "WOO. KNSWMN moomoo YM rt, Is costw'."s * '. 14 St"119 ftv MMI mipf Ai U-0"P--Aft. C-1-2f,
Figure 5: Maps out the Pilot Supply Chain
Figure 6 provides more details about the risk exposure of all the nodes. We found from the bar chart (right) that the two manufacturing sites are most significantly exposed to risks, far outweighing any vendor or customer in the supply chain. Among the vendors, however, Vendor
5 located in Hong Kong ranks the first in risk exposure, reaching 158 million dollars.
Rcverey T1Me
Ona" m : mpt"M
NAmil. Manimum 222
Total:2iI ~
Other metrics can also be selected in visualizing the node performance, including, but not limited to, days of inventory, recovery time, revenue, and value-at-risk. Figure 7, for example, displays the recovery time at each vendor, being 10 days or 30 days depending on whether the material is a commodity or a customized product.
F*ue7 iulzsNdsad rpsDsrbto fRcvr Tie
aT
avrg
11
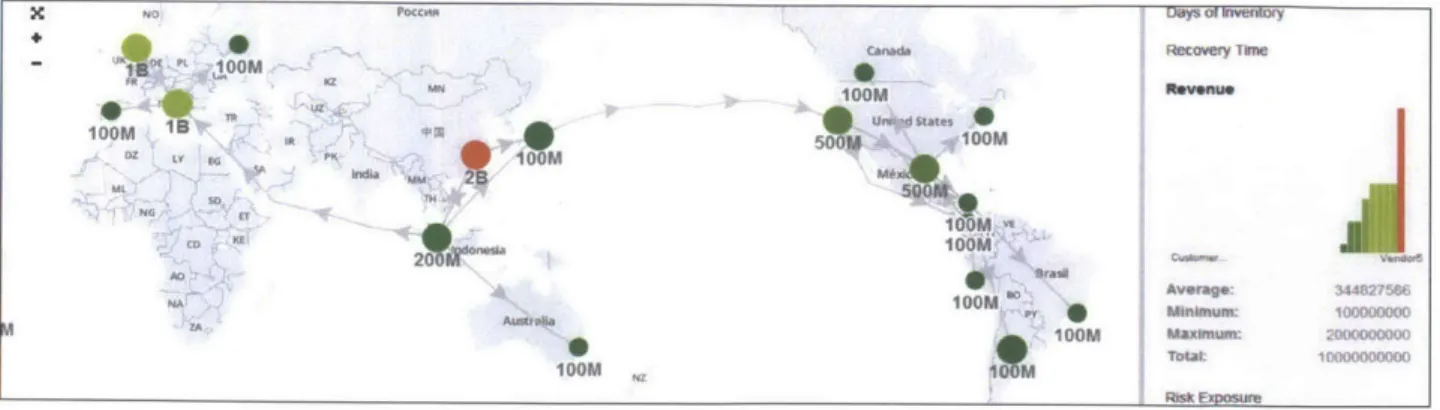
Fiur 8dipa thVereo atcpto tec oei eeu e ean Wedf
C Mianum
Urad -d al 90
9 IFL
found that supply from Vendor 5 was linked to the total revenue generated across all the pilot
product lines. The nodes with longer recovery time and lower inventory, but generating the most revenue, are regarded as the most vulnerable points within the supply chain in case of any real time disruption.
X N pocme clays o fiveitary
-Cais"d Recovery TkIre
MIMN loo lo Un d states *Z LYP so lo 1M 521 MA 0 NO K' Ia MkdiisalO 200M I1a0Mnvs AQ Average: 344I275-6 N lOO0M n, ; Minkinum: 00000000 0 looM Maximum 2000000000 M MTot Risk Exposure
Figure 8: Visualizes Nodes and Graphs Distribution of Revenue
Figure 9 is a tree structure of the pilot supply chain that was automatically generated by Sourcemap when the data set was uploaded. It displays more explicitly the multi-echelon relation among the participants within the supply chain. We found from the tree that each manufacturing site was dedicated to the supply of certain customers. In addition, most vendors served a single manufacturing site, except Vendor 5.
Figure 9: Displays Material Flows of Pilot Supply Chain
Ln V. a* M IC V as V all *0 V. 16. l-111110111, in Q U 4W
4.2 Value-at-Risk
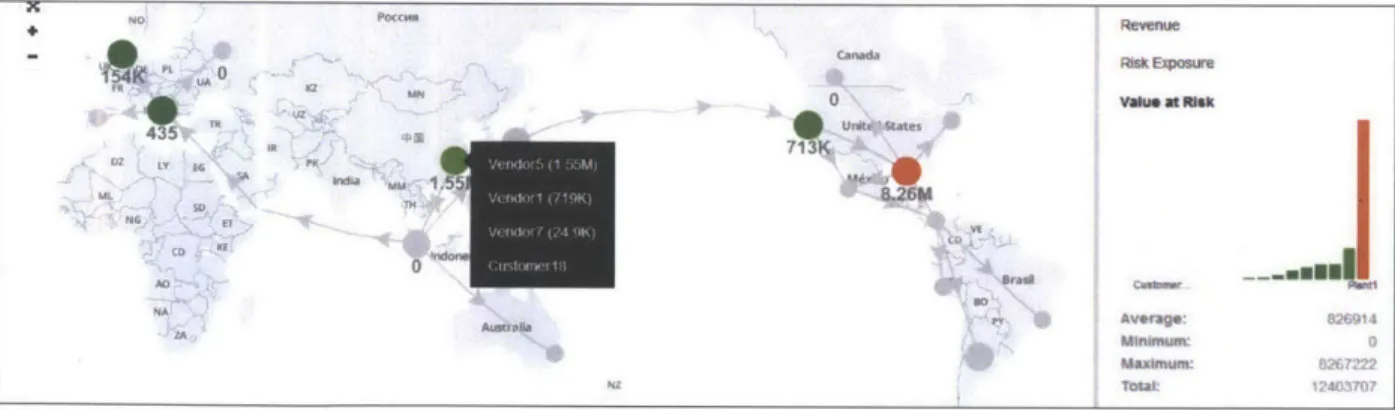
Figure 10 displays the value-at-risk at each node of the pilot supply chain. It ranges from zero to over eight million dollars.
Auarii Aeveanm073 Can&& A RkSk EXPOsMM M O 1W ,9M8.6 Avorage107( Minimum: 0 Maximum: 22 Toal '4011034
Figure 10: Visualizes Nodes and Graphs Distribution of VaR
By clicking the cluster, we are able to drill down to related vendors as is displayed in Figure 11. The node in light green with value-at-risk of 3.93 million dollars is a cluster of Vendor 5, Vendor 1, Vendor 7 and Customer 18. The map shows only the biggest value in the
node. We can see that Plant 1 has the highest value-at-risk of 8.26 million dollars, followed by Vendor 5 in Hong Kong of 3.93 million dollars and Vendor 1 in Shenzhen of 1.15 million
ZZ StRecovery Time NoN Po"c Revenue UA Risk Expour U7 vwwu at N"s 435 UN, 'd States A"MM 3,: m9 NG T ThV ACI Brasa AtibPAvorage:1073 Minimum: 3 Maximum: T267222 Total: 141034
Figure 11: Visualizes Related Vendors in a Cluster and Their VaR
In search of the cause of high value-at-risk at certain nodes, we visualized disruption probability in Figure 12. We found the combined disruption probability at Vendor 1 was the highest at 13.1%. Pocca o 0 u 0 T 9 as UX 13.1ej Days of Inventory Recovery Time Revenue RlSk Expour value at Risk Dwarutn Probablift
-Allii
01 2IFigure 12: Visualizes Nodes and Graphs Distribution of Disruption Probability
The disruption probability illustrated in Figure 12 is a combination of probability distributions of all related independent disruptions, including cyclone, storm surge, earthquake,
Average: Minimum: Maximum Total: U x Canada 0 UNllL1d SRates 6. M6.0 5.2 NZ
winter storm, severe thunderstorm, wildfire and terrorism. Figure 13 demonstrates the major disruptions and the related probabilities at certain nodes.
14.00% -- - - -- -12.00% 10.00% Terrorism 8.00% a Sevem Storm 6.00% E Winter Storm 4.00% a Earthquake 2.00% a Cyclone
0.00%-Piano, Texas Arendal, San Jose, Houston, Shanghai, Hong Kong Shenzhen Norway California Texas China China
Figure 13: Displays Probabilities of Major Disasters at Certain Nodes 4.3 Mitigating Raw Material Supply Risk
By adding more suppliers into the supply chain and adjusting the sourcing proportion, we are able to reduce the total risk in raw material supply. For example, in order to reduce the total value-at-risk from vendors, we added Vendor 10 located in Georgia as a second source of sulfuric acid 2%, which used to be solely sourced from Vendor 5. Vendor 5 and Vendor 10 each supplies 50% of the total volume. The total value-at-risk for sulfuric acid 2% drops to 1.95 million dollars, compared to 3.93 million dollars before risk mitigation. On the other hand, the source split of ammonia was adjusted between Vendor 1 located in Shenzhen and Vendor 2 located in Penang Malaysia, from 80 / 20 to 50 / 50. In other words, Vendor 1 is no longer a primary source of ammonia, which forces the total value-at-risk for this particular raw material
down by 37% to 720,000 dollars.
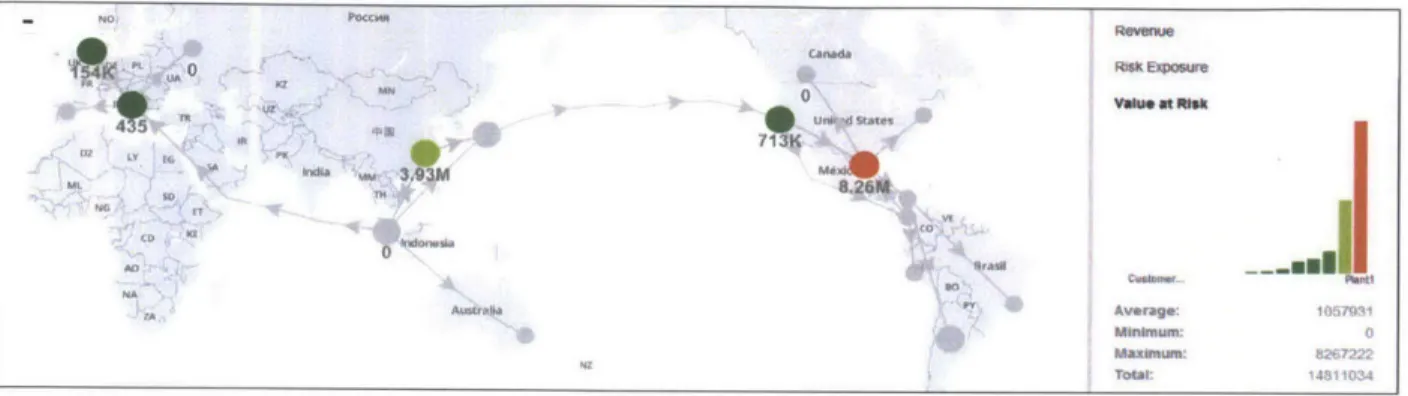
Figure 14 visualizes the new distribution of value-at-risk after mitigation plans implemented from raw material supply perspective.
NO, POCCaa Revenue
-~ ~ A Ncanada Risk~ EVcOSwve
0 vau at ws 435 " .1 unlte States m 713K D7 IV it; FFIm Austrla Average. 8 4 Minimum: 0 Maximum: NZ Total: 40
5. DISCUSSION
In this section, we built on the results of data analysis and developed strategies to mitigate risks of different types. We also identified a number of limitations in our thesis project that can be further researched. Last, but not least, by closely communicating with the cross-functional team of the sponsor company, we attained some insight into what needs to be done in the future to better implement the visualization tool on an enterprise level.
5.1 Risk Mitigation
There is a wide variety of supply chain risks in real operations. In our thesis, we classified the risks based on the risk valuation framework and focused on two entities: single-source vendors with moderate disruption risks and upstream strategic partners with high
disruption risks. In addition to that, we also discussed mitigation plans of primary manufacturing sites with moderate disruption risks, the outcome of which cannot be quantified in our data analysis section. The strategies were developed for the specific operations and industry but they could also be applied more broadly with appropriate adjustments.
5.1.1 Single-Source Vendors with Moderate Disruption Risks
Seeking lean strategies, many multinational companies have reduced the supply base and formed strategic partnerships with single-source vendors, in a way to further leverage economies of scale, eliminate redundancy and thus reduce costs. While the organization is leaner with fewer suppliers, it becomes more vulnerable to any type of disruptions that occur around the world. Vendor 5 is an outstanding example to illustrate how immense the potential loss is if disruption
over a portion of the supply from Vendor 5, potential revenue loss dropped by around 50% by measurement of value-at-risk. From a risk control perspective, we concluded from the model that multiple sourcing is effective in mitigating disruptions from single sources. It is also critical to keep the multiple sources geographically scattered, so that the supply chain is more flexible in response to unpredictability. Multiple sourcing itself, though, is very costly. The category
management team or the company at large is better off setting an internal target to keep a balance between risk mitigation and cost control.
To implement multiple sourcing in reality, more has to be taken into consideration given the fact that vendor qualification is in most cases determined by a cross-functional team. Many single sources are in essence sole sources because no other vendor in the market is capable of meeting the internal standards of product quality, process reliability and regulatory compliance. The strategy in this regard is still to diversify the supply, but in an alternative way to either invest in enhancement of other vendor's capabilities or negotiate for the vendor's geographic
expansion.
5.1.2 Upstream Strategic Partners with High Disruption Risks
Another type of risk deals with upstream strategic partners, also known as primary suppliers. Our model shows that the organization faces enormous risks with a primary supplier situated somewhere with high disruption risk probability. Vendor 1 is a primary supplier that supplies 80% of the total volume of ammonia. Being located in Shenzhen indicates that Vendor 1 is highly vulnerable to cyclone damage. The mitigation strategy is to lessen the company's dependence on Vendor 1. By balancing the supply between Vendor 1 and 2, we found that potential revenue loss was reduced by 37%, as is shown in Table 1. An alternative strategy is to
increase the inventory of ammonia. It is not as effective as the previous one though, in that it takes longer time than the inventory can cover to install additional capacity in other vendors when disruption attacks the primary one and curtails all production. In addition to that, building more inventory conflicts with the current practice of lean operation and requires review and redesign of the performance evaluation system at large.
Sourcing Split Value-at-Risk
Vendor 1 Vendor 2 Vendor 1 Vendor 2 Total Reduction
Base 80% 20% 1,150,000 - 1,150,000
Mitigated 50% 50% 719,000 - 719,000 37%
Table 1: Compares Effect of Risk Mitigation on Upstream Strategic Partners
Adjusting the split of supply among vendors, as is experimented in the model, is one way to lessen dependence on a particular vendor. In reality, there are always various reasons, for example lower purchase or logistics cost, that prevent a company from making such a decision. There is another approach, however, to secure the supply in case of disruptive events occurring at the primary supplier. The company can sign option contracts with other vendors, to reserve their capacities by paying certain fees upfront.
5.1.3 Primary Manufacturing Sites with Moderate Disruption risks
Plant 1 shares very similar characteristics in our model with Vendor 5. It is located in a moderately risky place but contributes to a considerable amount of the company's revenue. The recovery time of internal sites, in contrast with that of vendors, is much longer. It takes as long as a year and massive resources to rebuild the facility or establish a new one at another location in case of severe disruptions. The strategy for internal sites is therefore considerably different from
lines, manufacturing is very centralized. Finished goods are shipped directly from manufacturing sites to customers, which means no distribution center exists to keep a certain level of inventory and buffer the impact from disruptions at manufacturing. However, the manufacturing facility and equipment are strong enough to resist a high category natural disaster, which grants the site a higher threshold to determine its disruption probability. The threshold in our model was kept the
same as that for vendors. That is to say, the value-at-risk of Plant 1 is far lower than what was shown in the previous section.
For those internal sites that are vulnerable to lower category disasters, one strategy is to decentralize capacity to other production sites or contract manufacturers, depending on the degree of manufacturing complexity, intellectual protection and logistics agility. In the meantime, those internal sites should be pushed more downstream in the supply chain. For example, it is better for an in-house plant located in a high-risk area to be dedicated to final assembly, so as to minimize the amplifying effects downward. Companies with aggressive expansion through frequent mergers and acquisitions are well positioned to re-arrange the production flow across all the sites. An alternative strategy to decentralized capacity is to build more inventories at central or regional warehouses. Such an approach is best suited for those operations that require a high fixed cost and excessive intellectual protection.
5.2 Insights into a More Integrated and Automated Platform
Exhibit 5.2 summarizes the sources of the data that were required for the thesis project. Most data was collected from the SAP system. However, there are a number of key items that can only be found in offline spreadsheets owned by different functions. Exhibit 5.2 depicts a few areas for improvement in enterprise document management systems. When we looked back on
the past few months, we spent a considerable amount of time collecting data from different functions and consolidating them from separate offline spreadsheets. We foresee even greater efforts in data consolidation when a more complex supply chain is mapped out.
Item Source Remark
BOM SAP(CS12)
Vendor List SAP(ME3M) Manufacturing Addresses Upstream Raw Material Spreadsheets
Inventory
Recovery Time Procurement Strategy Developed by Category Buyers
Origin Address Production Site Address Downstream Destination Name SAP(VL06F)
Destination SAP(VLO2N) Bill of Lading
Address
Forecast Offline Spreadsheet Lotus Notes, Forecast Database, Demand File
Revenue Average Price
Related FP SAP(CS12)
Table 2: Sources of Required Data for the Project
In order to achieve a higher degree of automation in data collection and formatting, we would suggest the following for enterprises to improve their document management.
First, manufacturing addresses of vendors should be added to the ERP system in addition to billing addresses. The vendor management module within ERP system, in most organizations, is managed by commercial teams, which are only concerned about billing addresses of vendors based on where they exchange purchase orders or invoices. Manufacturing addresses, usually different from billing addresses, often are not properly documented or are unknown to the entire organization. Requesting such information through commercial functions takes extra time and causes extra manual formatting efforts, which could be avoided by inputting complete
Second, procurement strategies should be more explicitly documented. At the moment, in our sponsor company and many multi-national companies at large, vendor development
strategies are divided among a group of category buyers. Each buyer keeps a set of strategic plans for relevant vendors based on their requirements. However, the metrics of vendor
performance or development plans could hardly be translated into any single value of estimate to determine disruption risks. We suggest some key operational aspects be captured by procurement including supplier's factory location, recovery time, capacity, sourcing splits and inventory.
5.3 Limitations of the Research
Due to limited time and resources, there are a number of limitations of our thesis research. Below lists the three most important limitations that can be addressed through further research.
First, we assumed that all vendors were operating with unlimited capacity when determining their risk exposures. Risk exposure in our thesis was calculated based on the sourcing quantity, recovery time and inventory. For example, given the same recovery time and inventory, a small-sized supplier that supplies 80% volume of a particular raw material has a higher risk exposure, compared to a big-sized supplier that supplies the remaining 20%. With that being said, we did not count backup supply as a key factor in determining risk exposure. However, for multiple-sourced raw materials, losing a large supplier that has small sourcing quantity but higher free capacity may have a more significant impact on the manufacturer, when a smaller primary supplier is already constrained in capacity and cannot afford to supply any backup volume. The model of risk exposure can be further worked on to incorporate vendor capacity.
Second, in order to create a very simple risk index that could calculated with minimum data, our model did not include general operating risks such as building fires, faulty equipment or human error. Operating risks are not relevant to risk analysis of any internal site because they
should not be interpreted through a probability assessment but instead should be controlled through well-established standard operating procedures. Operating risks at vendor level, potentially, can be built into the model, which would allow senior management as well as procurement teams to see a full picture and develop comprehensive strategies.
Third, the threshold to determine the disruption probability of each type was roughly estimated in our thesis. A better estimate would require involvement of civil and electrical engineering and is always based on the vulnerability analysis of all the assets. These estimates vary from site to site if location or civil standards are different. Our thesis assumed 1% across all vendors and 2% across all internal sites because the main purpose was to compare, in a relative sense, risk exposure and value-at-risk within the supply chain. It would be worth time and effort to differentiate the threshold in future research, especially when the tool is more broadly applied to visualize a more complex supply chain.
6. CONCLUSIONS
Nearing the end of our research, we observed increasing interest in our results from our sponsor company and members of the MIT Hi-Viz project. We hope that more organizations will use a supply chain risk framework and see the value it adds to their business. As we conclude our findings, we will review the potential uses of our SCRM strategy, the deficiencies of our
research, and possible future improvements.
Potential Uses
When corporations are able to quickly visualize their supply chains, assessments of risk exposure and mitigation solutions will often surface quickly. Yet, there will be questions about which solution would be most cost effective and provide the most risk mitigation. The scope of our project includes risk identification and quantification; but a natural extension of our research would have been utilizing our SCRM strategy to include scenario planning and stress testing.
When we showed our sponsor the key risk in its supply chain, the next step was to find an appropriate response to reduce that risk. However, there were questions whether the best
response was to find additional suppliers and, if so, how many were adequate. To address that question, our visualization and VaR quantification methodology can be applied to hypothetical situations. The scenario tests can be used in conjunction with a cost-benefit analysis to determine the best course of action. Finally, we can stress test our supply chain to understand resiliency. By simulating disasters, we can identify weak spots in our supply chain that our calculation missed.
Deficiencies
Over the course of our project, we did encounter issues obtaining information from all of our sponsor's departments. In particular, we had difficulty engaging the procurement department to help assess the recovery time of replacing key suppliers and the available capacity in the market for key components. We were working directly with the supply chain manager at our
sponsor company, who had limited influence in the procurement area and faced difficulty in convincing employees there to provide detailed information. The problem arose for two reasons:
1) purchasing has higher priority assignments than this project and 2) there were multiple procurement officers who had control over pieces of the information we requested. Both factors increased the lead time before our requests were fulfilled.
In hindsight, we should have engaged procurement managers earlier in the process and obtained their agreement to provide data for our project.
Future Improvements
After reviewing our project with our sponsor and hearing their feedback, we noted
potential additions to our SCRM strategy that could further enhance value for organization. First, live real-time alerts from monitoring organizations could provide risk managers with warnings of upcoming disasters. Second, an intercompany visualization platform could connect the company with external suppliers and distributors, which would create a vertically integrated and resilient supply chain.
Business organizations that have focused on cutting costs by aggregating orders to fewer suppliers have also concentrated the risks in their supply chains. In order to balance risk and efficiency, we recommend that organizations examine our approach for risk identification,
company to find a balance in building an economically resilient supply chain and to create a sustainable system for all stakeholders.
REFERENCES
Achilles. Accessed 8 April 20014: https://www.achilles.com/en/buyer-solutions/supply-chain-mapping.
Amerigo. Accessed 8 April 20014: http://www.supply-chain-mapping.com/.
Amendola, A., T. Ermolieva, J. Linnerooth-Bayer, and R. Mechler (2013). Integrated Catastrophe Risk Modeling, 2013 ed. Springer.
Datta, Austin and Shoumen Palit (2006). Risk in the Global Supply Chain. School of Engineering, Massachusetts Institute of Technology, Cambridge, MA.
Deshmukh, Vinay (2006). The Design of a Decision Support System for Supply Chain Risk Management. School of Engineering, Massachusetts Institute of Technology, Cambridge, MA. Gardner , John T. and Martha C. Cooper (2003). Strategic Supply Chain Mapping Approaches. Journal of Business Logistics, Vol. 24, No. 2, Pg. 38.
Hopp, Wallace J. and Zigeng Yin (2006). Protecting the Supply Chain Networks Against Catastrophic Failures. Dept. of Industrial Engineering and Management Science, Northwestern University, Evanston, IL.
Levy, Romain (2007). Evolutionary Supply Chain Risk Management: Transforming Culture for Sustainable Competitive Advantage. School of Engineering, Massachusetts Institute of Technology, Cambridge, MA.
Machowiak, Wojciech (2012). Risk Management - Unappreciated Instrument of Supply Chain Management Strategy, Scientific Journal of Logistics: 8 (4), 277-285.
Mullich, Joseph (2013). "Do not Disturb: Preventing Supply Chain Disruption." Wall Street Journal, September 23, 2013.
Navigant. Accessed 8 April 20014: http://www.navigant.com/.
Nnadili, Beatrice N (2005). Supply and Demand Planning for Crude Oil Procurement
in Refineries. School of Engineering, Massachusetts Institute of Technology, Cambridge, MA. Pochard, Sophie (2000). Managing Risks of Supply-Chain Disruptions: Dual Sourcing as a Real Option. School of Engineering, Massachusetts Institute of Technology, Cambridge, MA.
Schmitt, Amanda J. and Mahender Singh (2009). Quantifying Supply Chain Disruption Risk Using Monte Carlo and Discrete-Event Simulation. Proceedings of the 2009 Winter Simulation Conference.
Sheffi, Yossi (2006). "Building a Resilient Organization." The Bridge, Journal of the National Academy of Engineering, December 2006.
Smith, Mark, Fannin, J. Matthew and Richard P.Vlosky Forest (2009). Industry Supply Chain Mapping: An Application in Louisiana, Forest Products Journal, Vol. 59, no. 6, Pg. 7-16. Wakolbinger, T. and J.M. Cruz (2011). Supply Chain Disruption Risk Management through Strategic Information Acquisition and Sharing and Risk-sharing Contracts, International Journal of Production Research, Vol. 49, No. 13, 1 July 2011.
Zsidisin, George A. and Robert Ritchie (2008). Supply Chain Risk: A Handbook of Assessment, Management, and Performance, 2008 ed. Springer, Pg 22.