HAL Id: hal-01306234
https://hal.archives-ouvertes.fr/hal-01306234
Preprint submitted on 22 Apr 2016HAL is a multi-disciplinary open access archive for the deposit and dissemination of sci-entific research documents, whether they are pub-lished or not. The documents may come from teaching and research institutions in France or abroad, or from public or private research centers.
L’archive ouverte pluridisciplinaire HAL, est destinée au dépôt et à la diffusion de documents scientifiques de niveau recherche, publiés ou non, émanant des établissements d’enseignement et de recherche français ou étrangers, des laboratoires publics ou privés.
Foraging traces as an indicator to monitor wild boar
impact on ground nesting birds.
Fabrice Roda, Jean-Marc Roda
To cite this version:
Fabrice Roda, Jean-Marc Roda. Foraging traces as an indicator to monitor wild boar impact on ground nesting birds.. 2016. �hal-01306234�
Working paper- Foraging traces as an indicator to monitor wild boar
impact on ground nesting birds.
Author names and affiliations:
Fabrice Roda
CIRAD, UPR BioWooEB, F-34398 Montpellier, France 757 chemin du Collet Redon, 83136 Rocbaron, France Email: [email protected]
Jean-Marc Roda
CIRAD, UPR BioWooEB, 43400 Serdang, France CIRAD, UPR BioWooEB, F-34398 Montpellier, France UPM, 43400 Serdang, Malaysia
Email: [email protected]
Corresponding author:
Fabrice Roda
757 chemin du Collet Redon 83136 Rocbaron
France
Email: [email protected]
Author contributions:
Conceived and designed the experiments: FR. Analyzed the data: FR and JMR. Contributed analysis tools: JMR. Wrote the paper: FR.
Submission declaration:
All authors agree with the contents of the manuscript and its submission to the journal. Neither the manuscript nor any parts of its contents are currently under consideration or published in another journal. All authors disclose any potential conflict of interest with other people or organizations that could inappropriately influence their work.
Funding Source:
This work was funded by the CIRAD, UPR BioWooEB (provided analysis tools). 1 2 3 4 5 6 7 8 9 10 11 12 13 14 15 16 17 18 19 20 21 22 23 24 25 26 27 28 29 30 31 32 33 34 35 36 37 38 39 40 41 42 43 44 45 46 47
Foraging traces as an indicator to monitor wild boar impact on
ground nesting birds.
Abstract
The successful management of large herbivores requires the monitoring of a set of indicators of ecological change describing animal performance, relative animal abundance, and ungulate impact on habitat. Wild boar populations increases have been spectacular in many countries including France. Wild boars can have a substantial environmental impact on many ecosystem components including birds, but indicators to monitor such impact are currently lacking. In this paper, we examined the usefulness of monitoring the wild boar foraging traces made during their rooting activity to evaluate their impact on ground nesting birds, and developed a simple indicator of kilometric foraging (Ikf) traces found on transects. This study measured the effect of wild boar on bird abundances, controlling for vegetation characteristics (shrub density, time since last clear-cut). Using standardized spot-counts, we found that ground nesting bird abundances were negatively correlated to IkF. Our results showed a significant decrease of 44,7% in ground nesting bird abundances in areas strongly foraged by wild boars. By contrast, abundances of birds depending of ground or tree for food resource, but nesting out of reach of wild boars, were not correlated to foraging traces. We thus conclude that IkF is a simple and suitable indicator that can be used at large scales to monitor wild boar impact on ground nesting birds.
Keywords
ungulates; birds; wild boar; ungulates management; over-abundance
List of abbreviations
AIC: Akaike information criterion Cut: time since last clear-cut GN: ground nesting
TN: tree nesting GF: ground foraging TF: tree foraging
IEC: indicator of ecological change
Ikf: indicator of kilometric foraging (continuous variable) Ikf-: areas with low densities of foraging traces
Ikf+: areas with high densities of foraging traces S: index of shrub density (continuous variable) S-: areas with low shrub density
S+: areas with high shrub density
Tim: timing of spot-count (early vs. late spring) 48 49 50 51 52 53 54 55 56 57 58 59 60 61 62 63 64 65 66 67 68 69 70 71 72 73 74 75 76 77 78 79 80 81 82 83 84 85 86 87 88 89 90 91 92 93
Graphical abstract
Mean ±SE 0,2 0,3 0,4 0,5 0,6 0,7 0,8 0,9 1,0 I kF 0 2 4 6 8 10 G NIndicator of wild boar foraging
G
ro
u
n
d
n
es
ti
n
g
b
ir
d
s
95 96 97 98 99 100 101 102 103 104 105 106 107 108 109 110 111 112 113 114 115 116 117 118 119 120 121 122 123 124 125 126 127 128 129 130 131 132 133 134 135 136 137 138 139 140 141 142 143 144 145 1461. Introduction
In past decades, the decline of temperate bird species in Western Europe and in North America has attracted much concern (Birdlife International, 2004; Julliard et al., 2004a; Fuller et al., 2007a; Gregory & van Strien, 2010; EBCC, 2015). The causes of the observed decline of temperate songbirds are complex. Habitat quality loss may be responsible of the observed decline of forest (Fuller et al., 2007a; Gregory et al., 2007; Quine et al., 2007; Fuller, 2012) and farmland songbirds (Chamberlain & Fuller, 2000; Chamberlain et al., 2000; Voříšek et al., 2010). In addition, climate change poses a threat to some bird species (Julliard et al., 2004b; Jiguet et al., 2007; Gregory et al., 2009).
In parallel to the decline of temperate songbirds, wild ungulate populations increases have been spectacular in many regions of North America (Côté et al., 2004; Rawinski & Square, 2008) and Western Europe (Milner et al., 2006; Massei et al., 2015). The main causes proposed for wild ungulates over-abundance (as defined by Côté et al., 2004) are climate change, the local extermination of natural predator species, supplementary feeding, and changes in agricultural, sylvicultural and game management practices (Flueck, 2000; Milner et al., 2006; Servanty et al., 2009; Massei et al., 2015). For example in Europe, wild boar (Sus scrofa) populations reach historical peaks (Saint-Andrieux et al., 2012; Massei et al., 2015). The impact of over-abundant wild boar on conservation and economic interests include spread of diseases to livestock and people, vehicle collisions, and damage to crops , as well as reduction in plant and animal abundance and richness (Bourcet et al., 2003; Massei & Genov, 2004; Brandt et al., 2006; Vignon & Barbareau, 2008; Barrios-Garcia & Ballari, 2012). As wild boar populations increase in many European countries (Massei et al., 2015), mitigating wild boar impact on environment and economic interests will present a significant challenge. What are the known consequences of large ungulates over-abundance on ecosystems? Numerous studies focus on high deer density impacts on habitats. Deer over-abundance has strong effects on plant communities, vegetation structure, and on abundance of many invertebrate taxa (Fuller & Gill, 2001; Gill & Beardall, 2001; Côté et al., 2004; Joys et al., 2004; Allombert et al., 2005a; Stockton et al., 2005; Dolman & Wäber, 2008; Holt et
al., 2011; ONF, 2013). Such changes in the woodland ecosystem affecting food and safe nesting
availability are responsible for the negative cascading effects on songbird abundance and biodiversity (McShea and Rappole, 2000; Allombert et al., 2005b; Hewson et al., 2011; Holt et al., 2011; Martin et al., 2011). As omnivorous mammals, wild boars can have a substantial environmental impact and may affect many ecosystem components (Massei and Genov, 2004). Their rooting activity can remove the herbaceous cover (Bratton, 1975; Howe et al., 1981; Carpio
et al., 2014a), and cause a decrease of tree regeneration (Gomez et al., 2003). Wild boars negatively
affect rodents by direct predation on juveniles (Schley and Roper, 2003) or/and competition for food resource (Focardi et al., 2000; Carpio et al., 2014a). Wild boar over-abundance has cascading effects on threatened predators such as wildcat (Felis silvestris) by reducing rodent prey availability (Lozano et al., 2007). Previous studies on wild boar-birds interactions in their native range focused mainly on game bird species (Massei & Genov, 2004). Wild boar predated capercaillie (Tetrao
urogallus) and hazel grouse (Tetrastes bonasia) nests (Saniga, 2002; Saniga, 2003) and simulated
nests of red-legged partridge (Carpio et al., 2014b). As over-abundant wild boar preys on everything on the ground, their negative effects both in their native and introduced range are thus well established (Barrios-Garcia & Ballari, 2012).
To manage wild ungulates ecological footprint, it is necessary firstly to evaluate population size and secondly to precisely measure the ungulates impact through environmental indices. Monitoring changes in these indices provides a basis for setting management objectives (Morellet et al., 2007). 147 148 149 150 151 152 153 154 155 156 157 158 159 160 161 162 163 164 165 166 167 168 169 170 171 172 173 174 175 176 177 178 179 180 181 182 183 184 185 186 187 188 189 190 191 192 193 194 195 196
Massei et al., 2015). Capture-Mark-Recapture methods (CMR) provide an efficient approach to estimate reliably population size, but are extremely time-consuming and expensive when applied to large herbivores (Buckland et al., 2000). Distance sampling methods are less time-consuming but suffer from less accuracy and precision (Buckland et al., 2000; Thomas et al., 2010). Both methods do not provide any functional information on the population-habitat system, as population size per
se does not provide information on the environment. In addition, the primary concern for ungulates
managers is often to prevent over-abundance of herbivore populations (Mysterud, 2006; Nichols & Williams, 2006) rather than predicting accurately how many animals may be harvested or not. Researchers have recently developed tools for managing ungulate populations, which are based on the monitoring of a set of indicators of ecological change (“IEC”; Cederlund et al., 1998; Morellet
et al., 2007). An IEC is an easily measured parameter, sensitive to changes in the relationship
between the population and its resources and habitat (Cederlund et al., 1998; Dale & Beyeler, 2001). Morellet et al. (2007) suggested tracking over time the variations of at least three categories of IECs: one describing animal performance, another describing herbivore impact on environment, and the last describing relative animal abundance. A set of IECs has been first developed for deer management (Morellet et al., 2007), but such a set of indicators is currently lacking for wild boar. Recently, Acevedo et al. (2007) developed a method describing wild boar abundance based on the frequency of fecal droppings. However, IECs describing wild boar impact on fauna, flora, biodiversity and habitat are currently lacking. The main objective of this study was thus to find such an IEC to monitor the impact of wild boar on avifauna.
We made the hypothesis that H1) wild boar preying activity should disturb ground nesting birds and thus decrease their abundances in highly foraged areas. Tree nesting birds are out of reach of wild boars, so we hypothesized that H2) tree nesting birds abundances should not negatively correlate with wild boar foraging activity. As wild boars may have an impact on birds by food competition, we investigated H3) the impact of wild boars on birds depending of ground for food resource, but nesting out of reach of wild boars.
2. Material and methods
2.1 Study area
The forest massif of Morières / Siou Blanc is situated in southeastern France (8638-ha forest area; altitude 500-650m, Figure S1), in an area with low human density, within which, there are only a few isolated houses. The climate of Morières / Siou Blanc is Mediterranean, with hot and dry summers, mild winters and moderately rainy autumns and springs (mean maximal temperature in July = 27,6°C; mean minimal temperature in July = 19,4°C; maximal annual mean = 18,8°C; minimal annual mean = 12,1°C; mean precipitation in July = 5,6 mm; annual mean 613,4 mm) (Météo France). The forest massif exhibits Mediterranean vegetation, typical of southeastern France. It displays various profiles of vegetation, according to forest management stages. It is a coppice forest, with holm oak (Quercus ilex), downy oak (Quercus pubescens) and a large diversity of shrubs. Some areas are dominated by various pines (Pinus spp.) and by xeric species of scrubs (Rosmarinus officionalis, etc.). Numerous stands contained a mix of pines and oaks.
Sport hunting is an important activity in this forest massif, mainly focused on big game species, especially wild boar. Wild boar abundance varies significantly throughout the massif, with high numbers harvested (6,3 wild boars killed/km²/year). In contrast, roe deer (Capreolus capreolus) is scarcer (0,9 animals killed/km²/year), and red deer (Cervus elaphus) is absent. A small cluster of approximately 50 fallow deer (Dama dama), has been recently introduced by game managers. Livestock animals are absent in the prospected area.
198 199 200 201 202 203 204 205 206 207 208 209 210 211 212 213 214 215 216 217 218 219 220 221 222 223 224 225 226 227 228 229 230 231 232 233 234 235 236 237 238 239 240 241 242 243 244 245 246 247
0
10
20 km
Figure S1: Location of the study area in southeastern France, showing layout of forest massif
Of Siou Blanc les Morrières. 248 249 250 251 252 253 254 255 256 257 258 259 260 261 262 263 264 265 266 267 268 269 270 271 272 273 274 275 276 277 278 279 280 281 282 283 284 285 286 287 288 289 290 291 292 293 294 295 296 297 298
2.2 Sampling protocol
Twenty-six stations were randomly selected. They are evenly spread over the whole forest massif, without prior knowledge of the vegetation, structure or bird communities. Ground visits were organized during the winter season and the positions of the stations were recorded using GPS to allow their subsequent localisation. The stations were in the main body of the forest of Morrières / Siou Blanc and were therefore surrounded on all sides by woodlands. Around each station, a 1 km survey transect was set-up to search for wild boar foraging traces. The survey routes were along pre-existing paths or forest roads of 1-5m width (allowing the possibility for cars or people to enter to the different places).
Each survey route was divided into 100m-length segments, yielding 10 segments per transect. In each segment, the presence of wild boar foraging traces was recorded, which allowed the derivation of a simple indicator of kilometric foraging (Ikf, a continuous variable), that is, the number of segments with wild boar foraging traces/10 segments. This methodology gives an index derived on the frequency of occurrence (see a similar methodology based on fecal droppings in Acevedo et al., 2007). When signs of rooting activity were seen and occupied a contiguous ground area larger than 2m², the segments were considered as positive. Stations with Ikf ranging from 0 to 0,5 were considered as low wild boar traces (Ikf-). Stations with Ikf from 0,6 to 1 were considered as high wild boar traces (Ikf+). These two level factor were used for GLM analysis (see below, statistics section). Two measures of Ikf were made during spring for each station, between 1st April and 30th May 2012. We measured Ikf the same days as bird surveys (see 2.3). We found 25 counts with low densities of wild boar foraging traces (IkF-), and 27 counts with high wild boar foraging traces (IkF+).
Along each survey route, we measured variables related to habitat structure, viz., tree cover, density of shrub cover, average tree and shrub heights. Based on results of previous bird studies (see below
"Vegetation data" section ), we expected these variables to play an important role.
2.3 Bird survey
Spot-counts were all done by the same observer (FR). Counts were carried out in each plot during two visits in spring 2012 ; point-count times were separated by an interval of at least four weeks to detect both early and late breeding birds (1st-15th April and 15th-30th May), following the recommendations of the French Breeding Bird Survey of the National Museum of Natural History (MNHN, 2012; Jiguet et al., 2012). Counts were performed within 1-4h after sunrise. Point-count stations (n = 26) were positioned a minimum of 500m apart to avoid overlap of bird counts. To minimize a potential edge effect (Ries and Sisk, 2004), the center of all study plots were situated at least 100m from the edge of forest alleys. We used 100m fixed-radius point-counts that lasted 5 minutes to allow for a good estimation of relative bird abundances, following the methodology detailed in Blondel et al., 1970 and Jiguet et al., 2012. Repeating point-counts throughout the breeding season improved estimation of species richness and relative abundances of birds (Dettmers
et al., 1999; Drapeau et al., 1999; Bonthoux and Balent, 2012). Points were recorded in the reverse
order during the second count to avoid introducing temporal bias between different stations. Since all of the plots were located in core forest habitats with low visibility, birds were mostly detected through their song. Individuals could be distinguished when several birds continuously sang at different locations in the plot.
We excluded observations of raptors, i.e., Golden Eagle (Aquila chrysaetos), Bonelli's Eagle (Aquila fasciata), Short-toed Snake Eagle (Circaetus gallicus), Peregrine Falcon (Falco
peregrinus), Common Kestrel (Falco tinnunculus), Eurasian Sparrowhawk (Accipiter nisus),
corvids (Corvus corrax and Corvus corrone), Common Cuckoo (Cuculus canorus), and Eurasian 300 301 302 303 304 305 306 307 308 309 310 311 312 313 314 315 316 317 318 319 320 321 322 323 324 325 326 327 328 329 330 331 332 333 334 335 336 337 338 339 340 341 342 343 344 345 346 347 348 349 350 351
Woodcock (Scolopax rusticola) as these species were poorly surveyed by the method used and/or have life cycles that make them irrelevant to the objective of the study. Game birds (Alectoris rufa, and Phasianus colchicus) were not recorded since their presence in a particular station may have been due to game releases in the area.
To test the hypothesis that the wild boar impact on birds may result of direct predation, we established a classification system that grouped the bird species encountered during the study into two guilds according to the nesting habitat (i.e., ground nesting vs. tree/shrub nesting birds). To test the hypothesis that wild boar may impact birds through food competition, birds were grouped into two guilds according to ground dependence for foraging and gleaning (i.e., ground foraging vs. tree foraging birds). Ground nesting birds were separated from ground foraging and tree foraging guilds to avoid potential overlap of effects (i.e., predation and food competition). Location of the nest-site were taken from literature (Gregory et al., 2007; Flitti et al., 2009) and our own observations (See Table S1). Four indicators were derived: an indicator for ground nesting birds (GN, n=201 birds), and an indicator for tree nesting birds (TN, n=339 birds), an indicator for ground foraging birds (GF, n=234 birds) and an indicator for tree foraging birds (TF, n=105 birds).
At the bird community level, we used species diversity as bird community indicator. Species diversity was calculated using the Shannon index. The Shannon index reflects the number of different species in a community and simultaneously takes into account how evenly the individuals are distributed among those species (Lyashevska & Farnsworth, 2012).
2.4 Vegetation data
This study measured the effect of wild boar on birds, controlling for vegetation characteristics (shrub density, time since last clear-cut). Vegetation data were collected during spring 2012, after each bird count session. Measurements were taken at three sampling areas at each point-count station, thus resulting in 78 sampling points. One was located at the point- count station itself, the other two at random distances from the station (<50m). Mean values were calculated for each variables listed. Shrub layer density of vegetation layer (0-1m) was estimated using a pole graduated into 10cm sections and using a protocol adapted from Holt et al. (2011). The number of sections obscured by vegetation was recorded when viewed from a distance of 10m. An index of shrub density (S, a continuous variable) was derived using the number of segments obscured/10 segments, from 0 to 1. We used these scores to define two classes of shrub layer density: values equal or smaller than 0,5 were considered as "low density" (S-), those equal or greater than 0,6 as "high density" (S+); this two level factor was used for GLM analysis (see below, statistics section). As avian community structure is largely determined by the growth stage and associated structural characteristics of vegetation (Fuller et al., 1989), vegetation age was controlled in each plot, using local forest management archives. Time since last clear-cut (Cut) was used as a continuous variable for statistical purpose (see below, statistics section).
As cervids are known to have an impact on birds (see Allombert et al., 2005b; Holt et al., 2011; Martin et al., 2011), signs of browsing were carefully searched in each sampling area. We considered only shrub species or woody plants because we could not, with herbaceous species, distinguish deer browsing from that of lagomorphs present in the study area. We recorded the browsing pressure by assessing the number of eaten twigs versus all available twigs at a height <1.80 m, following a methodology similar to those described elsewhere (Picard, 1988; Chevrier et
al., 2012). A “browsing sign” is one bite by the animal on the tree, being evident as a fresh cut on
the twigs. As the browsing pressure was <1% in all the sampled plots, the cervids impact on the avifauna was considered negligible in this study. All the assessments were done by the same person (FR). 352 353 354 355 356 357 358 359 360 361 362 363 364 365 366 367 368 369 370 371 372 373 374 375 376 377 378 379 380 381 382 383 384 385 386 387 388 389 390 391 392 393 394 395 396 397 398 399 400 401 402
Table S1
Classification of species in relation to foraging and nesting dependence
Species acronym Species name Ground or Tree/shrub dependence
Migration strategy Nesting Foraging
(a) Species
Cya cae (n=55) Eurasian Blue Tit (Cyanistes
caeruleus)
Tree/shrub Tree/shrub Partial migrant
Eri rub (n=69) Robin (Erithacus rubecula) Ground Ground Partial migrant
Fri coe (n=111) Common Chaffinch (Fringilla coelebs)
Tree/shrub Ground Partial migrant
Lus meg (n=51) Nightingale (Luscinia
megarhynchos)
Ground Ground Long migrant
Par maj (n=50) Great Tit (Parus major) Tree/shrub Tree/shrub Partial migrant
Phy bon (n=81) Western Bonelli's Warbler
(Phylloscopus bonelli) Ground Tree/shrub Long migrant
Syl atr (n=43) Eurasian Blackcap (Sylvia
atricapilla)
Tree/shrub Ground Partial migrant
Syl mel (n=26) Sardinian Warbler (Sylvia
melanocephala)
Tree/shrub Ground Partial migrant
Tur mer (n=34) Blackbird (Turdus merula) Tree/shrub Ground Partial migrant
(b) Guilds Species name
Ground Nesting (GN, n=201)
Common Nightingale; Robin; Western Bonelli's warbler
Tree Nesting (TN,
n=339) Blackbird; Common Chaffinch; Great Tit; Eurasian Blackcap; Eurasian Blue Tit; Sardinian warbler
Ground Foraging (GF, n=234)
Blackbird; Common Chaffinch; Eurasian Blackcap; Sardinian warbler
Tree Foraging (TF, n=105)
Great Tit; Eurasian Blue Tit 404 405 406 407 408 409 410 411 412 413 414 415 416 417 418 419 420
2.5 Statistics
We tested for the effects of 1) wild boar foraging (Ikf), 2) shrub cover (S), 3) timing of spot-counts (Tim) and 4) time since last clear-cut (Cut) (the factors of variation) on birds abundances, and species diversity (the dependent variables) using general linear models (GLM). For the count data (bird abundances), each model was tested assuming normal (Gaussian) and Poisson error. We selected the best model using the Akaike Information Criterion (AIC). However, when the AIC of two competing models differed by less than 2, we examined the residual sum of squares and retained the simplest model in line with the rules of parsimony. We checked for the homoscedasticity and normality assumptions of residuals. Raw data were not transformed, and real birds counts were used throughout the paper. Timing of spot-count was entered as a two-level factor (early vs. late) in all the models. Wild boar foraging and shrub cover were entered as a two-level factors (Ikf- vs. Ikf+; and S- vs. S+, respectively) to investigate potential interactions between factors. Entering wild boar foraging and shrub cover as continuous covariates led to the same conclusions. Time since last clear-cut was entered as a continuous covariate (Cut) in all models. Birds were grouped in functional guilds (See Table S1). We fitted several models including interactive effects of Ikf, S, Tim and Cut. As a control of potential bias in our study, we tested the effects of 1) S and 2) Tim (the factors of variation) on Ikf (the dependent variable) using GLM. Statistical evaluation was carried out with the “Statistica” software using the functions “GLM” (normal error) or “GLZ” (poisson error). Best results were obtained assuming normal error.
Nine bird species that were at least observed in one third of point-counts, were included in statistical analysis. All results are expressed as mean ± SEM. Differences were considered significant at P < .05.
3. Results
3.1 General results
Wild boar foraging traces were observed in all surveyed transects. Maximum value of wild boar indicator of kilometric foraging (Ikf) was of 1 with a high mean value of 0,60 ± 0,03, indicating a relatively strong pressure of wild boar foraging in the study area considered as a whole. Twenty-five spot-counts showed few wild boar traces (Ikf-), and 27 showed many traces (Ikf+, see methods section). GLM analysis showed no relationships between Ikf and timing of spot-counts (Tim) or shrub cover (S) (Adjusted R²=0,02; F=1,31; p=0,28). We analyzed the abundances of 9 bird species and 520 individuals (Table S1). Counts led to an average of 3,9 ± 0,3 SE ground nesting birds (range 0-8); 6,5 ± 0,3 SE tree nesting birds (range 3-13); 4,5 ± 0,3 SE ground foraging birds (range 1-9); and 2,0 ± 0,2 SE tree foraging birds per spot (range 0-7).
3.2 Wild boar impact on birds
We tested the effects of Ikf, Tim, S and Cut on the abundance of ground nesting birds. Abundances of TN, GF and TF birds were also tested as supplementary variables. The best model included the variables Ikf, S and Tim; Cut, TN, GF and TF were rejected as explanatory variables (Table 1). The observed changes were well explained by the GLM and were very statistically significant (Adjusted R²=0,70; F=17,89; p<10-6). We found that the abundance values of GN birds were
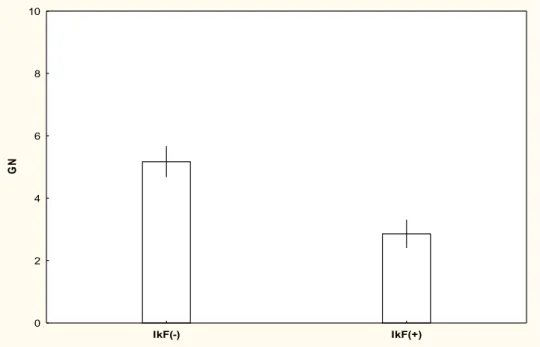
negatively correlated with Ikf (Figure 1a). Entering IkF as a two-level factor showed that there was a significant decrease of 44.7% in ground nesting birds abundances in areas strongly foraged by wild boars (Figure S2). GLM revealed the role of Ikf as being the main factor driving bird abundance changes, and Tim and S as being secondary factors, in this order (Table 2). Test of categorical variables interactions as explanatory variables were not significant (Table 2). The effect of Tim showed that birds were more numerous in late spring. We observed that the negative effect of wild boars on birds abundances was slightly greater in early spot-counts than late, but this result 421 422 423 424 425 426 427 428 429 430 431 432 433 434 435 436 437 438 439 440 441 442 443 444 445 446 447 448 449 450 451 452 453 454 455 456 457 458 459 460 461 462 463 464 465 466 467 468 469 470 471
Figure 1: Variations of forest bird mean abundances in relation to wild boar foraging (Ikf).
Predicted trends are presented as black lines with 95% confidence intervals (dashed lines).
Bars indicate the standard error of mean. (a) ground nesting (GN) birds (b) tree nesting (TN) birds (c) ground foraging (GF) birds (d) tree foraging (TF) birds.
a
b
a
c
d
Mean ±SE 0,2 0,3 0,4 0,5 0,6 0,7 0,8 0,9 1,0 Ikf 0 2 4 6 8 10 G N Mean ±SE 0,2 0,3 0,4 0,5 0,6 0,7 0,8 0,9 1,0 Ikf 0 2 4 6 8 10 T N Mean ±SE 0,2 0,3 0,4 0,5 0,6 0,7 0,8 0,9 1,0 Ikf 0 2 4 6 8 10 Mean ±SE 0,2 0,3 0,4 0,5 0,6 0,7 0,8 0,9 1,0 Ikf 0 2 4 6 8 10 473 474 475 476 477 478 479 480 481 482 483 484 485 486 487 488 489 490 491 492 493 494 495 496 497 498 499 500 501 502 503 504 505 506 507 508 509 510 511 512 513 514 515 516 517 518 519 520 521 522 523 524Table 1 : Candidate models explaining ground nesting birds abundance, with the Akaike
information criterion values (AIC) and the selected variables : wild boar foraging (Ikf), timing of spot-count (Tim), shrub density (S), time since last clear-cut (Cut), tree nesting birds abundance (TN), ground foraging birds abundance (GF), tree foraging birds abundances (TF). The interactions between wild boar foraging and timing (IkF*Tim), wild boar foraging and shrub density (IkF*S), wild boar foraging, timing and shrub density (IkF*Tim*S) were also tested, but gave higher scores of AIC(data not shown). Bold characters indicate the selected model.
Guild selected variables AIC SS
Ikf Tim S Cut TN GF TF Residual
Ground Nesting (GN) x x x x x x x 161.7 52.1 x x x 164.1 52.2 x x x x 165.1 51.8 x x 183.4 81.5 x x 187.9 83 x x 196.8 109.7 x 197.7 115.3 x 208.7 161.7 x 214.3 167.4 x 221.6 197.9 x 221.9 199.7 x 222.1 200.4 x 222 200.4 IkF(-) IkF(+) 0 2 4 6 8 10 G N
Figure S2: Mean abundances of ground nesting (GN) in relation to wild boar foraging. Ikf(-) areas
moderately foraged by wild boars; Ikf(+) areas strongly foraged by wild boars.
Lines indicate standard error of mean. Results are highly significant (p<10-6); see Table 2 and
statistical analysis. 526 527 528 529 530 531 532 533 534 535 536 537 538 539 540 541 542 543 544 545 546 547 548 549 550 551 552 553 554 555 556 557 558 559
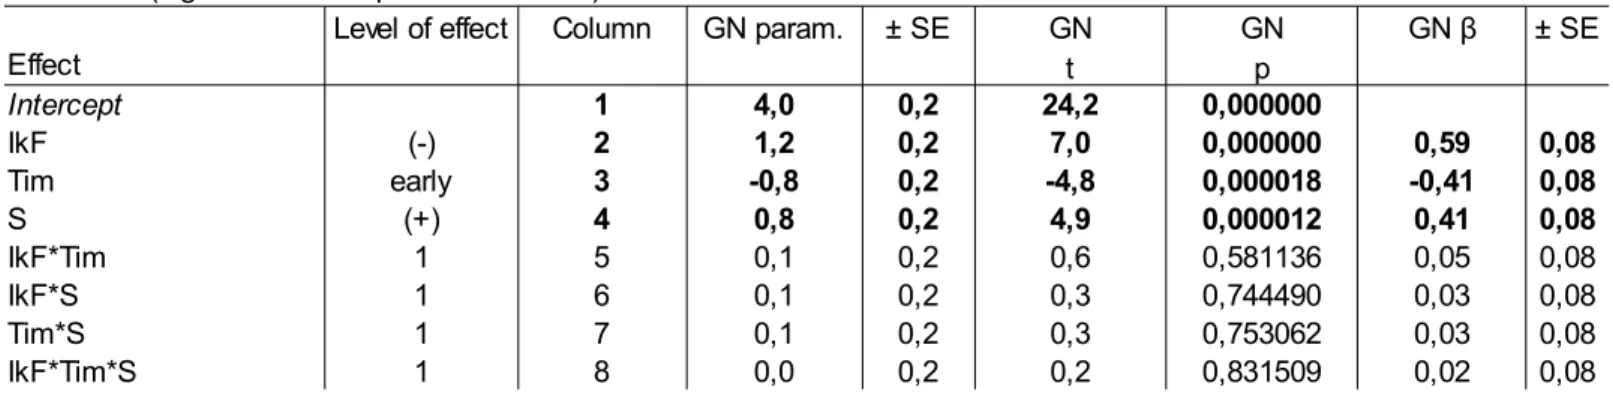
Table 2 : β coefficients and statistical parameters of the most parsimonious GLM model to explain
ground nesting (GN) birds abundance using wild boar foraging traces (Ikf), Timing (Tim) and shrub density (S) as predictors. Bold characters indicate statistically significant results.
Estimates (sigma-restricted parameterization) Effect
Level of effect Column GN param. GN GN ± SE
t p Intercept 1 4,0 0,2 24,2 0,000000 IkF (-) 2 1,2 0,2 7,0 0,000000 0,59 0,08 Tim early 3 -0,8 0,2 -4,8 0,000018 -0,41 0,08 S (+) 4 0,8 0,2 4,9 0,000012 0,41 0,08 IkF*Tim 1 5 0,1 0,2 0,6 0,581136 0,05 0,08 IkF*S 1 6 0,1 0,2 0,3 0,744490 0,03 0,08 Tim*S 1 7 0,1 0,2 0,3 0,753062 0,03 0,08 IkF*Tim*S 1 8 0,0 0,2 0,2 0,831509 0,02 0,08 ± SE GN β
Figure S3: mean abundances of ground nesting (GN) in relation to wild boar foraging and shrub density.
IkF(-) areas moderately foraged by wild boars;
IkF(+) areas strongly foraged by wild boars. Black filled circles indicate areas with high density of shrubs; Open grey squares indicates areas with light shrub density. Lines indicate standard error of mean.
Results are highly significant (p<10-6); see Table 2 and statistical analysis.
IkF(-) IkF(+) 0 2 4 6 8 10 G N 561 562 563 565 566 567 568 569 570 571 572 573 574 575 576 577 578 579 580 581 582 583 584 585 586 587 588 589 590 591 592 593 594 595 596 597 598 599 600 601
was not statistically significant. Shrub cover was positively correlated to ground nesting birds abundances. The negative effect of Ikf on birds abundances was marginally greater in S- than in S+ areas, but this result was not statistically significant (Figure S3). Mean values of GN birds in relation to hypothesis decomposition are summarized in Table S2.
Table S2
Mean values of GN birds in relation to hypothesis decomposition.
Table S3
Model selection for TN, GF and TF birds
When two models had similar AIC and SS Residual scores, the most parsimonious model was chosen (see methods).
Abundances of GN birds and hypothesis decomposition
Cell number IkF Tim S GN GN GN -95% GN +95% N
means ± SE conf. Int. conf. Int.
1 (-) early (+) 5,4 0,4 4,6 6,3 7 2 (-) early (-) 3,5 0,5 2,4 4,6 4 3 (-) late (+) 6,7 0,6 5,4 7,9 3 4 (-) late (-) 5,1 0,3 4,4 5,8 11 5 (+) early (+) 2,8 0,5 1,7 3,8 4 6 (+) early (-) 1,2 0,3 0,5 1,8 11 7 (+) late (+) 4,5 0,4 3,6 5,4 6 8 (+) late (-) 3,0 0,4 2,1 3,9 6
Guild selected variables AIC SS
Ikf Tim S Cut Tim*S Ikf*Tim*S Residual
Tree Nesting (TN) x x 220.9 225.5 x 223.6 273.8 x 222.9 269.3 x 223.4 272.4 x 223.7 274.4 Ground Foraging (GF) x x 215.3 158.2 x 215.8 171.6 x 217.5 179.4 x 218.7 184.9 x 218.7 184.9 x 218.7 185 Tree Foraging (TF) x x x 169.5 77.9 x x 169.2 82.7 x 169.6 91 x 173.5 98.6 x 174.8 101.2 x 175.3 102.4 602 603 604 605 606 607 608 609 610 611 613 614 615 616 617 618 619 620 622
We tested the effects of Ikf, Tim, S and Cut on the other guilds. Results of model selection are summarized in Table S3. By contrast to ground nesting birds, abundances of birds belonging to tree nesting (Figure 1b) or ground foraging (Figure 1c) guilds were not well explained by IkF or the other studied variables; the observed changes were not statistically significant (Adjusted R²=0,05; F=1,4; p=0,24; Adjusted R²=0,01; and F=1,1; p=0,40, respectively). The best model describing the tree foraging birds abundances included Ikf and Tim as explanatory variables (Table S3), but the observed changes were barely significant (Adjusted R²=0,12; F=2,0; p=0,07). However, we noted that tree foraging birds slightly tended to be more numerous in areas strongly foraged by wild boars, a not significant result (Figure 1d).
We then tested the effects of Ikf, Tim, S and Cut on bird species diversity. The best model describing species diversity included the variables Tim, IkF*S, Tim*S; Cut was rejected as an explanatory variable (Table S4). The observed changes in species diversity were statistically significant (Adjusted R²=0,33; F=4.6; p<10-3). We found that the main factor affecting bird species
diversity was the interaction of IkF*S (Figure 2, Table S5).
The present data indicate that, in accordance with H1, GN birds were less abundant in areas strongly foraged by wild boars (Figure 1a). Thus, in accordance with H2, TN birds abundance was not affected by wild boar foraging (Figure 1b). In addition, GF birds abundance was not correlated to wild boar foraging (H3, Figure 1c).
Figure 2: Variations of bird species diversity (Shannon) in relation to wild boar foraging (Ikf)
and shrub density.
Predicted trends are presented as black lines with 95% confidence intervals (dashed lines). Bars indicate the standard error +mean. (a) bird species diversity in areas with low shrub cover. (b) bird species diversity in areas with dense shrub cover.
Mean ±SE 0,2 0,3 0,4 0,5 0,6 0,7 0,8 0,9 1,0 I kf 0 1 2 3 S h a n n o n Mean ±SE 0,2 0,3 0,4 0,5 0,6 0,7 0,8 0,9 1,0 I kf 0 1 2 3 S h a n n o n
a
b
624 625 626 627 628 629 630 631 632 633 634 635 636 637 638 639 640 641 642 643 644 645 646 647 648 649 650 651 652 653 654 655 656 657 658 659 660 661 662 663 664 665 666 667 668 669 670 671 672 673 674 675Table S4
Model selection for species diversity
When two models had similar AIC and SS Residual scores, the most parsimonious model was chosen (see methods).
Table S5
β coefficients and statistical parameters of the most parsimonious GLM model to explain species diversity using wild boar foraging traces (IkF), Timing (Tim) and shrub density (S) as predictors
selected variables AIC SS
Ikf Tim S Cut Ikf*S Tim*S Residual
Species diversity x x x 20,7 3,5 x x x x x x 21,7 3,5 x x x 25,1 4,2 x x 25,3 3,5 x 28,3 4,4 x 30,3 5 x 31,2 4,2 x 32,6 5,3 x 38,1 5,9 x 38,6 6
Estimates (sigma-restricted parameterization) Effect
Level of effect Column Sp. div. Sp. div. Sp. div. ± SE
param. t p Intercept 1 1.7 0.0 38.49080 0.000000 Tim early 2 -0.1 0.0 -1.92837 0.060277 -0.24 0.13 S (+) 3 0.1 0.0 1.27066 0.210526 0.16 0.12 IkF (-) 4 0.1 0.0 1.33765 0.187885 0.17 0.13 Tim*S 1 5 0.1 0.0 1.91937 0.061437 0.24 0.13 Tim*IkF 1 6 0.0 0.0 0.63077 0.531456 0.08 0.13 S*IkF 1 7 -0.1 0.0 -2.34528 0.023587 -0.30 0.13 Tim*S*IkF 1 8 0.0 0.0 0.51398 0.609837 0.06 0.12 ± SE Sp. div. β 676 677 678 679 680 681 682 684 685 686 687 688 689 690 692 693 694 695 696 697 698 699 700 701 702
4. Discussion and conclusions
4.1. Wild boar foraging as an indicator of ecological change
Surprisingly, the use of foraging traces as an indicator of wild boar impact on ground nesting birds has never been tested until now (Massei & Genov, 2004; Ballari & Barrios-Garcia, 2012). We found that wild boar foraging traces provided a simple indicator of ground nesting birds abundance. Our results evidenced the usefulness of this method since it was highly correlated with GN birds abundances, but not with other avian guilds (tree nesting or ground foraging birds). The protocol described in this study has numerous advantages. First, the measurements do not depend on biological experts for birds species determination: in other words, anyone can perform an inventory of wild boar foraging traces. Wild boar foraging traces are easily spotted, and the probability of detection is likely constant among different observers using a standardized protocol. Second, wild boar foraging traces are rapidly measured; this may prove useful for monitoring programs designed to track annual changes of wild boar environmental impact on ground ecosystems at large spatial scales. Third, measuring wild boar foraging traces is less climate dependent than measuring bird abundances. Finally, the monitoring of wild boar impact on the avifauna do not requires the previous knowledge of wild boar population size.
Understanding and measuring the environmental impact of wild ungulates in forest ecosystems remains a challenge for researchers and wildlife managers. In practice, for management to succeed, clear goals are required and the success of their application must be evaluated (Morellet et al., 2007). The goal will often be a compromise such as maximising the revenue from hunting while minimising damage to forestry/biodiversity (Williams et al., 2002; Nichols & Williams, 2006). Wildlife population trends are often assessed by species counts; surveillance monitoring frequently requires several years to amass enough data to provide strong evidence of a decline in state before action is taken. Species sampling methods remain labor intensive and time-consuming, and may be subject to many biases (Kéry & Scmidt, 2008; Renwick et al., 2012). As a result, there is an increasing demand from policy makers to improve management by incorporating relevant indicators that are simple, reliable and rapidly assessed. By recording a set of IECs, the aim is to achieve management objectives, rather than exert a routine surveillance monitoring (Cederlund et al., 1998; Dale & Beyeler, 2001; Morellet et al., 2007). To manage wild ungulates, it is thus suggested to track over time the variations of at least three categories of indicators of ecological changes (Morellet et
al., 2007): one describing animal performance, another describing herbivore impact on
environment, and the last describing relative animal abundance.
As pointed by Dale and Beyeler (2001), the focus of ecological management programs becomes narrow by selecting only one or few indicators, and may lead to oversimplified understanding of the ecological interactions involved; the management of large ungulates is greatly improved by the recording of a set of indicators (Morellet et al., 2007). To avoid poorly informed management decisions, indicators should take into account multiple levels in the ecological network in order to effectively monitor the multiple levels of complexity of ecological systems (Dale & Beyeler, 2001; Niemeijer & de Groot, 2008). Thus, a key challenge is to find a mix of measures which give easily identified signals, can be used to track the ecological conditions at reasonable cost, and cover the spectrum of ecological variation. The monitoring of our indicator of wild boar foraging responds to these criteria; and thus managers dispose rapidly and easily of a diagnostic of wild boar potential environmental impact on avifauna. However, if management interventions are required (i.e., if the manager estimates that wild boar impact on ground nesting birds may conflict with conservation interests), the accuracy of management will be greatly improved by studies carried out to estimate wild boar population size and trends. As such tools of wild boar abundance do already exist, based on fecal drops (Acevedo et al., 2007), one goal of this study (to complete the set of indicators for wild boar management) was fulfilled. However, to be fully acknowledged as a new IEC, our 704 705 706 707 708 709 710 711 712 713 714 715 716 717 718 719 720 721 722 723 724 725 726 727 728 729 730 731 732 733 734 735 736 737 738 739 740 741 742 743 744 745 746 747 748 749 750 751 752 753 754 755
indicator should be ideally tested over a long period of time, in reference localities where true wild boar population size is known (Dale & Beyeler, 2001; Morellet et al., 2007). With a set of IECs, one can envisage an adaptive management program (as defined by Nichols & Williams, 2006) of wild boar game harvest compatible with bird conservation. The final step is then to set new hunting quotas with the aim of provoking an adjustment in the population-habitat system in order to approach the predefined goals. At least during the first years of monitoring, this is equivalent to a trial-and-error process or adaptive management (Nichols & Williams, 2006; Morellet et al., 2007).
4.2. Effects of wild boar foraging on birds abundance
To our knowledge, our study is the first to correlate bird abundances to an index based on the frequency of wild boar foraging traces. Our results showed a significant decrease of 44,7% in ground nesting birds abundances in areas strongly foraged by wild boars; in contrast, tree nesting birds (out of reach of large ungulates) were not affected by wild boar gleaning. This result was expected since ground nesting birds are highly impacted by other over-abundant ungulates (Allombert et al., 2005b; Holt et al., 2011), and wild boars are known to be highly opportunistic mammals that prey on anything near the ground: depredations on birds and nests (Saniga, 2002; Saniga, 2003; Schaefer, 2004; Giménez-Anaya et al., 2008; Carpio et al., 2014b), reptiles and amphibians (Jolley et al., 2010), small mammals (Lozano et al., 2007; Wilcox & van Vuren, 2009), and other fauna and flora communities are substantial (see for review Barrios-Garcia & Ballari, 2012). The general assumption that all clutches of birds that nest on the ground represented potential prey for wild boars is thus probably true. This predation effect may explain the observed changes in bird distribution, as predation risk is known to influence prey-birds use of space (Thomson et al., 2006; Cresswell, 2008). We noted a cross-effect of wild boar foraging and habitat on birds, i.e. the effects of wild boar foraging on species diversity were more important in areas with low shrub cover. Other studies pointed that the density of potential nests and predation rates is dependent on vegetation structure complexity and that foliage density near the nest may reduce predation impact (Martin et al., 1988; Chalfoun & Martin, 2009). In addition to resource competition, predation risk is an important factor determining spatial distribution of birds (Suhonen, 1993) and offspring success (Martin, 1996; Thomson et al., 2006; Chalfoun & Martin, 2007). Interestingly, GN birds abundances were influenced by the timing of spot-count. As two of three species composing the GN birds guild are long-migrant species, this result is not surprising. Further research is needed to investigate the potential interactions between migration strategy and wild boar impact, i.e., if long-migrant birds are more impacted than partial-migrants.
We then explored the hypothesis that wild boar may compete with ground foraging birds for food resource. Previous studies showed that wild boars negatively impacted rodents populations as a result of direct competition for seeds (Focardi et al., 2000) or legumes (Carpio et al., 2014a). Although wild boars are omnivorous and prey invertebrates, diet consist mainly of plant matter including above-ground green material (Fournier-Chambrillon et al., 1995; Baubet et al., 2004). The most obvious direct effect of rooting by wild boars is the reduction in plant cover (Singer et al., 1984; Massei & Genov, 2004). Surprisingly, ground gleaning birds in our study were not statistically affected by wild boar foraging. This strongly support the idea that wild boar mediated effects observed in this study resulted mainly from direct predation on birds and nests or increased predation risk, rather than food competition. In a remarkable long-term study, Wesolowski et al. (2009) showed that wood warblers abundance in Bialowieza forest was inversely correlated with small mammal predator densities and were only weakly correlated with caterpillar abundance; the nomadic behavior of wood warblers appears to be a consequence of their attempts to breed in safe places. Although most studies focused on the direct negative effects of wild ungulates on habitat alterations and invertebrate availability, large herbivores may affect many species of plants and animals through indirect effects (Suominen & Danell, 2006; Barrios-Garcia & Ballari, 2012). Large 756 757 758 759 760 761 762 763 764 765 766 767 768 769 770 771 772 773 774 775 776 777 778 779 780 781 782 783 784 785 786 787 788 789 790 791 792 793 794 795 796 797 798 799 800 801 802 803 804 805 806
positive effect being probably mediated by nutrient input through the ecosystem (Mathisen & Skarpe, 2011; Mathisen et al., 2012). This type of complex interaction may explain the observation in our study, that tree foraging birds showed light increases in areas strongly foraged by wild boars. However, one should note that ground nesting birds (Bonelli's warbler, that are also tree foraging birds) were subtracted from this guild. As a result, this guild of “tree foraging birds” consisted of only two species, which require a careful interpretation. Future research is thus needed to better understand these mechanisms or confirm this result.
As final words, none of the birds species observed in this study are listed as threatened species; however wild birds trends are commonly used as indicators of environmental health and biodiversity (Gregory & van Strien, 2010). As common bird species shape the ecosystems, even relatively small declines in their ranks can disrupt ecosystem structure (Gaston & Fuller, 2008); as a consequence, monitoring bird indicators may give understanding on other taxas. Numerous studies underlined the decline of common palearctic birds in Western Europe (Birdlife international, 2004; Gregory & van Strien, 2010; EBCC, 2015). Recently, Gregory et al. (2007) showed that birds nesting on the ground or in low vegetation declined more than those nesting higher up in shrubs and trees. Species trends at the European scale are thus more significantly correlated to nest-type (tree/shrub vs. ground/low vegetation) than to other ecological factors (migration, diet, region), a report that is true for both farmlands and forest birds. It is also suggested that predation may be an important factor influencing bird species trends in Europe (Fuller et al., 2007b; Gregory et al., 2007). Despite these reports, there are actually few managing programs that monitor the potential impacts of wild boar at large scales. As wild boar populations will continue to grow in Europe (Massei et al., 2015), the development and use of new impact indicators may be critical for future bird and environmental management.
808 809 810 811 812 813 814 815 816 817 818 819 820 821 822 823 824 825 826 827 828 829 830 831 832 833 834 835 836 837 838 839 840 841 842 843 844 845 846 847 848 849 850 851 852 853 854 855
References
Acevedo, P., Vicente, J., Höfle, U., Cassinello, J., Ruiz-Fons, F., &Gortazar, C. (2007). Estimation of European wild boar relative abundance and aggregation: a novel method in epidemiological risk assessment. Epidemiology and Infection, 135 (03), 519.
Allombert, S., Stockton, S., & Martin, J. (2005a). A natural experiment on the impact of over-abundant deer on forest invertebrates. Conservation Biology, 19(6), 1917-1929.
Allombert, S., Gaston, A., & Martin, J. (2005b). A natural experiment on the impact of over-abundant deer on songbird populations. Biological Conservation, 126(1), 1-13.
Barrios-Garcia, M., & Ballari, S (2012). Impact of wild boar (Sus scrofa) in its introduced and native range: a review. Biological Invasions, 14, 2283-2300.
Baubet, E., Bonenfant, C., & Brandt, S (2004). Diet of the wild boar in the French Alps. Galemys, 16, 101-113.
Birdlife International (2004). State of the world's birds 2004: indicators for our changing world. Cambridge, UK: BirdLife International.
Blondel, J., Ferry, C., & Frochot, B. (1970). La méthode des indices ponctuels d'abondances (IPA) ou des relevés d'avifaune par stations d'écoutes. Alauda, 38, 55-71.
Bonthoux, S., & Balent, G. (2012). Point count duration: five minutes are usually sufficient to model the distribution of bird species and to study the structure of communities for a French landscape. Journal of Ornithology, 153 (2), 491-504.
Bourcet J., Bracque P., De Nonancourt P., Sapor C., 2003. Evaluation des risques liés à
l'augmentation des densités des sangliers sauvages en France. Inspection générale de
l'environnement, rapports publics. Available online at: www.ladocumentationfrançaise.fr.
Brandt, S., Baubet, E., Vassant, J., & Servanty, S (2006). Régime alimentaire du sanglier en milieu forestier de plaine agricole. Faune Sauvage, 273, 20-27.
Bratton, S (1975). The effect of the European wild boar, Sus scrofa, on gray beech forest in the Great Smoky Mountains. Ecology, 56 (6), 1356-1366.
Buckland, S., Goudie, I., & Borchers, D (2000). Wildlife population assessment: past developments and future directions. Biometrics, 56 (1), 1-12.
Carpio, A., Guerrero-Casado, J., Ruiz-Aizpurua, L., Vicente, J., & Tortosa, F. S. (2014a). The high abundance of wild ungulates in a mediterranean region: is this compatible with the European rabbit. Wildlife Biology , 20, 161-166.
Carpio, A., Guerrero-Casado, J., Tortosa, F. S & Vicente, J. (2014b). Predation of simulated red-legged partridge nests in big game estates from south central spain. European Journal of Wildlife Research, 60(2), 391-394.
Cederlund, G., Duncan, P., Bergqvist, J., Kjellander, P., er, Gill, R., Gaillard, J.M., Boiseaubert, B., Ballon, P., & Duncan, P. (1998). Managing roe deer and their impact on the environment:
856 857 858 859 860 861 862 863 864 865 866 867 868 869 870 871 872 874 875 876 877 878 879 880 881 882 883 884 885 886 887 888 889 890 891 892 893 894 895 896 897 898 899 900 901 902 903 904 905 906
Chalfoun, A. D., & Martin, T. E. (2009). Habitat structure mediates predation risk for sedentary prey: experimental tests of alternative hypotheses. Journal of Animal Ecology, 78(3), 497-503. Chalfoun, A., & Martin, T. (2007). Assessments of habitat preferences and quality depend on spatial scale and metrics of fitness. Journal of Applied Ecology, 44, 983-992.
Chamberlain, & Fuller, R. (2000). Local extinctions and changes in species richness of lowland farmland birds in England and Wales in relation to recent changes in agricultural land-use. Agriculture, Ecosystems & Environment, 78, 1-17.
Chamberlain, Fuller, R., & Bunce, R. (2000). Changes in the abundance of farmland birds in relation to the timing of agricultural intensification in England and Wales. Journal of Applied Ecology, 37, 771-788.
Chevrier, T., Said, S., Widmer, O., Hamard, J., Saint-Andrieux, C., & Gaillard, J (2012). The oak browsing index correlates linearly with roe deer density: a new indicator for deer management European Journal Of Wildlife Research, 58(1), 17-22.
Côté, S., Rooney, T., Tremblay, J., &Dussault, C. (2004). Ecological impacts of deer over-abundance. Annual Review of Ecology, Evolution & Systematics, 35, 113-147.
Cresswell, W. (2008). Non-lethal effects of predation in birds. Ibis, 150 (1), 3-17.
Dale, V., & Beyeler, S (2001). Challenges in the development and use of ecological indicators. Ecological Indicators, 1, 3-10.
Dettmers, R., Da Buehler, Bartlett, J., & Klaus, N. (1999). Influence of point count length and repeated visits on habitat model performance. The Journal of Wildlife, 63(3), 815-823.
Dolman, P., & Wäber, K. (2008). Ecosystem and competition impacts of introduced deer. Wildlife Research, 35(3), 202-214.
Drapeau, P., Leduc, A., & McNeil, R. (1999). Refining the use of point counts at the scale of individual points in studies of bird-habitat relationships. Journal of Avian Biology, 30 (4), 367-382. EBCC (European Bird Census Council). European wild birds indicators, 2015 update.
www.ebcc.info/trends2015.html
Flitti, A., Kayser, Y., Kabouche, B., &Olioso, G. (2009). Atlas des oiseaux nicheurs de Provence-Alpes-Côte d'Azur, Delachaux et Niestlé.
Flueck, W (2000). Population regulation in large northern herbivores: evolution, thermodynamics, and large predators. Zeitschrift Fuer Jagdwissenschaft, 46(3), 139-166.
Focardi, S., Capizzi, D., & Monetti, D. (2000). Competition for acorns among wild boar (Sus
scrofa) and small mammals in a Mediterranean woodland. Journal of Zoology, 250(03), 329-334.
Fournier-Chambrillon, C., Maillard, D., & Fournier, P. (1995). Diet of the wild boar (Sus scrofa L.) inhabiting the Montpellier garrigue. Ibex Journal of Mountain Ecology, 3, 174-179.
Fuller, R (2012). Avian responses to transitional habitats in temperate cultural landscapes: woodland 908 909 910 911 912 913 914 915 916 917 918 919 920 921 922 923 924 925 926 927 928 929 930 931 932 933 934 935 936 937 938 939 940 941 942 943 944 945 946 947 948 949 950 951 952 953 954 955 956 957 958 959
edges and young-growth. Birds And Habitat: Relationships In Changing Landscapes, Cambridge University Press, (chapter 5), 125-149.
Fuller, R., Stuttard, P., & Ray, C (1989). The distribution of breeding songbirds within mixed coppiced woodland in Kent, England, in relation to vegetation age and structure Annales Zoologici Fennici, 26, 265-275.
Fuller, R., & Gill, R. (2001). Ecological impacts of increasing numbers of deer in British woodland. Forestry, 74 (3), 193-199.
Fuller, R., Smith, K., Grice, P., Currie, F., & Quine, C. (2007a). Habitat change and woodland birds in Britain: implications for management and future research. Ibis, 149 (suppl. 2), 261-268.
Fuller, R., Gaston, K., & Quine, C. (2007b). Living on the edge: British and Irish woodland birds in a European context. Ibis, 149 (2), 53-63.
Gaston, K., & Fuller, R (2008). Commonness, population depletion and conservation biology. Trends In Ecology & Evolution, 23(1), 14-19.
Gill, R. M. A., & Beardall, V. (2001). The impact of deer on woodlands: the effects of browsing and seed dispersal on vegetation structure and composition. Forestry, 74 (3), 209-218.
Giménez-Anaya, A., Herrero, J., Rosell, C., Couto, S., & García-Serrano, A (2008). Food habits of wild boars (Sus Scrofa) in a mediterranean coastal wetland. Wetlands, 28(1), 197-203.
doi:10.1672/07-18.1
Gomez, J., Garcia, D., & Zamora, R. (2003). Impact of vertebrate acorn- and seedling-predators on a Mediterranean Quercus pyrenaica forest. Forest Ecology and Management, 180 (1-3), 125-134. Gregory, R. D., Willis, S. G., Jiguet, F., Voříšek, P., Klvaňová, A., van Strien, A., et al. (2009). An indicator of the impact of climatic change on European bird populations. Plos One, 4 (3), e4678. Gregory, R., & van Strien, A. (2010). Wild bird indicators: using composite population trends of birds as measures of environmental health. Ornithological Science, 9, 3-22.
Gregory, R., Vorisek, P., & Strien, A. (2007). Population trends of widespread woodland birds in Europe. Ibis, 149 (Suppl. 2), 78-97.
Hewson, C. M., Austin, G. E., Gough, S. J., & Fuller, R. J. (2011). Species-specific responses of woodland birds to stand-level habitat characteristics: The dual importance of forest structure and floristics. Forest Ecology and Management, 261 (7), 1224-1240.
Holt, C. A., Fuller, R. J., & Dolman, P. M. (2011). Breeding and post-breeding responses of
woodland birds to modification of habitat structure by deer. Biological Conservation, 144 (9), 2151-2162.
Howe, T. D., Singer, F. J., & Ackerman, B. B. (1981). Forage relationships of European wild boar invading northern hardwood forest. The Journal of Wildlife Management, 45 (3), 748-754.
Jiguet, F., Devictor, V., Julliard, R., & Couvet, D. (2012). French citizens monitoring ordinary birds provide tools for conservation and ecological sciences. Acta Oecologica, 44, 58-66.
960 961 962 963 964 965 966 967 968 969 970 971 972 973 974 975 976 977 978 979 980 981 982 983 984 985 986 987 988 989 990 991 992 993 994 995 996 997 998 999 1000 1001 1002 1003 1004 1005 1006 1007 1008 1009 1010
Jiguet, F., Gadot, A., Julliard, R., Newson, S. E., & Couvet, D. (2007). Climate envelope, life history traits and the resilience of birds facing global change. Global Change Biology, 13 (8), 1672-1684.
Jolley, D. B., Ditchkoff, S. S., Sparklin, B. D., Hanson, L. B., Mitchell, M. S., Gr, J. B., & Grand, J. B (2010). Estimate of herpetofauna depredation by a population of wild pigs. Journal Of
Mammalogy, 91(2), 519-524. doi:10.1644/09-MAMM-A-129.1
Joys, A. C., Fuller, R. J., & Dolman, P. M. (2004). Influences of deer browsing, coppice history, and standard trees on the growth and development of vegetation structure in coppiced woods in lowland England. Forest Ecology and Management, 202 (1-3), 23-37.
Julliard, R., Jiguet, F., & Couvet, D. (2004a). Common birds facing global changes: what makes a species at risk. Global Change Biology, 10 (1), 148-154.
Julliard, R., Jiguet, F., & Couvet, D. (2004b). Evidence for the impact of global warming on the long–term population dynamics of common birds. Proceedings of The Royal Society of London. Series B: Biological Sciences, 271 (Suppl 6), S490-S492.
Kéry, M., & Schmidt, B (2008). Imperfect detection and its consequences for monitoring for conservation. Community Ecology, 9(2), 207-216. doi:10.1556/ComEc.9.2008.2.10
Lyashevska, O., & Farnsworth, K (2012). How many dimensions of biodiversity do we need Ecological Indicators, 18, 485-492.
Lozano, J., Virgós, E., Cabezas-Díaz, S., & Mangas, J. G. (2007). Increase of large game species in Mediterranean areas: Is the European wildcat (Felis silvestris) facing a new threat. Biological Conservation, 138 (3-4), 321-329.
Martin, T. (1996). Fitness costs of resource overlap among coexisting bird species. Nature, 380, 338-340.
Martin, T. E. (1988). Habitat and Area Effects on Forest Bird Assemblages: Is Nest Predation An Influence. Ecology, 69 (1), 74.
Martin, T. G., Arcese, P., N, Scheerder, A., & Scheerder, N. (2011). Browsing down our natural heritage: Deer impacts on vegetation structure and songbird populations across an island archipelago. Biological Conservation, 144 (1), 459-469.
Massei, G., & Genov, P. (2004). The environmental impact of wild boar. Galemys, 16, 135-145. Massei G., Kindberg J., Licoppe A., Gacic D., Sprem N., Kamler J., Hohmann U., Monaco A., Ozolins J., Cellina S., Podgorski T., Fonseca C., Markov N., Pokorny B., Rosell C., Nahlik A., (2015). Wild boar populations up, numbers of hunters down? A review of trends and implications for Europe. Pest Management Science, 71(4), 492-500.
Mathisen, K., & Skarpe, C (2011). Cascading effects of moose (Alces alces) management on birds. Ecological Research, 26(3), 563-574.
Mathisen, K. M., Pedersen, S., Nilsen, E. B., & Skarpe, C (2012). Contrasting responses of two passerine bird species to moose browsing. European Journal Of Wildlife Research, 58(3), 535-547. doi:10.1007/s10344-011-0601-3 1012 1013 1014 1015 1016 1017 1018 1019 1020 1021 1022 1023 1024 1025 1026 1027 1028 1029 1030 1031 1032 1033 1034 1035 1036 1037 1038 1039 1040 1041 1042 1043 1044 1045 1046 1047 1048 1049 1050 1051 1052 1053 1054 1055 1056 1057 1058 1059 1060 1061 1062 1063
McShea, W., & Rappole, J. (2000). Managing the Abundance and Diversity of Breeding Bird Populations through Manipulation of Deer Populations. Conservation Biology, 14 (4), 1161-1170. Météo France, 2015. French national meteorogical service (period 1981-2010). Available from http://www.meteofrance.com (accessed december 2015).
Milner, J., Bonenfant, C., Mysterud, A., Gaillard, J., Csanyi, S., & Stenseth, N. (2006). Temporal and spatial development of red deer harvesting in Europe: biological and cultural factors. Journal of Applied Ecology, 43, 721-734.
Morellet, N., Gaillard, J., Hewison, A., Ballon, P., Boscardin, Y., Duncan, P., Klein, F. & Maillard, D. (2007). Indicators of ecological change: new tools for managing populations of large herbivores. Journal Of Applied, 44, 634-643.
Mysterud, A (2006). The concept of overgrazing and its role in management of large herbivores. Wildlife Biology, 12(2), 129-141.
Nichols, J., & Williams, B (2006). Monitoring for conservation. Trends In Ecology & Evolution, 21(12), 668-673.
Niemeijer, D., & de Groot, R (2008). A conceptual framework for selecting environmental indicator sets. Ecological Indicators, 8(1), 14-25.
ONF (Office National des Forêts).(2013). Colloque ONF des 27-28 mai à Velaine. Rendez-Vous Techniques de ONF, 41-42.
Picard, J (1988). Evaluation de la charge en gibier par analyse floristique. Revue Forestière Française, numéro spécial, Fascicule Thématique« Diagnostics En Forêt . DOI :
10.4267/2042/25938
Quine, C., Fuller, R., Smith, K., & Grice, P. (2007). Stand management: a threat or opportunity for birds in British woodland Ibis, 149 (2), 161-174.
Rawinski, T., & Square, N. (2008). Impacts of white-tailed deer over-abundance in forest ecosystems: an overview. US Department of Agriculture, Forest Service. Available online at: http://www.na.fs.fed.us/fhp/special_interests/white_tailed_deer.pdf
Renwick, A., Johnston, A., Joys, A., Newson, S., Noble, D., & Pearce-Higgins, J (2012). Composite bird indicators robust to variation in species selection and habitat specificity. Ecological Indicators, 18, 200-207.
Ries, L., & Sisk, T. (2004). A predictive model of edge effects. Ecology, 85 (11), 2917-2926. Saint-Andrieux, C., Barboiron, A., Corti, R., & Guibert, B. (2012). La progression des grands ongulés en France: bilan et conséquences. Faune Sauvage, 294, 10-17.
Saniga, M. (2002). Nest loss and chick mortality in capercaillie (Tetrao urogallus) and hazel grouse (Bonasa bonasia) in West Carpathians. Folia Zoologica, 51(3), 205-214.
Saniga, M. (2003). Ecology of the capercaillie (Tetrao urogallus) and forest management in relation 1064 1065 1066 1067 1068 1069 1070 1071 1072 1073 1074 1075 1076 1077 1078 1079 1080 1081 1082 1083 1084 1085 1086 1087 1088 1089 1090 1091 1092 1093 1094 1095 1096 1097 1098 1099 1100 1101 1102 1103 1104 1105 1106 1107 1108 1109 1110 1111 1112 1113 1114
Schaefer, T. (2004). Video monitoring of shrub-nests reveals nest predators: Jays are the most common predators, but carnivorous mammals and some other species also predate nests. Bird Study, 51 (2), 170-177.
Schley, L., & Roper, T. J. (2003). Diet of wild boar Sus scrofa in Western Europe, with particular reference to consumption of agricultural crops. Mammal Review, 33 (1), 43-56.
Servanty, S., Gaillard, J., Toigo, C., Brandt, S., & Baubet, E (2009). Pulsed resources and climate‐ induced variation in the reproductive traits of wild boar under high hunting pressure. Journal Of Animal Ecology, 78, 1278-1290.
Singer, F., Swank, W., & Clebsch, E (1984). Effects of wild pig rooting in a deciduous forest. The Journal Of Wildlife Management, 48(2), 464-473.
Stockton, S., Allombert, S., Gaston, A., & Martin, J. (2005). A natural experiment on the effects of high deer densities on the native flora of coastal temperate rain forests. Biological Conservation, 126 (1), 118-128.
Suhonen, J. (1993). Predation Risk Influences the Use of Foraging Sites by Tits. Ecology, 74 (4), 1197-1203.
Suominen, O., & Danell, K. (2006). Effects of large herbivores on other fauna. In: Large Herbivore Ecology, Ecosystem Dynamics and Conservation. Conservation Biology series-cambridge, 11, 383-412.
Thomas, L., Buckl, S., Buckland, S., Rexstad, E., Laake, J., Strindberg, S., Hedley, S.L., Bishop, J.R.B., Marques, T.A. & Burnham, K.P. (2010). Distance software: design and analysis of distance sampling surveys for estimating population size. Journal Of Applied Ecology, 47, 5-14.
Thomson, R. L., Forsman, J. T., Sardà‐Palomera, F., & Mönkkönen, M. (2006). Fear factor: prey habitat selection and its consequences in a predation risk landscape. Ecography, 29 (4), 507-514. Vignon, V., & Barbareau, H (2008). Collisions entre véhicules et ongulés sauvages: quel coût économique. Faune Sauvage, 279, 31-35.
Voříšek, P., Jiguet, F., & van Strien, A (2010). Trends in abundance and biomass of widespread European farmland birds: how much have we lost. BOU proceedings. Farmland Birds III. Available online at: http://www.bou.org.uk/bouproc net/lfb3/vorisek etal.pdf‐ ‐
Wesolowski, T., Rowinski, P., &Maziarz, M. (2009). Wood Warbler Phylloscopus sibilatrix: a nomadic insectivore in search of safe breeding grounds. Bird Study, 56 (1), 26-33.
Wilcox, J., & van Vuren, D (2009). Wild pigs as predators in oak woodlands of California. Journal Of Mammalogy, 90(1), 114-118.
Williams, B. K., Nichols, J. D., & Conroy, M. J (2002). Analysis and management of animal populations. Academic Press.
1116 1117 1118 1119 1120 1121 1122 1123 1124 1125 1126 1127 1128 1129 1130 1131 1132 1133 1134 1135 1136 1137 1138 1139 1140 1141 1142 1143 1144 1145 1146 1147 1148 1149 1150 1151 1152 1153 1154 1155 1156 1157 1158 1159 1160 1161 1162 1163 1164 1165 1166