Original Article
Zeb1 expression by tumor or stromal cells is
associated with spatial distribution patterns of
CD8+ tumor-infiltrating lymphocytes: a hypothesis-
generating study on 113 triple negative breast cancers
Mona Ouled Dhaou1, Myriam Kossai1, Anne-Pierre Morel2, Mojgan Devouassoux-Shisheboran3, Alain Puisieux2,4, Frederique Penault-Llorca1*, Nina Radosevic-Robin1*
1University Clermont Auvergne, INSERM U1240, Centre Jean Perrin, Clermont-Ferrand, France; 2University Claude
Bernard Lyon 1, INSERM 1052, CNRS 5286, Centre Leon Berard, Cancer Research Center of Lyon, Lyon, France;
3Hopital de la Croix-Rousse, Department of Pathology, Lyon, France; 4Institut Curie, Paris, France. *Equal
contribu-tors.
Received July 19, 2020; Accepted September 8, 2020; Epub October 1, 2020; Published October 15, 2020 Abstract: Spatial organization of tumor microenvironment (TME) may influence tumor response to immunomodula-tory therapies. Zeb1 is a driver of epithelial-mesenchymal transition, with several roles in immune cell development, however its role in shaping of the immune TME is not fully explored. We conducted a pre-multiplex spatial analysis study to verify whether Zeb1 influences spatial distribution of tumor-infiltrating lymphocytes (TILs) in triple nega-tive breast cancer (TNBC). We applied single and double immunohistochemistry to analyze spatial relationships between CD8+, FoxP3+ and CD20+ tumor-infiltrating lymphocytes (TILs) and the cells expressing Zeb1 in formalin-fixed, paraffin-embedded surgical specimens of 113 TNBCs. 15.5% of cases had Zeb1+ tumor cells and 72.8% of cases had stroma rich in Zeb1+ cells. Low density of intratumoral CD8+ TILs was observed in almost all TNBCs with high or moderate Zeb1+ expression in tumor cells (22/23 cases, 95.6%), and in 90.4% of TNBCs (75/83 cases) with stroma rich in Zeb1+ cells. On the other side, a majority of TNBCs with stroma rich in Zeb1+ cells had high den-sity of stromal CD8+ TILs (55/83 cases, 66.3%). These associations were not observed between Zeb1-expressing cells and FoxP3+ or CD20+ TILs. This in situ analysis showed specific spatial relationship between tumor or stromal Zeb1+ cells and CD8+ TILs, which need to be validated in other cohorts. Zeb1 was highlighted both as a marker of tumor cell EMT and of tumor stroma richness in mesenchymal cells. Several hypotheses about causes of the observed relationship between Zeb1 and TILs are generated and the approaches to verify them discussed. Zeb1 is worth further investigation as a potential biomarker of intratumor immunosuppression of TNBC and of its response to immunotherapies.
Keywords: Zeb1, triple negative breast cancer, lymphocytes, spatial, immunotherapy
Introduction
Epithelial-mesenchymal transition (EMT) is an embryonic developmental program which ensures proper tissue and organ formation [1]. In cancer, EMT is a crucial driver of metastasis [2]. The EMT program, governed by transcrip-tion factors Zeb1/2, Slug/Snail and Twist, oper-ates in malignant tumors because of several reasons. The neoplasm may be initiated by the cells naturally in EMT, such as in claudin-low breast cancers [3]. More frequently, the EMT program becomes activated after cancer
initia-tion, to promote local tumor invasion, intravasa-tion and systemic spread during metastatic pro-gression [4].
A growing body of evidence indicates a close relationship between tumor cell EMT and tumor microenvironment [5-7]. EMT induction may trigger immunosuppressive mechanisms based on activation of the regulatory T-lymphocytes or inhibition of the dendritic cells [8]. At another side, inflammation has been shown to be the most important external EMT inducer and driv-er of cancdriv-er progression [9]. Various
inflamma-tory cytokines, such interleukin 6 or TNFalpha, can activate the EMT program through regula-tion of expression or stability of the EMT-driving transcription factors [5]. However, how EMT shapes tumor microenvironment and vice versa is still not fully explored.
Therapeutic approaches which increase the immune response against cancer, known as immunotherapies, represent a new paradigm in cancer treatment [10]. These treatment modal-ities offer some patients a significant prolonga-tion of survival. Unfortunately, many patients are not responsive to immunotherapies, or become resistant after an initial good response [11]. As immunomodulators are expensive and can have adverse effects, it is of utmost impor-tance to know all the mechanisms and indica-tors of cancer response to those drugs [12]. We reported in earlier work that a subclass of breast cancers with high Zeb1 expression is characterized by low frequency of TP53 muta-tions and low chromosomal instability [13]. These rare cancers, mostly belonging to the metaplastic triple negative subtype, are initiat-ed by mammary stem cells resistant to DNA damage because of the preemptive protective program driven by Zeb1. We hypothesized that these tumors would be less immunogenic due to low number of gene mutations they carry, as a high frequency of somatic mutations is asso-ciated with higher immunogenicity in breast cancer [14]. The question thus arose of wheth-er increased Zeb1 expression would be associ-ated with specific characteristics of immune microenvironment in metaplastic and non-metaplastic breast cancers.
Therefore, we conducted the study presented here, to verify our hypothesis of association between tumor cell Zeb1 expression and immune response within the tumor bed. We exploited single and double-staining immuno-histochemistry (IHC) as convenient methods for first verification of our hypothesis, before using more complex methods of tissue analysis. IHC is the most affordable and widely implanted method in clinical pathology laboratories which allows simultaneous visualization of cellular morphology and protein expression. It can reveal the spatial distribution of tumor immune microenvironment components, recently shown to greatly influence the cancer response to immunomodulators [12, 15-17].
We first evaluated the expression of Zeb1 in a large cohort containing triple negative (TNBC) and luminal breast cancers. After finding a much greater proportion of Zeb1+ cases in triple negative than in luminal B tumors, we studied the spatial relationship between Zeb1-expressing cells and subpopulations of tumor-infiltrating lymphocytes (TILs) in TNBC. In- terestingly, we observed that not only tumor cell but also stromal cell Zeb1 expression was associated with a particular pattern of TIL spa-tial distribution. We found that the density of CD8+ TILs, the main effectors of cellular im- mune response against cancer, was low in the areas with tumor cells expressing Zeb1, but high in the tumor stroma rich in Zeb1-expressing cells. Finally, we hypothesize about the cause of this relationship.
Material and methods
Case selection
This study was approved by the Ethics Com- mittee (CECIC) of the Rhone-Alpes-Auvergne region (Grenoble, France). The main cohort con-tained 234 retrospectively included patients, who had surgery for breast cancer from January 1, 2014 to June 30, 2017, at the Centre Jean Perrin in Clermont-Ferrand, France. Formalin-fixed, paraffin-embedded tumor tissue blocks were retrieved from the Centre archives. Mo- lecular classification was performed by IHC, using the 2011 St Gallen criteria [18]. The main cohort studied included 89 luminal B (LumB)/ HER2-, 42 LumB/HER2+ and 103 TNBCs. Pa- tients were treated either by first-line surgery, followed by an adjuvant treatment (n=164), or by neoadjuvant chemotherapy, followed by sur-gery (n=70). Owing to a very low number of high-grade metaplastic tumors (demonstrated to strongly express Zeb1 [3]) in the main cohort, a secondary cohort composed of five high-grade metaplastic TNBCs and five high-grade non-metaplastic TNBCs, belonging to an already published cohort, was also included in the study [13].
Tissue microarrays
The study was performed on breast tumor specimens obtained at surgery. H&E-stained sections of all the FFPE blocks containing tumor cells were reviewed and selected for further study by four authors (M.OD., M.K., M.D-S.,
N.R-R.; the last three are board-certified breast pathologists). At least one tumor area, at least 10 × 10 mm in size, containing the tumor inva-sive front, was selected for TMA construction. Whenever possible, and especially in cases of cytologically/architecturally heterogeneous tumors, up to three different tumor areas, with at least 200 tumor cells, were selected. The areas to be sampled for TMAs were marked by two researchers (M.O-D., N.R-R.). From each tumor, at least one 0.6 mm-diameter cylinder was sampled at the tumor invasive front and in the tumor interior (the area at distance of 5-10 high-power fields/HPFs, × 40, field diameter 0.55 mm/from the invasive front, toward tumor center). TMAs were constructed by a tissue microarrayer (MiniCore® 3, Excilone, Elancourt, France). In all, 187 tumors were sampled and integrated into TMAs.
Whole tumor tissue sections
Fifty-seven breast tumors were analyzed using whole tissue sections. All the blocks containing tumor tissue were cut and the sections stained by IHC. At least one section was analyzed, at least 10 × 10 mm in size, containing the tumor invasive front and at least 200 tumor cells.
Immunohistochemistry
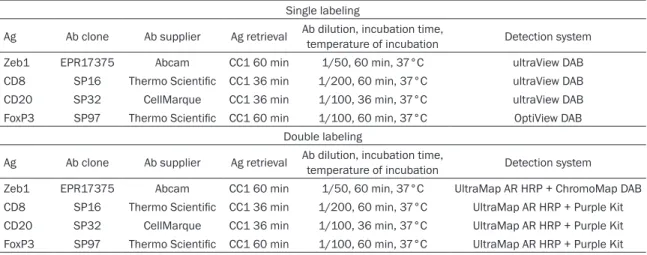
All IHC single labelings were performed in Benchmark XT or Ultra automated systems. Double labelings were done in a Benchmark Discovery automated system (Ventana/Roche Diagnostics, Meylan, France). Details of the procedures are given in Table 1.
The stained sections were first scanned at × 4 and × 10 magnification with a Nikon Eclipse Ci microscope, to roughly evaluate spatial hetero-geneity of Zeb1 expression and TIL distribution. A detailed analysis of each case (at × 20 and × 40) was done on a 30-inch monitor, connected to the microscope by a digital photography sys-tem (NIS-Elements D, Nikon France SAS, Champigny-sur-Marne, France).
Tumor cell expression of Zeb1 was assessed semi-quantitatively and scored as follows: a) low (present in <5% of tumor cells), b) moderate (in 5-49% of tumor cells), c) high (in ≥50% of tumor cells). The cut-off for tumor positivity for Zeb1 was arbitrarily chosen to be 5% (<5%, negative; ≥5%, positive).
Tumor stroma was considered rich in Zeb1-expressing cells (sZeb1rich) if >20 Zeb1+ cells were observed in one HPF, and poor in those cells (sZeb1poor) if one HPF contained ≤20 Zeb1+ cells. Any intensity of the Zeb1 nuclear expression was considered as Zeb1 positivity. TILs were considered CD8+ or CD20+ if any intensity of the membranous IHC signal was observed, and FoxP3+ if any intensity if the IHC signal was observed in the nucleus. Tumors were classified, for the purpose of this research, into high-density cases (with ≥10 CD8+, CD20+ or FoxP3+ TILs within a HPF) and low-density cases (with <10 TILs per HPF, respectively).
Statistical analysis
Statistical analysis was performed using Fis- her’s exact test using the R software.
Table 1. Immunohistochemical procedures used to detect Zeb1 and TIL subpopulations
Single labeling
Ag Ab clone Ab supplier Ag retrieval Ab dilution, incubation time, temperature of incubation Detection system Zeb1 EPR17375 Abcam CC1 60 min 1/50, 60 min, 37°C ultraView DAB CD8 SP16 Thermo Scientific CC1 36 min 1/200, 60 min, 37°C ultraView DAB CD20 SP32 CellMarque CC1 36 min 1/100, 36 min, 37°C ultraView DAB FoxP3 SP97 Thermo Scientific CC1 60 min 1/100, 60 min, 37°C OptiView DAB
Double labeling
Ag Ab clone Ab supplier Ag retrieval Ab dilution, incubation time, temperature of incubation Detection system Zeb1 EPR17375 Abcam CC1 60 min 1/50, 60 min, 37°C UltraMap AR HRP + ChromoMap DAB CD8 SP16 Thermo Scientific CC1 36 min 1/200, 60 min, 37°C UltraMap AR HRP + Purple Kit CD20 SP32 CellMarque CC1 36 min 1/100, 36 min, 37°C UltraMap AR HRP + Purple Kit FoxP3 SP97 Thermo Scientific CC1 60 min 1/100, 60 min, 37°C UltraMap AR HRP + Purple Kit
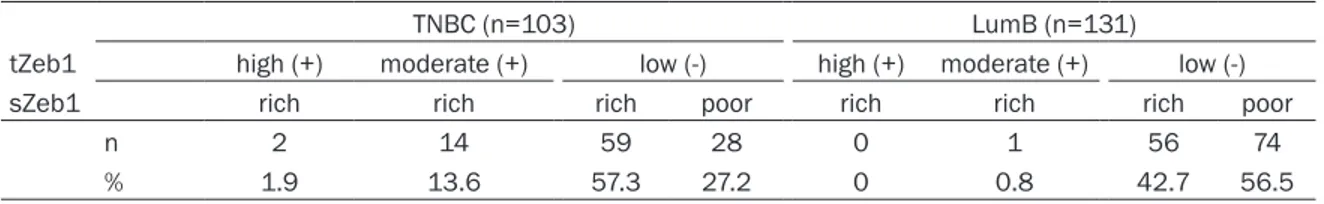
Table 2A. Expression of Zeb1 in triple negative and luminal breast cancers (main cohort)
TNBC (n=103) LumB (n=131)
tZeb1 high (+) moderate (+) low (-) high (+) moderate (+) low (-)
sZeb1 rich rich rich poor rich rich rich poor
n 2 14 59 28 0 1 56 74
% 1.9 13.6 57.3 27.2 0 0.8 42.7 56.5
Table 2B. Expression of Zeb1 in triple negative breast cancers (secondary cohort)
TNBC (n=10)
tZeb1 high (+) moderate (+) low (-)
sZeb1 rich rich rich poor
n 4 3 1 2
metaplastic n 3 2 0 0
non-metaplastic n 1 1 1 2
Legend: TNBC, triple negative breast cancers; LumB, luminal B breast cancers; tZeb1, tumor cell Zeb1 expression; sZeb1, stromal richness in cells expressing Zeb1.
Results
Zeb1 expression rate is significantly higher in triple negative than in luminal B breast cancer
We first evaluated Zeb1 expression in a con-secutive series of 234 breast cancers (103 TNBCs and 131 luminal B tumors, main cohort). As shown in Table 2A, 16/103 TNBCs (15.5%) had high or moderate tumor cell Zeb1 expres-sion (tZeb1+, 1.9% high and 13.6% moderate, respectively). The expression rate of tZeb1 was much lower in luminal B cancers than in TNBC (only 1/131 cases, 0.8%). This difference was highly statistically significant (P=0.0001). In a secondary cohort, added to enrich the study population in high-grade metaplastic breast cancers, 7 out of 10 tumors had high (n=4) or moderate (n=3) tZeb1 expression. All high-grade metaplastic tumors (n=5) were tZeb1-positive (Table 2B).
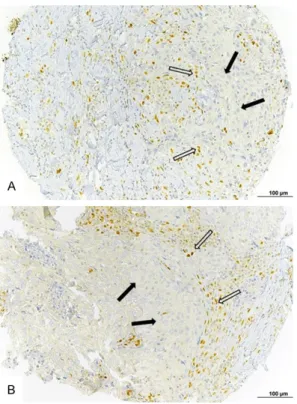
Zeb1 was also expressed in stromal cells. Most of the stromal Zeb1+ cells had fusiform mor-phology. Some stromal Zeb1+ cells were more round than fusiform and typically localized in close proximity to the tumor islands (Figure 1). Stroma was rich in Zeb1+ cells (sZeb1rich) in sig-nificantly more TNBCs than luminal tumors (72.8% vs 43.5%, respectively, P=0.0001, Table 2A).
We then analyzed combined tumor cell/stromal expression of Zeb1 and found 3 categories of
tumors: tZeb1+/sZeb1rich, tZeb1-/sZeb1rich and tZeb1-/sZeb1poor. Interestingly, no luminal or triple negative tumor was tZeb1+/sZeb1poor. As shown in Table 2A, the main TNBC cohort contained 16 tZeb1+/sZeb1rich cases (15.5%), 59 tZeb1-/ sZeb1rich cases (57.3%) and 28 tZeb1-/sZe-b1poor cases (27.2%). The luminal tumor cohort was composed of 56 tZeb1-/sZe-brich (42.7%) and 74 tZeb1-/sZeb1poor cases (56.5%). The only tZeb1+ luminal tumor was sZeb1rich. The proportion of tZeb1+/ sZeb1rich cases was thus significantly greater in the triple negative than in the luminal tumors (P=1.04 × 10⁻⁵), whereas the luminal tumors had significantly greater proportion of tZeb1-/sZeb1poor cases (P=1.01 × 10⁻⁵). The proportion of tZeb1-/sZeb1rich cases was also greater in the triple negative than in the luminal cohort (P=0.035).
Overall, we conclude that TNBCs are markedly richer in Zeb1-expressing cells than luminal tumors, whether in the tumor islands or in the stroma. Figure 2 shows a representative exam-ple of each tZeb1/sZeb1 category.
Spatial relationship between CD8+ TILs and Zeb1+ cells in TNBC
Since our TNBC cohorts contained many more tumors with Zeb1+ tumor cells and with stroma rich in Zeb1+ cells, and since TNBCs have been reported to have higher rates of the ‘hot’/ ‘inflamed’ tumors than luminal B breast can-cers [19], we chose TNBC subtype to study spa-tial relationship between Zeb1-expressing cells and TILs.
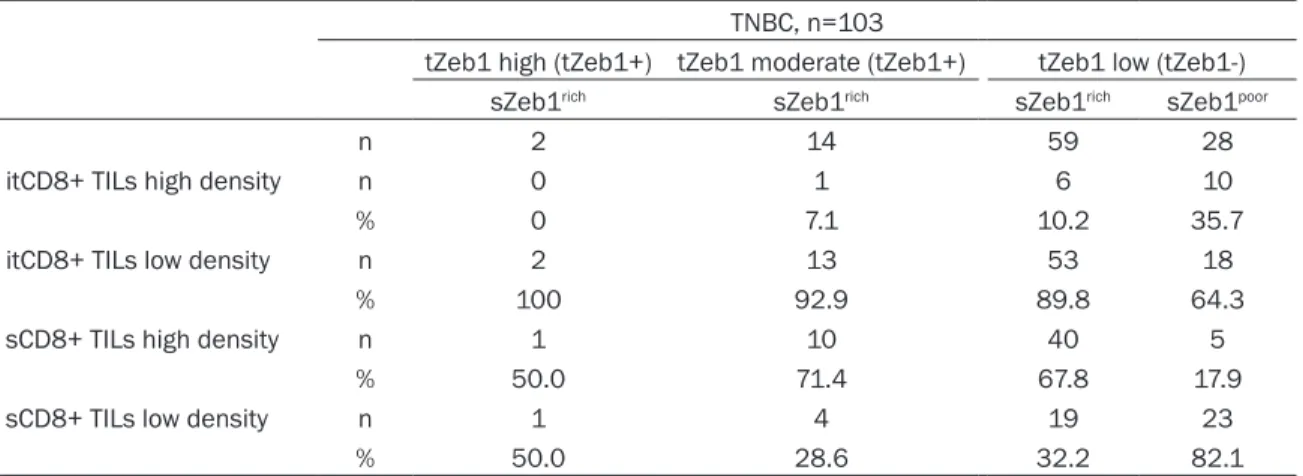
We first observed that all TNBCs with high expression of Zeb1 in tumor cells had low intra-tumoral CD8+ TIL density (6/6 cases, 2 in the main and 4 in the secondary cohort, Table 3A and 3B). Similarly, almost all TNBCs with mod-erate tZeb1 expression (16 out of 17 cases in two cohorts considered together) had little intratumoral CD8+ TILs (Table 3A and 3B). In
Figure 1. Zeb1-expressing cells in breast cancer in-tratumoral stroma. A. Triple-negative breast cancer with Zeb1-expressing cells in the stroma. B. Luminal breast cancer with Zeb1-expressing cells in the stro-ma. White arrows = Zeb1-expressing non-fusiform stromal cells. Black arrows = tumor cells. Bar =100
µm. Figure 2. Tumor categories according to Zeb1
ex-pression in tumor and stromal cells. Representa-tive examples of three tumor categories, according to Zeb1 expression in tumor and stromal cells. A. tZeb1+/sZeb1rich tumor. B. tZeb1-/sZeb1rich tumor. C.
a tZeb1-/sZeb1poor tumor. Bar =100 µm. addition, low density of intratumoral CD8+ TILs
characterized 89.8% (53 out of 59 main cohort cases) of TNBCs not expressing Zeb1 in their tumor cells but having stroma rich in Zeb1+ cells (Table 3A).
We then focused on the relationship between stromal richness in Zeb1+ cells and the density of intratumor infiltration by CD8+ TILs, irrespec-tive of the tumor cell Zeb1 expression. In the main cohort, significantly more tumors with stroma rich in Zeb1+ cells had a low density of intratumoral CD8+ TILs (68/75 cases, 90.7%) than tumors with stroma poor in Zeb1+ cells (18/28 cases, 64.3%), P=0.0027 (Table 4A). Similarly, in the secondary cohort, 7 out of 8 cases with stroma rich in Zeb1+ cells had a low density of intratumoral CD8+ TILs (Table 4B). Figure 3 shows representative examples of TNBCs with different expressions of Zeb1 in tumor and stromal cells and the corresponding patterns of CD8+ TIL infiltration revealed by single IHC labeling.
To confirm in situ the specific associations of tumor or stromal cell expression of Zeb1 and infiltration of these areas by CD8+ TILs, we per-formed double IHC for Zeb1 and CD8, where the first antigen was visualized by a brown and the second by a purple precipitate. Figure 4 shows several representative areas with Zeb1+ or Zeb1- tumor cells and the corresponding CD8+ lymphocytic infiltration. The double IHC for Zeb1 and CD8 confirmed that the areas with tumor cells expressing Zeb1 were poor in CD8+ TILs, whereas the stromal areas rich in Zeb1+ cells were highly infiltrated by CD8+ TILs. After analyzing a total of 113 TNBCs (main and secondary cohort) we conclude that Zeb1 expression by TNBC tumor cells is associated with a low density of intratumoral CD8+ TILs. In addition, TNBCs with stroma rich in Zeb1-expressing cells have a high density of stromal
Table 3A. Zeb1 expression and density of CD8+ TILs in TNBCs, main cohort
TNBC, n=103
tZeb1 high (tZeb1+) tZeb1 moderate (tZeb1+) tZeb1 low (tZeb1-)
sZeb1rich sZeb1rich sZeb1rich sZeb1poor
n 2 14 59 28
itCD8+ TILs high density n 0 1 6 10
% 0 7.1 10.2 35.7
itCD8+ TILs low density n 2 13 53 18
% 100 92.9 89.8 64.3
sCD8+ TILs high density n 1 10 40 5
% 50.0 71.4 67.8 17.9
sCD8+ TILs low density n 1 4 19 23
% 50.0 28.6 32.2 82.1
Table 3B. Zeb1 expression and density of CD8+ TILs in TNBCs, secondary cohort
TNBC, n=10
tZeb1 high (tZeb1+) tZeb1 moderate (tZeb1+) tZeb1 low (tZeb1-)
sZeb1rich sZeb1rich sZeb1rich sZeb1poor
n 4 3 1 2
itCD8+ TILs high density n 0 0 1 1
itCD8+ TILs low density n 4 3 0 1
sCD8+ TILs high density n 1 2 1 2
sCD8+ TILs low density n 3 1 0 0
Legend: TNBC, triple negative breast cancers; tZeb1, tumor cell Zeb1 expression; sZeb1rich, stroma rich in cells expressing Zeb1;
sZeb1poor, stroma poor in cells expressing Zeb1; itCD8+ TILs, intratumoral CD8+ tumor-infiltrating lymphocytes; sCD8+ TILs,
stromal CD8+ tumor-infiltrating lymphocytes.
Table 4A. Stromal richness in Zeb1-expressing cells and the density of intratumoral CD8+ TILs (main cohort)
TNBC sZeb1poor sZeb1rich
itCD8+ TILs high density n 10 7
% 35.7 9.3
itCD8+ TILs low density n 18 68
% 64.3 90.7
Total n 28 75
% 100 100
Table 4B. Stromal richness in Zeb1-expressing cells and the density of intratumoral CD8+ TILs (secondary cohort)
TNBC sZeb1poor sZeb1rich
itCD8+ TILs high density n 1 1
itCD8+ TILs low density n 1 7
Total n 2 8
Legend: TNBCs, triple negative breast cancers; TILs, tumor-infiltrating lymphocytes; sZeb1poor, stroma poor in
Zeb1-expressing cells; sZeb1rich, stroma rich in Zeb1-expressing
cells.
CD8+ TILs and a low density of intratumoral CD8+ TILs.
Tumor or stromal cell expression of Zeb1 does not influence the infiltration by FoxP3+ T-lymphocytes or CD20+ B-lymphocytes
After finding that Zeb1 expression, by either tumor or stromal cells, is associated with spe-cific patterns of tumor infiltration by CD8+ TILs, we looked for a similar relationship between Zeb1 expression and tumor infiltration by other TIL subtypes. We focused on the FoxP3+ regu-latory T-lymphocytes (Tregs) and the CD20+ B-lymphocytes, each playing an important role in the immune response to cancer. Each of these two cell types was found in both the tumor islands and the stroma, but the density of these cells was almost universally low. The B-cells were mostly localized outside the tumors. We could not establish any significant association between the density of CD20+ or FoxP3+ TILs and the Zeb1 expression by either tumor or stromal cells. Figure 5 shows repre-sentative examples of spatial relationships between TNBC tumor or stromal Zeb1 and FoxP3+ or CD20+ cells.
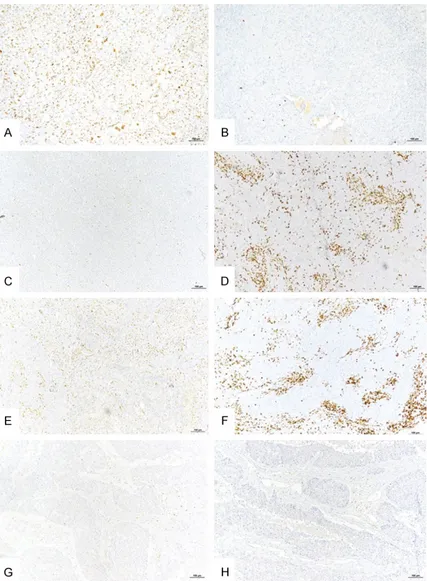
Figure 3. Representative examples of Zeb1 expression by tumor or stromal cells and infiltration by CD8+ TILs in triple negative breast cancer (single IHC labeling). (A) Tumor with high Zeb1 expression in tumor cells. (B) The same tumor as under (A), low density of intratumoral CD8+ TILs. (C) Tumor with no Zeb1 expression in tumor cells. (D) The same tumor as under (C), high density of intratumoral CD8+ TILs. (E) Tumor with stroma rich in Zeb1+ cells. (F) The same tumor as under E, high density of stromal CD8+ TILs. (G) Tumor with no Zeb1+ tumor or stromal cells. (H) The same tumor as under (G), low density of intratumoral and stromal CD8+ TILs. Bar =100 µm.
Discussion
Zeb1 is best known as a major transcription factor governing EMT. Our team has recently shown that Zeb1 also protects breast stem cells from oxidative stress and this way inhibits DNA damage which generates chromosomal instability [13]. Several recent studies have revealed Zeb1 roles in multiple immune cell lin-eages (T, B, NK lymphocytes, macrophages, dendritic cells) [20]. Therefore, it can be
hypoth-esized that Zeb1 influences the immune response to can-cer in multiple ways, directly or indirectly.
Here we show that expression of Zeb1 in TNBC tumor or stro-mal cells is associated with specific spatial distribution of CD8+ T-cells, the main type of anti-tumor TILs. Spatial aspects of tumor immune infil-tration have been demonstrat-ed to be of high importance both for general prognosis of cancers and for their response to immunomodulators such as immune checkpoint inhibitors [21, 22].
According to our best knowl-edge, our study is the first th- at explored the relationship between Zeb1 expression and the immune infiltrate of breast cancer using an in situ meth-od. Alkatout et al investigated the expression pattern of another EMT-driver, Snail, and the quantity of CD3+, CD8+ and FoxP3+ TILs in a cohort of 352 breast cancers [23]. They found that high tumor cell expression of Snail and higher numbers of FoxP3 TILs were associated with longer dis-ease-free patient survival, but they did not investigate the spatial relationship between tumor Snail+ cells and the three TIL subtypes.
Other authors investigated only EMT transcrip-tion factor expression in breast cancer. In a cohort of 173 TNBCs, Jang et al found similar frequency of cases expressing Zeb1 in tumor cells as we found in our main cohort [24]. Karihtala et al studies Zeb1 expression in tumor cells and stroma in a cohort of 231 breast can-cers, among which 51.5% TNBCs, however our results cannot be compared to theirs because of different scoring systems exploited and cor-relations performed [25].
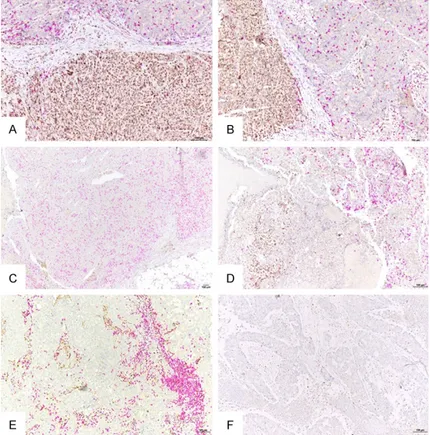
Figure 4. Representative images of spatial relationship between tumor or stromal Zeb1+ cells and CD8+ TILs in triple negative breast cancers (double IHC labeling; brown, Zeb1; purple, CD8). A. Tumor with an area composed of cells highly expressing Zeb1 and low density of intratumoral CD8+ TILs (bottom), and an area composed of cells without Zeb1 expression, highly in-filtrated by CD8+ TILs (up). B. Another tumor, with similar spatial relationship between Zeb1-expressing cells and CD8+ TILs as the one under A (Zeb1+ cells on the left and CD8+ TILs on the right). C. Tumor with no Zeb1 expres-sion by tumor cells and high density of intratumoral CD8+ TILs. D. Tumor with two different areas: the area at the left contains a zone rich in Zeb1+ tumor cells which is devoid of CD8+ TILs even outside the Zeb1+ zone; the area at the right contains less Zeb1+ tumor cells and much higher density of CD8+ TILs. E. Tumor with stroma rich in Zeb1+ cells and high density of stromal CD8+ TILs. F. Tumor with no stromal Zeb1+ cells and with low density of both stromal and intratumoral CD8+ TILs. Bar =100 µm.
Figure 5. Representative exam- ples showing spatial relation-ship between Zeb1+ cells and CD20+ or FoxP3+ TILs in triple-negative breast cancers (double IHC; brown, Zeb1; purple, CD8). A. Tumor with Zeb1+ cells and low density of intratumoral CD20+ TILs. B. Tumor with no Zeb1+ tumor cells and low density of intratumoral CD20+ TILs. C. Tu-mor with Zeb1+ tuTu-mor cells and with low density of intratumoral FoxP3+ TILs. D. Tumor with no Zeb1+ tumor cells, high density of stromal Zeb1+ cells and low density of intratumoral or stromal FoxP3+ TILs. Bar =100 µm.
Our main finding is that TNBC areas that contain Zeb1-ex- pressing tumor cells are very poor in CD8+ TILs, which gen-erates several hypotheses to verify in further work. The Zeb1+ TNBC cells might have phenotypic, genotypic or TIL-repelling characteristics that make them nonpermissive for direct contact by CD8+ lym- phocytes.
The first plausible hypothesis is that the Zeb1+ tumors have low numbers of intratumoral CD8+ TILs because of a gen-erally low immunogenicity due to a low mutation/neoantigen burden. This mechanism mi- ght be operating in a subset of metaplastic TNBCs like those we have previously charac- terized [13]. To confirm this hypothesis, it would be neces-sary to perform mutational or neoantigen profiling of the analyzed cases.
Deciphering the mechanisms behind tumor repellency of TILs is only beginning. A recent elegant study by Li et al. dem-onstrated the existence of a possible chemorepellent in- side TNBC cell clusters that prevents CD8+ TILs from com-ing into direct contact with the tumor cells [26]. The authors also showed that the repelling
entity is not desmoplasia, i.e. a physical barrier to TIL traffic toward the tumor islands made by an excess of collagen fibers. Several chemical entities or tumor molecular features have been demonstrated to be negative regulators of the immune response within the tumor site and reported as possible TIL repellents. The main ones are hypoxia, intratumoral hypoglycemia and some chemokines, cytokines and growth factors, such as CCL5, CXCL12, IL-8 or TGFβ [27-32]. In situ studies of tumor secretome could confirm whether the Zeb1+ TNBC cells are surrounded by molecules with lymphocyte-repelling properties.
One of the mechanisms of Zeb1-induced can-cer immunosuppression is induction of PD-L1. Zeb1 relieves miRNA-200 repression of the PD-L1 promoter, as shown by genomic analy-ses of lung cancer [33]. PD-L1 expression plays a key role in exhaustion of CD8+ TILs, thus inhibiting their function [34]. However, data showing the relationship between tumor PD-L1 expression and the amount of tumor-infiltrating CD8+ cells are conflicting. In a series of 477 lung cancers, Kim et al. found that the tumors with EMT features and PD-L1 expression had most CD8+ cells [35]. Elsewhere, Tsutsumi et
al. demonstrated that co-expression of Zeb1
and PD-L1 at the invasive front of esophageal squamous carcinoma correlated with less CD8+ lymphocyte infiltration [36]. Among breast cancers, those of metaplastic histotype have been shown to have the highest rate of EMT marker and PD-L1 expression [3, 37, 38]. However, the level of their infiltration by lym-phocytes is variable [38]. Our metaplastic breast cancers (n=6) were all characterized by high grade, high Zeb1 expression in tumor cells and low intratumoral TILs (data not shown sep-arately for this histotype). Future work should be directed towards a fuller exploration of the relationship between Zeb1, PD-L1 and TILs in metaplastic and non-metaplastic breast cancers.
Zeb1 expression in cancer cells has been shown to be associated with the molecular fea-tures of stem cells (stemness). In a recent study, Miranda et al. have shown a strong nega-tive association between cancer stemness and anti-cancer immunity, using genomic, transcrip-tomic and clinical parameters across 21 solid cancers [39]. This negative association was
particularly clear for CD8+ lymphocytes, and then for NK and B-cells, whereas it was more variable for CD4+ cells, Tregs and neutrophils, indicating that the influence of cancer stem-ness on tumor infiltration by the immune cells might be cell-specific. Our findings are partially concordant with those of Miranda et al. We also demonstrated a strong negative association between tumor cell expression of the stemness marker Zeb1 and the number of CD8+ TILs, but no such association was found for B-cells or Tregs. Moreover, we used an in situ method able to show the tumor tissue zones infiltrated by a specific immune cell type, whereas Miranda et al. analyzed gene expression of bulk tumor tissue. In this way we were able to show that the feature associated with low CD8+ cell infiltration was indeed tumor and not stromal cell expression of Zeb1, supporting the hypoth-esis of malignant cell stemness as their intrin-sic immunosuppressive feature.
Another major finding of our study is retention of CD8+ T-cells in the tumor stroma rich in Zeb1-expressing cells. Most of these cells are benign cells of mesenchymal origin, so Zeb1 is a mere marker of their lineage [40]. Some of the stromal Zeb1+ cells might be the tumor cells in EMT that started invading. Irrespective of the nature of the Zeb1+ cells in TNBC stro-ma, increased richness in Zeb1+ stromal cells could be considered as an indicator of reduced intratumoral infiltration by CD8+ lymphocytes due to their accumulation outside the tumor islands. The reasons for this accumulation are likely multiple and need to be better explored. In addition, it would be necessary to determine whether the tumor stroma rich in Zeb1-epressing cells only impairs the traffic of CD8+ TILs toward tumor cell clusters or also inhibits their cytolytic capacity. Cancer mesenchymal stromal cells (MSCs) can inhibit CD8+ T-cell function by secretion of exosomes, which pro-mote Treg differentiation [41], however we could not demonstrate an increased accumula-tion of Tregs in the TNBC stroma rich in Zeb1+ cells. Another mechanism of CD8+ T-cell inhibi-tion in stroma might be secreinhibi-tion of various immunomodulatory cytokines by MSCs or depletion of metabolites critical for T-cell func-tions [42]. A recent study in a mouse model of ovarian cancer showed that Zeb1 is required for tumor-promoting and immunosuppressi- ve action of tumor-associated macrophages
(TAMs) [43]. TAMs are also numerous in breast cancer microenvironment, so they likely repre-sent an important part of the Zeb1-expressing stromal cells in our cohort of TNBC. Future studies simultaneously evaluating macroph- age markers (CD68, CD163), Zeb1 and lympho-cyte markers would better explore the relation-ship of Zeb1+ stromal TAMs and CD8+ TILs within breast cancer stroma.
Interestingly, expression of Zeb1, by either tumor or stromal cells, does not seem to influ-ence the spatial distribution of B-type TILs. There is increasing evidence for the importance of this lymphocyte population for anti-cancer immune response and the cancer response to immunotherapies [44, 45]. More work is neces-sary to better understand the interplay between B-TILs and tumor cells in EMT or the benign stromal cells of mesenchymal lineage.
We also observed some cases neither express-ing Zeb1 in tumor cells nor rich in stromal Zeb1+ cells. Those tumors were poor in tumor-infiltrat-ing lymphocytes and had the ‘cold’/‘immune desert’ immunophenotype [46]. The mecha-nisms inducing weak or absent immune res- ponse in their tumor sites likely do not involve the interaction between Zeb1+ cells and TILs. One limitation of our study is presentation only of the correlations between biological features so no conclusion about causality can be drawn. However, our intention was, indeed, to perform a preliminary study of spatial relationships between a molecule (Zeb1) with a potential role in cancer immune microenvironment shaping and the elements of that environment (TILs). Several methods have been recently developed for high multiplex, spatially resolved gene/pro-tein expression cancer profiling [47]. These methods allow deep exploration of cancer tis-sue content, however need a careful experi-mental design in order to evaluate the features of a researcher’s interest without generating a number of potentially confusing data. In this line, defining smaller panels of molecules of interest maintains, in our opinion, a valuable basis for more extensive research. According to the results of this study, Zeb1, as a reflector of tumor cell EMT/stemness and tumor stroma richness in the immunosuppressive cells of mesenchymal origin, could be included in the ‘screening’ panels for tumor microenviron- ment immunophenotyping, together with CD8,
FoxP3, CD20, CD68/163, PD-L1. Evaluation of expression of the panel members in several regions of interest in various tumor tissues might rapidly generate biomarkers of potential clinical interest.
In conclusion, our study visually documents specific associations between Zeb1-express- ing cells and CD8+ TILs, in a tumor type for which immunotherapeutic approaches are being increasingly developed [48]. We hypoth-esize that the observed relationships might be provoked, at least partially, by TIL-repelling properties of Zeb1+ tumor cells and TIL-re- taining properties of stromal Zeb1+ cells. Zeb1 therefore needs further investigation as a puta-tive biomarker of intratumoral immunosuppres-sion, and, potentially, of cancer response/resis-tance to immunotherapies.
Acknowledgements
This research was funded by the Program fos-tering cancer research collaboration of the Auvergne and the Rhone-Alpes regions, France. Disclosure of conflict of interest
None.
Address correspondence to: Nina Radosevic-Robin, Department of Pathology, Centre Jean Perrin, 58 rue Montalembert, BP392, 63011 Clermont-Ferrand, France. Tel: +33473278499; +33625264990; Fax: +33473278180; E-mail: nina.radosevic.robin@ gmail.com; nina.robin@clermont.unicancer.fr
References
[1] Lamouille S, Xu J and Derynck R. Molecular mechanisms of epithelial-mesenchymal transi-tion. Nat Rev Mol Cell Biol 2014; 15: 178-196. [2] Dongre A and Weinberg RA. New insights into
the mechanisms of epithelial-mesenchymal transition and implications for cancer. Nat Rev Mol Cell Biol 2019; 20: 69-84.
[3] Taube JH, Herschkowitz JI, Komurov K, Zhou AY, Gupta S, Yang J, Hartwell K, Onder TT, Gupta PB, Evans KW, Hollier BG, Ram PT, Lander ES, Rosen JM, Weinberg RA and Mani SA. Core epithelial-to-mesenchymal transition interactome gene-expression signature is as-sociated with claudin-low and metaplastic breast cancer subtypes. Proc Natl Acad Sci U S A 2010; 107: 15449-15454.
[4] De Craene B and Berx G. Regulatory networks defining EMT during cancer initiation and pro-gression. Nat Rev Cancer 2013; 13: 97-110.
[5] Jung HY, Fattet L and Yang J. Molecular path-ways: linking tumor microenvironment to epi-thelial-mesenchymal transition in metastasis. Clin Cancer Res 2015; 21: 962-968.
[6] Chockley PJ and Keshamouni VG. Immunologi-cal consequences of epithelial-mesenchymal transition in tumor progression. J Immunol 2016; 197: 691-698.
[7] Sistigu A, Di Modugno F, Manic G and Nistico P. Deciphering the loop of epithelial-mesenchy-mal transition, inflammatory cytokines and cancer immunoediting. Cytokine Growth Factor Rev 2017; 36: 67-77.
[8] Kudo-Saito C, Shirako H, Takeuchi T and Kawakami Y. Cancer metastasis is accelerated through immunosuppression during Snail-in-duced EMT of cancer cells. Cancer Cell 2009; 15: 195-206.
[9] Lopez-Novoa JM and Nieto MA. Inflammation and EMT: an alliance towards organ fibrosis and cancer progression. EMBO Mol Med 2009; 1: 303-314.
[10] Khalil DN, Smith EL, Brentjens RJ and Wolchok JD. The future of cancer treatment: modulation, CARs and combination immuno-therapy. Nat Rev Clin Oncol 2016; 13: 273-290.
[11] Ribas A and Wolchok JD. Cancer immunother-apy using checkpoint blockade. Science 2018; 359: 1350-1355.
[12] Galluzzi L, Chan TA, Kroemer G, Wolchok JD and Lopez-Soto A. The hallmarks of successful anticancer immunotherapy. Sci Transl Med 2018; 10: eaat7807.
[13] Morel AP, Ginestier C, Pommier RM, Cabaud O, Ruiz E, Wicinski J, Devouassoux-Shisheboran M, Combaret V, Finetti P, Chassot C, Pinatel C, Fauvet F, Saintigny P, Thomas E, Moyret-Lalle C, Lachuer J, Despras E, Jauffret JL, Bertucci F, Guitton J, Wierinckx A, Wang Q, Radosevic-Robin N, Penault-Llorca F, Cox DG, Hollande F, Ansieau S, Caramel J, Birnbaum D, Vigneron AM, Tissier A, Charafe-Jauffret E and Puisieux A. A stemness-related ZEB1-MSRB3 axis gov-erns cellular pliancy and breast cancer ge-nome stability. Nat Med 2017; 23: 568-578. [14] Criscitiello C and Curigliano G. Immunotherapy
of breast cancer. Prog Tumor Res 2015; 42: 30-43.
[15] Wang C, Singer M and Anderson AC. Molecular dissection of CD8(+) T-cell dysfunction. Trends Immunol 2017; 38: 567-576.
[16] Mehnert JM, Monjazeb AM, Beerthuijzen JMT, Collyar D, Rubinstein L and Harris LN. The chal-lenge for development of valuable immuno-oncology biomarkers. Clin Cancer Res 2017; 23: 4970-4979.
[17] Saltz J, Gupta R, Hou L, Kurc T, Singh P, Nguyen V, Samaras D, Shroyer KR, Zhao T, Batiste R, Van Arnam J; Cancer Genome Atlas Research
N, Shmulevich I, Rao AUK, Lazar AJ, Sharma A and Thorsson V. Spatial organization and mo-lecular correlation of tumor-infiltrating lympho-cytes using deep learning on pathology imag-es. Cell Rep 2018; 23: 181-193, e187. [18] Goldhirsch A, Wood WC, Coates AS, Gelber RD,
Thurlimann B and Senn HJ; Panel Members. Strategies for subtypes--dealing with the diver-sity of breast cancer: highlights of the st. Gal-len international expert consensus on the pri-mary therapy of early breast cancer 2011. Ann Oncol 2011; 22: 1736-1747.
[19] Stanton SE, Adams S and Disis ML. Variation in the incidence and magnitude of tumor-infiltrat-ing lymphocytes in breast cancer subtypes: a systematic review. JAMA Oncol 2016; 2: 1354-1360.
[20] Scott CL and Omilusik KD. ZEBs: novel players in immune cell development and function. Trends Immunol 2019; 40: 431-446.
[21] Corredor G, Wang X, Zhou Y, Lu C, Fu P, Syrigos K, Rimm DL, Yang M, Romero E, Schalper KA, Velcheti V and Madabhushi A. Spatial architec-ture and arrangement of tumor-infiltrating lym-phocytes for predicting likelihood of recurrence in early-stage non-small cell lung cancer. Clin Cancer Res 2019; 25: 1526-1534.
[22] Byrne A, Savas P, Sant S, Li R, Virassamy B, Luen SJ, Beavis PA, Mackay LK, Neeson PJ and Loi S. Tissue-resident memory T cells in breast cancer control and immunotherapy responses. Nat Rev Clin Oncol 2020; 17: 341-348. [23] Alkatout I, Hubner F, Wenners A, Hedderich J,
Wiedermann M, Sanchez C, Rocken C, Mathiak M, Maass N and Klapper W. In situ localization of tumor cells associated with the epithelial-mesenchymal transition marker Snail and the prognostic impact of lymphocytes in the tumor microenvironment in invasive ductal breast cancer. Exp Mol Pathol 2017; 102: 268-275. [24] Jang MH, Kim HJ, Kim EJ, Chung YR and Park
SY. Expression of epithelial-mesenchymal tran-sition-related markers in triple-negative breast cancer: ZEB1 as a potential biomarker for poor clinical outcome. Hum Pathol 2015; 46: 1267-1274.
[25] Karihtala P, Auvinen P, Kauppila S, Haapasaari KM, Jukkola-Vuorinen A and Soini Y. Vimentin, zeb1 and Sip1 are up-regulated in triple-nega-tive and basal-like breast cancers: association with an aggressive tumour phenotype. Breast Cancer Res Treat 2013; 138: 81-90.
[26] Li X, Gruosso T, Zuo D, Omeroglu A, Meterissian S, Guiot MC, Salazar A, Park M and Levine H. Infiltration of CD8(+) T cells into tumor cell clusters in triple-negative breast cancer. Proc Natl Acad Sci U S A 2019; 116: 3678-3687. [27] Bellone M and Calcinotto A. Ways to enhance
of tumor infiltrating lymphocytes. Front Oncol 2013; 3: 231.
[28] Kumar V and Gabrilovich DI. Hypoxia-inducible factors in regulation of immune responses in tumour microenvironment. Immunology 2014; 143: 512-519.
[29] Zhang Y and Ertl HC. Starved and Asphyxiated: how can CD8(+) T cells within a tumor microen-vironment prevent tumor progression. Front Immunol 2016; 7: 32.
[30] Alfaro C, Sanmamed MF, Rodriguez-Ruiz ME, Teijeira A, Onate C, Gonzalez A, Ponz M, Schalper KA, Perez-Gracia JL and Melero I. In-terleukin-8 in cancer pathogenesis, treatment and follow-up. Cancer Treat Rev 2017; 60: 24-31.
[31] Aldinucci D and Colombatti A. The inflamma-tory chemokine CCL5 and cancer progression. Mediators Inflamm 2014; 2014: 292376. [32] D’Agostino G, Cecchinato V and Uguccioni M.
Chemokine heterocomplexes and cancer: a novel chapter to be written in tumor immunity. Front Immunol 2018; 9: 2185.
[33] Chen L, Gibbons DL, Goswami S, Cortez MA, Ahn YH, Byers LA, Zhang X, Yi X, Dwyer D, Lin W, Diao L, Wang J, Roybal J, Patel M, Ungewiss C, Peng D, Antonia S, Mediavilla-Varela M, Rob-ertson G, Suraokar M, Welsh JW, Erez B, Wis-tuba, II, Chen L, Peng D, Wang S, Ullrich SE, Heymach JV, Kurie JM and Qin FX. Metastasis is regulated via microRNA-200/ZEB1 axis con-trol of tumour cell PD-L1 expression and intra-tumoral immunosuppression. Nat Commun 2014; 5: 5241.
[34] Chen L and Flies DB. Molecular mechanisms of T cell co-stimulation and co-inhibition. Nat Rev Immunol 2013; 13: 227-242.
[35] Kim S, Koh J, Kim MY, Kwon D, Go H, Kim YA, Jeon YK and Chung DH. PD-L1 expression is associated with epithelial-to-mesenchymal transition in adenocarcinoma of the lung. Hum Pathol 2016; 58: 7-14.
[36] Tsutsumi S, Saeki H, Nakashima Y, Ito S, Oki E, Morita M, Oda Y, Okano S and Maehara Y. Pro-grammed death-ligand 1 expression at tumor invasive front is associated with epithelial-mesenchymal transition and poor prognosis in esophageal squamous cell carcinoma. Cancer Sci 2017; 108: 1119-1127.
[37] Joneja U, Vranic S, Swensen J, Feldman R, Chen W, Kimbrough J, Xiao N, Reddy S, Palazzo J and Gatalica Z. Comprehensive profiling of metaplastic breast carcinomas reveals fre-quent overexpression of programmed death-li-gand 1. J Clin Pathol 2017; 70: 255-259. [38] Tray N, Taff J, Singh B, Suh J, Ngo N, Kwa M,
Troxel AB, Chae YK, Kurzrock R, Patel SP, Sha-ron E, Denkert C, Ross JS and Adams S. Meta-plastic breast cancers: genomic profiling, mu-tational burden and tumor-infiltrating lym- phocytes. Breast 2019; 44: 29-32.
[39] Miranda A, Hamilton PT, Zhang AW, Pattnaik S, Becht E, Mezheyeuski A, Bruun J, Micke P, de Reynies A and Nelson BH. Cancer stemness, intratumoral heterogeneity, and immune re-sponse across cancers. Proc Natl Acad Sci U S A 2019; 116: 9020-9029.
[40] Vandewalle C, Van Roy F and Berx G. The role of the ZEB family of transcription factors in de-velopment and disease. Cell Mol Life Sci 2009; 66: 773-787.
[41] Zhang Q, Fu L, Liang Y, Guo Z, Wang L, Ma C and Wang H. Exosomes originating from MSCs stimulated with TGF-beta and IFN-gamma pro-mote Treg differentiation. J Cell Physiol 2018; 233: 6832-6840.
[42] Groth C, Hu X, Weber R, Fleming V, Altevogt P, Utikal J and Umansky V. Immunosuppression mediated by myeloid-derived suppressor cells (MDSCs) during tumour progression. Br J Can-cer 2019; 120: 16-25.
[43] Cortes M, Sanchez-Moral L, de Barrios O, Fer-nandez-Acenero MJ, Martinez-Campanario MC, Esteve-Codina A, Darling DS, Gyorffy B, Lawrence T, Dean DC and Postigo A. Tumor-associated macrophages (TAMs) depend on ZEB1 for their cancer-promoting roles. EMBO J 2017; 36: 3336-3355.
[44] Largeot A, Pagano G, Gonder S, Moussay E and Paggetti J. The B-side of cancer immunity: the underrated tune. Cells 2019; 8: 449.
[45] Griss J, Bauer W, Wagner C, Simon M, Chen M, Grabmeier-Pfistershammer K, Maurer-Granof-szky M, Roka F, Penz T, Bock C, Zhang G, Her-lyn M, Glatz K, Laubli H, Mertz KD, Petzelbauer P, Wiesner T, Hartl M, Pickl WF, Somasundar-am R, Steinberger P and Wagner SN. B cells sustain inflammation and predict response to immune checkpoint blockade in human mela-noma. Nat Commun 2019; 10: 4186.
[46] Chen DS and Mellman I. Elements of cancer immunity and the cancer-immune set point. Nature 2017; 541: 321-330.
[47] Decalf J, Albert ML and Ziai J. New tools for pa-thology: a user’s review of a highly multiplexed method for in situ analysis of protein and RNA expression in tissue. J Pathol 2019; 247: 650-661.
[48] Marra A, Viale G and Curigliano G. Recent ad-vances in triple negative breast cancer: the im-munotherapy era. BMC Med 2019; 17: 90.