Publisher’s version / Version de l'éditeur:
Journal of the Acoustical Society of America, 89, March 6, pp. 1176-1192,
1991-03
READ THESE TERMS AND CONDITIONS CAREFULLY BEFORE USING THIS WEBSITE. https://nrc-publications.canada.ca/eng/copyright
Vous avez des questions? Nous pouvons vous aider. Pour communiquer directement avec un auteur, consultez la première page de la revue dans laquelle son article a été publié afin de trouver ses coordonnées. Si vous n’arrivez pas à les repérer, communiquez avec nous à [email protected].
Questions? Contact the NRC Publications Archive team at
[email protected]. If you wish to email the authors directly, please see the first page of the publication for their contact information.
NRC Publications Archive
Archives des publications du CNRC
This publication could be one of several versions: author’s original, accepted manuscript or the publisher’s version. / La version de cette publication peut être l’une des suivantes : la version prépublication de l’auteur, la version acceptée du manuscrit ou la version de l’éditeur.
Access and use of this website and the material on it are subject to the Terms and Conditions set forth at
A Comparison of three classical concert halls
Bradley, J. S.
https://publications-cnrc.canada.ca/fra/droits
L’accès à ce site Web et l’utilisation de son contenu sont assujettis aux conditions présentées dans le site LISEZ CES CONDITIONS ATTENTIVEMENT AVANT D’UTILISER CE SITE WEB.
NRC Publications Record / Notice d'Archives des publications de CNRC:
https://nrc-publications.canada.ca/eng/view/object/?id=bf7f26c9-cf79-43b9-b2fc-1749040f50e7 https://publications-cnrc.canada.ca/fra/voir/objet/?id=bf7f26c9-cf79-43b9-b2fc-1749040f50e7S e r
T H 1
.N 2 1 d
National Research
Conseil national
I
.
1 7 0 5
1+1
Council Canada
de recherche5 Canada
Institute for
lnstitut de
Research in
recherche en
Construction
construction
A Comparison of Three Classical
Concert Halls
by J.S. Bradley
Reprinted by
American lnstitute
of Physics
2 October, 1990
pp. 1176-1 192
(IRC Paper No. 1705)
NRCC 32375
NRC-
ClSTlI R C
L I B R A R Y
,!(I[1:
1991
B I B L I O T H E Q U E
1 R C
CNRC-
IClSTL'auteur presente les valeurs de nouvelles grandeurs de l'acoustique des auditoriums
obtenues grace
?ides mesures effectuees dans trois c6lkbres salles de concert classique, le
Concertgebouw dYAmsterdam,
le Grosser Musikvereinssaal de Vienne et le Symphony
Hall de Boston. Les mesures par bandes d'octave ont port6 sur : le temps de dverMration,
le temps d'affaiblissement initial
(EDT),
la force ou le niveau du son, le rapport son initial-
son subshuent, et la fraction d'knergie latQale. L'auteur fait Ctat des valeurs moyennes des
salles pour ce qui est des conditions mesurees en inoccupation, ainsi que des valeurs
estimatives en occupation. I1 examine en detail les variations observCes au niveau des
critkres selon le positionnement du systkme source-recepteur. Les rdsultats aident B
dCfinir
1'Cventail des conditions d'une bonne acoustique dans les salles de concert, et ils montrent
de f a ~ o n
prdcise certaines des differences qui existent entre les salles $tudiks.
A
comparison
of
three classical concert halls
J. S. BradleyInstitute for Research in Construction, National Research Council, Ottawa K I A 0R6, Canada
(Received 20 June 1990; accepted for publication 2 October 1990)
Values of newer auditorium acoustics quantities are presented for measurements in three well- known classical concert halls: the Amsterdam Concertgebouw, the Vienna Grosser
Musikvereinssaal, and the Boston Symphony Hall. The measured octave band quantities included reverberation time, early decay time, sound strength or level, early/late sound ratios, and lateral energy fractions. Hall average values from the measured unoccupied conditions are presented as well as estimated occupied values. The variation of parameters with both source and receiver position is examined in detail. The results help to define the range of conditions that are to be expected in good concert halls, and reveal some of the detailed differences among these halls.
PACS numbers: 43.55.Gx, 43,55.Mc.
INTRODUCTION
Over the past 20 years, concert hall acoustics research has made considerable progress. A review of this literature' has led the author to agree with several others that only four or five parameters are necessary to explain a large part of the variance in subjective preference judgments of hall acous- tics.',"ordan4 has suggested a list of important acoustical parameters and several authors5-' have reported measure- ments of these newer parameters in halls. There have been some very notable suggestions for the use of other auditor- ium acoustics m e a ~ u r e s , ~ but it is not the purpose of this paper to question their validity or to review all the various recent studies in this field. The purpose of this paper is to present the results of measurements, in three well-known concert halls, of a group of five newer objective measures that are widely considered to be related to the principal sub- jective aspects of concert hall acoustics.
Before these new parameters can be used to assess and understand conditions in halls, considerable practical expe- rience is needed measuring these quantities in a variety of types of halls. We have worked on this problem over a num- ber of years: developing improved and more efficient mea- suring systems,'
''
making measurements in a number of and considering the accuracy and repeatability of these parameters.I2 Gade has published measurements in 2 1 Danish hallsi' and more recently a number of other Europe- an halls7 using a quite different measurement system. Barron has made measurements in a number of British hallsI4 using yet another measurement technique. l 5There is still a considerable need for further practical information to help us measure and interpret these quanti- ties in halls. There are a number of questions that require answers. What are typical expected values of the various parameters in particular types of halls? How much within hall variation is to be expected in particular situations? How do values of the acoustical parameters relate to the geometry and materials of the concert hall? Also, what are ideal values of each parameter, and what values are found in our best concert halls? This paper attempts to respond to these ques- tions and to answer the latter by presenting detailed mea-
surement results from three well-known classical halls. It is always difficult to obtain agreement as to which halls are considered to have excellent acoustical characteris- tics, and informal opinions can be very unreliable assess- ments of acoustical conditions. Therefore, this paper pre- sents detailed measurement results from three halls that are almost universally accepted as among the best concert halls in the world. These are the Amsterdam Concertgebouw, the Vienna Grosser Musikvereinssal, and the Boston Symphony Hall. Beraneklh has suggested that the Vienna and Boston halls are the best and second best halls in the world, respec- tively. Certainly few would dispute that all three are excel- lent concert halls, and therefore that the more that we can learn about them, the better we will understand what consti- tutes a good concert hall.
Unfortunately there is very little comparable quantita- tive objective acoustical data for concert halls, and in partic- ular for these three. Where reverberation time values are available, there are often discrepancies between different sets of measurements in the same hall and no details as to the measurement technique. Beranek's well-known book, Mu-
sic, Acoustics and Architecture, l 7 contains a wealth of infor-
mation concerning the architectural details of many well- known halls, but the only acoustical data are reverberation times from a variety of older measurements. Unfortunately this book predates the discovery of the importance of the various newer acoustical parameters, and values of these quantities are only now becoming available.
The purpose of this paper is to attempt to provide a comprehensive objective characterization of three very good classical concert halls. It is hoped that this will help to better define what constitutes a good concert hall and will lead to a better understanding of acoustical conditions in these halls. Where there are differences among the measurements in the three halls, it is in general not possible to say which is a better or more desirable result because there is no comparable sub- jective data.
I. MEASUREMENT PROCEDURES
Measurements in all three halls were made with our RAMSoft1° measurement system using a specially modified 11 76 J. Acoust. Soc. Am. 89 (3), March 1991 0001 -4966/91/031176-17$00.80 1176
and calibrated blank pistol as the impulsive source. The mea- surement system consists of a program running on an IBM PC compatible portable computer interfaced to a Norwegian Electronics type 830 two-channel real time analyzer. The values of 12 different parameters in each of six octave bands
are obtained while in situ at each position in the hall.
The 0.38-calibre blank pistol was modified so that it is a good approximation to an ideal omnidirectional source," and black powder blanks are used to ensure that there is adequate energy in all the octave bands from 125 to at least 4000 Hz.
The real time analyzer is used to capture, ensemble aver- age, and filter the pulse responses, which are then trans- ferred digitally to the computer. Decay times are calculated from least-squares fits to portions of the decay curves ob- tained by the Schroeder backward integration technique.19 Both the classical reverberation time RT, measured over the
decay from - 5 to - 35 dB, and the early decay time EDT,
measured over the first 10 dB of the decay, are measured. Early/late arriving sound energy ratios, C36, C50, and C80 with 36,50, and 80 ms early time intervals, are calculat- ed. C80 values are calculated as follows:
C80 = 10 l o g [ ( ~ 0 x p 2 ( t ) d t )
wherep(t) is the measured pulse response in the auditorium. Other early/late ratios are calculated in a similar manner, but with different early time limits.
The overall strength G is calculated as the ratio of the total measured energy in the pulse response to the energy from the same source at a distance of 10 m in a free field as given in the following equation:
G = l ~ l o g [ ( ~ ~ p ' ( t ) ) ( ~ ~ p : ( t ) d t ) ~ ] , dB, ( 2 )
wherep, ( t ) is the response of the source at a distance of 10 m in a free field.
The program calculates two versions of the lateral ener- gy fraction LF, which is the ratio of the lateral energy re- ceived by a figure-of-eight pattern microphone to the energy measured by an omnidirectional microphone over the first 80 ms of the pulse response. The sensitive lobes of the figure- of-eight microphone were pointed at the side walls so that the null in the directional sensitivity was directed toward a center stage source position. Thus LF values are calculated as follows:
LF =
(Spp:
( t ) dt)(lo'
p'(t) dt)
I, ( 3 )0
wherep, ( t ) is the lateral response from the figure-of-eight microphone. The first integration is sometimes started from 0.005 s rather than 0.0 s. Both variations of LF were calculat- ed and the differences were very small (0.01 or less in the 500-Hz octave band). Only LF values corresponding to Eq.
( 3 ) are included in this paper.
Values of the background noise levels, the center time,' and useful/detrimental sound ratiosh that are related to
1177 J. Acoust. Soc. Am., Vol. 89, No. 3, March 1991
speech intelligibility were also obtained but are not discussed in this paper.
In this paper, octave band values of only five of these parameters are presented because others are either less com- monly used or are usually highly correlated with one of these five parameters. These are RT, EDT, G, C80, and LF. While RT is related to other physical properties of spaces, EDT values are related to subjective judgments of reverberance. G values relate to how loud a given sound source will be in a particular space and hence to the dynamic range that is pos- sible during musical performances. C80 values relate to per- ceived clarity or the balance between clarity and reverber- ance, and L F values are related to the subjective sense of spatial impression or envelopment. In this paper, some further parameters are calculated from these five basic pa- rameters to explore in more detail the strength of the sound arriving in the early and late parts of the impulse responses. In each hall, measurements were made at all the combi- nations of three source positions and between 10 and 14 re- ceiver positions distributed over all audience seating areas. Each measurement was calculated from an ensemble aver- age of four pulse responses. Measurements in the Amster- dam and Vienna halls were made at the same time and at some of the same positions as measurements by A. C . Gade.7
Thusit was possible toconfirm that the two different mea- surement systems produced very similar results.
The architectural details of the halls are not included here, but have been well documented by Beranek.I7 For those completely unfamiliar with these halls, they are all classical rectangular or shoe-box-shaped halls with very small side balconies and slightly larger rear balconies. The Boston hall has the most seats and has two balconies. The Vienna hall is narrower than the others, has fewer seats, and has a rear gallery above the rear balcony. The Amsterdam hall is the widest and has only one balcony level.
11. MEAN UNOCCUPIED VALUES
Mean values of the five basic parameters are first pre- sented. It should be noted that these values and most results in this paper are for the unoccupied conditions that existed during the measurements. Because the seating in these halls is only lightly upholstered, considerable changes would be expected with the presence of an audience. However, most measurements of halls are made under unoccupied condi-
tions and hence such data are most useful for comparison I
purposes.
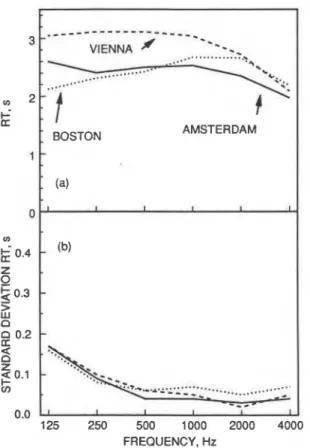
Figure 1 ( a ) shows the overall hall average RT values for the three halls. The Vienna hall, although smaller in vol- ume than the other two halls, is seen to have larger RT values at most frequencies. [The ( b ) part of this and several subse- quent graphs shows the spatial standard deviations of the values. These standard deviations give some indication of
the significance of the differences between the mean values in
-
part ( a ) of these graphs and are discussed further in Sec. I
IV. ]
The hall average EDT values are compared in Fig. 2 ( a ) and these results are quite similar to those of Fig. 1 ( a ) . A comparison of the results of Figs. 1 ( a ) and 2 ( a ) shows that
the difference between mean EDT and mean RT values is
- _ _ - - r - - - -
---_
---
...
'I?
VIENNA f---
-.
-_ --
.'4...
...
'If
BOSTON AMSTERDAIFIG. 1 . ( a ) Hall average and ( b ) spatial standard deviation of measured RT values versus octave band frequency for each hall.
--.
BOSTONI
AMSTERDAM 0.01 ,
,
,
,
1,
J
125 250 500 1000 2000 4000 FREQUENCY, Hzgreatest in the Boston hall. Even in this hall, these differ- ences are quite small and are a maximum of about 0.1 s in midfrequency bands. Some more modern halls have larger differences between EDT and RT value^.^
Figure 3(a) compares hall average G values. Here again, the Vienna hall has the largest values and this is at least partly because of the related larger R T values and smaller volume.
Surprisingly, the Boston hall mean
G
values are differ- ent from the other two halls in that they are lower by up to approximately 4 dB at lower frequencies. This difference inG values is not reflected in a similar magnitude difference in RT values. Later analyses in this paper will attempt to sug- gest a cause for this difference.
Hall average C80 values are compared in Fig. 4(a). There is a tendency for C80 values to be related to R T values, and the Vienna hall with the largest RT values tends to have thelowest CgOvalues. However, theAmsterdamhal1 hasC80 values that are quite similar to those of the more reverberant Vienna hall. Even though the Boston hall has similar RT values to the Amsterdam hall, C80 values are higher in the Boston hall at frequencies from 125 to 500 Hz.
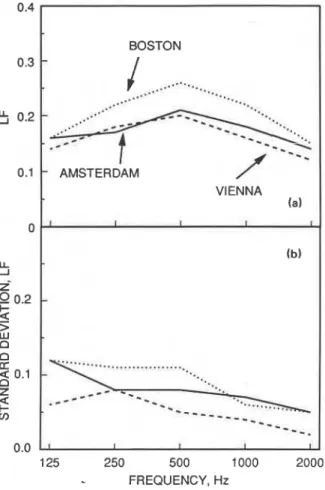
The hall average LF values are presented in Fig. 51a). In this figure, the Boston hall unexpectedly has the highest L F values. It is often assumed that narrower halls will have stronger early lateral energy and that LF values would corre- spondingly be larger. GadeI3 found a correlation between the mean width and mean LF values for 21 Danish halls. Thus it is surprising that the Boston hall has the highest LF
-
VIENNA...
AMSTERDAM ...a*....
BOSTON- ...
(a) - - 125 250 500 1000 2000 4000 FREQUENCY, HzFIG. 2 . ( a ) Hall average and ( b ) spatial standard deviation of measured FIG. 3. ( a ) Hall average and ( b ) spatial standard deviation of measured G EDT values versus octave band frequency for each hall. values versus octave band frequency for each hall.
AMSTERDAM -2
-
BoyN/,...A*..
a\/
...a-_---
*A.-.r.<,.....
..-'
- -
(g
-4--....-..
VIENNA 0--
-
8
-6-.--
FREQUENCY, HzFIG. 4. ( a ) Hall average and ( b ) spatial standard deviation of measured
CXO values versus octave band frequency for each hall.
values and that the Vienna hall that is the narrowest has similar LF values to the Amsterdam hall that is the widest of the three.
While there are many general similarities among the hall average results from the three halls, there are some noteworthy differences. The Vienna hall is most reverberant and, in the Boston hall, the EDT values are a little lower than RT values at midfrequencies. The Gvalues at lower and mid- frequencies are lower in the Boston hall, but the L F values in this hall are higher than the other two halls. There are small differences in C80 values such that the Boston hall has higher values at lower and midfrequencies.
The interhall differences shown in Figs. 1-5 were tested to determine whether they were statistically significant. First, two-way analyses of variance were carried out for each acoustical parameter and in each octave band, with the hall and the source-receiver distance as the independent vari- ables. This type of analysis determines whether the differ- ences between group means are significant relative to the amount of variance within each group. In almost all of the cases (25 out of 30) there is a statistically significant effect of the hall on the mean values. The exceptions are the 4000-Hz octave band EDT, G, and C80 values as well as the 2000-Hz
C80 values and the 125-Hz LF values. For most octave band mean values, except for RT values, there are also significant source-receiver distance effects as well as some interaction effects. These will be considered in more detail in subsequent
BOSTON
-
...
...
....
....
...
....
-
...
....
-.--I--.
-
AMSTERDAM VIENNA (a) I I I I I (b)-
...
...
-
-
-
---_
-
- - -
,.
---.
I 1 I I I 0.0 125 250 500 1000 2000 FREQUENCY, HzFIG. 5 . ( a ) Hall average and ( b ) spatial standard deviation ofmeasured LF values versus octave band frequency for each hall.
sections of this paper.
While these analyses of variance results demonstrate that in general there are significant differences between I
halls, they do not confirm whether particular differences be- tween a pair of halls are statistically significant. Therefore, further analyses were carried out comparing mean values for each pair of halls. The differences in mean octave band RT values shown in Fig. 1 are all statistically significant. Al-
~
though some of these differences are very small, the means
1
are quite accurate because there is very little within-hall vari- Iation of RT values. The differences between pairs of mean octave band EDT values are all statistically significant ex- cept at 4000 Hz, where only one of the three pairs of differ- ences is significant. The differences between pairs of mean octave band G values shown in Fig. 3 are all significant ex-
i
~
cept at 4000 Hz, and the 2000-Hz difference between the Amsterdam and Boston halls.
Only the larger differences between the pairs of octave band C80 and LF values are statistically significant. For C80 values, only 6 of the 18 pairs of differences are statistically - 1
significant. Only 8 of the 18 pairs of differences between LF values are statistically significant.
Overall, most of the between-hall differences shown in Figs. 1-5 are statistically significant. For RT, EDT, and G values, almost all of the differences are significant with only a few exceptions at higher frequencies. For the C80 and LF
values, only some of the larger differences are statistically signifreant. For these latter two parameters, it is not always possible to be sure that there are real differences between halls because of the larger within-hall variation of these pa- rameters. While many of the differences between halls are statistically significant, it is usuaIly not possible to say whether these differences are subjectively important.
ffl. MEAN OGCUPlEb VALUES
It is of obvious interest to compare expected values of the acoustical parameters for occupied conditions in each haI1. Measurements were not made for occupied conditions and therefore the expected effect of an audience must be calculated. As a starting point, RT values for both occupied and unoccupied conditions are required.
RT
values for unoc- cupied conditions have been presented in Sec. 11 above. R T values for occupied conditions are available," but their ac- curacy is not known. Various old RT data for unoccupied conditions do not agree well with each other nor with the new measurements presented here. The present results do agree with the modern results af Gade.' The older results of occupied conditions suggest that the effect of the audience is quite different in these apparently similar halls. It was there- fore concluded that individual older data sets could not be considered to be completely reliable and hence were not wed to estimate occupied conditions.Beranek" presents both occupied and unoccupied RT values for a number of haIls. Schultz2' has fitted linear regression lines to this data so that the average effect ofadd- ing an audience can be easily calculated. These equations were used here to estimate the audience effect on RT values without the unknown irregularities of particular older data sets. Schultz's equations are included in the Appendix be- cause they are not readily available to readers.
It should be mentioned that on average Schuftz's equa- tions relate to more absorptive seats than those found in the present three halls. Thus they are not ideal for the present purpose and would tend to underestimate the effects of an audience, but they were considered to be the best approach available.
The presence of an audience is not expected to change the details of particular early reflections, but only to vary the level of the later arriving sound energy. It is therefore as- sumed that the effect of the audience on other parameters is simply related to the changes in reverberation time that re- sult when an audience is present. This is similar to the ap- proach taken by Barron,' but with a number of differences. Estimated occupied RT values were calculated by sub- tracting Schultz's predicted changes in RT values from the measured RT values in each octave band. Thus
RT,, = R T - DT, s, ( 4 )
where RT is the measured unoccupied reverberation time, RT,, is the estimated occupied reverberation time, and DT is Schultz's estimated change in RT values from the equations in the Appendix. EDT values were assumed to vary in pro- portion to the change in R T values as assumed by Barron.' Thus estimated occupied EDT values were obtained as fol- lows:
EDT, = EDT (RT,/RT), s, ( 5 )
1180 J. Acoust. Soc. Am,, Vol. 89, No. 3, March 1991
where again here and below the "0" subscript signifies occu-
pied values
According to simple diffuse field theory, reverberant sound levels would vary as ten times the logarithm of the ratio of the reverberation times. Barron has pointed out that this is not correct in concert hallsI4 and has proposed his revised theory that more closely predicts measured values. He has estimated the audience effect on G values using his revised theory.' The change to G values predicted by Bar- ron's revised theory can be closely approximated by 16 times the logar~thm of the ratio of the R T values for RT values from 0.7 to 4.0 s. Thus, in this paper, the estimated effect of an audience on G values was calculated as follows:
This variation of G values with reverberation time was veri- fied by comparing it with a plot of mean G values versus mean RT values for data from 11 different large halls.
Barron calculated the effect of an audience on C80 val- ues again using his revised theory. In an earlier paper,5 mea- sured C80 values were found to vary approximately as 13 times the logarithm of the corresponding RT values. This relationship was found to agree very closely with Barron's revised theory and hence was used to calculate the effect of the audience on C80 values as follows:
C80, = C80
+
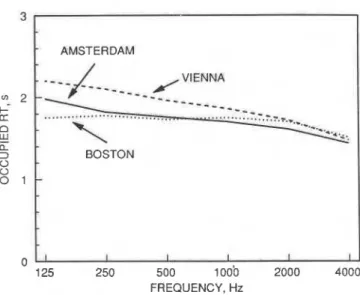
13 IO~{RT/RT,,}, dB. ( 7 ) Because LF values depend only on early arriving sound ener- gy, they were assumed to not be greatly changed by the pres- ence of an audience. Although these estimates of the effect of the audience on each parameter involve some uncertainty, they are thought to be the best possible with the available information. Because the same procedures are applied to all three halls and because the absorptive properties of the seat- ing in the three halls appeared to be similar, the results should at least provide valid comparisons among the halls for expected occupied conditions.Figure 6 compares expected hall average occupied RT values for the three halls. The values are of course lower than
3
-
AMSTERDAMNNA
I
BOSTON
FREQUENCY, Hz
FIG. 6. Estimated hall average occupied RT values versus octave band fre- quency for each hall.
would on average be expected to parallel these EDT values.
Figure 8 compares expected occupied hall average G -2
0
125 250 500 1000 2000 4000the unoccupied values of Fig. 1 ( a ) , and the occupied esti- 6
mates for the three halls are more similar to each other than were the unoccupied values. Thus, when occupied, the three halls would be expected to have very similar RT values, with the values in the Vienna hall being a little larger at frequen- cies up to 1000 Hz.
8
ci
The estimated hall average occupied EDT values in Fig.
7 show a quite similar pattern. For these occupied EDT val-
3
ues, the Vienna hall again has the highest values and the 0
Boston hall is slightly lower than the Amsterdam hall for
frequencies up to 1000 Hz. The midfrequency occupied 0 EDT values for all three halls are approximately in the range
1.8-2.0 s. The perception of reverberance in these halls
values for the three halls. These calculated results suggest that the strength of the sound in the Amsterdam and Vienna halls would be very similar but that it would be weaker in the Boston hall and particularly so at lower frequencies. All oc- cupied G values are 0 dB or greater.
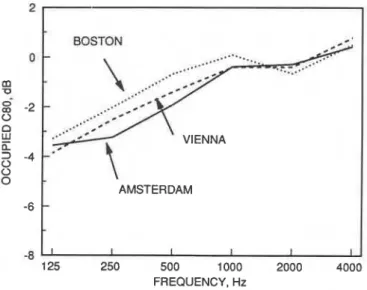
The calculated hall average occupied C80 values for the three halls are compared in Fig. 9. Differences among the results are quite small but C80 values in the Boston hall are slightly higher for octave bands up to 1000 Hz. Results in the Amsterdam hall are slightly lower than for the Vienna hall in the 250- and 500-Hz octave bands. Almost all C80 values are below 0 dB and midfrequency values range approximately from 0 to - 2 dB.
In general, the calculated occupied values indicate that the three halls are very similar in their acoustical properties. Of the three halls, the Boston hall is most different with somewhat lower G values and higher LF values than the other two halls.
AMSTERDAM
'-L/___,
-
- -
---
L C - - - _ _ _ _ _-.
-c-.
- I...
-
...
....
BOSTON ...a.....--
....
...
/
-
.as ...IV. WITHIN-HALL VARIATIONS
A simple measure of the spatial variation in a hall is the standard deviation of values about the hall average value. This standard deviation includes both the seat-to-seat vari-
FREQUENCY. Hz
FIG. 8. Estimated hall average occupied G values versus octave band fre- quency for each hall.
ation caused by moving the receiver as well as the variation caused by varying the source position. Such spatial standard deviation values are first presented to give an overview of spatial variations before considering the individual effects of source and receiver position.
Figure 1 ( b ) compares the spatial standard deviation of measured RT values in the three halls. The three halls have quite similar results and, above the lowest two octave bands, the standard deviations are well below 0.1 s. Thus RT values vary very little throughout these spaces. The spatial stan- dard deviations in this and subsequent figures also give an indication of the significance of the differences between the mean values in part ( a ) of the figure.
The characteristic shape of the curves of Fig. 1 ( b ) is to be expected in reverberant rooms, and Davy2' has shown theoretically that the spatial standard deviation of R T vaiues can be predicted to have this shape. As an example, Fig. 10 compares the measured and predicted results from Davy's
-
AMSTERDAM VIENNA-
BOSTON I I I I 1 I BOSTON...
...
...
0 VIENNA AMSTERDAM-
I I I 1 I bFIG. 7. Estimated hall average occupied EDT values versus octave band FIG. 9. Estimated hall average occupied C80 values versus octave band
frequency for each hall. frequency for each hall.
0
1181 J. Acoust. Soc. Am., Vol. 89, No. 3, March 1991 J. S. Bradley: A comparison of three classical concert halls 1181 -8
125 250 500 1000 2000 4000 1 25 250 500 1000 2000 4000
MEASURED t 0.1 0.05 DAVY
1
DAVY 01
'
I I I I II
125 250 500 1000 2000 4000 FREQUENCY. Hz-
...
MEASURED *. THEORY I I I 1 I I 500 1000 FREQUENCY. HzFIG. 10. Comparison of measured spatial octave band standard deviations FIG. 11. Comparison of measured spatial octave band standard deviations of RT values in the Vienna hall and predictions by Davy." o f G values in the Vienna hall and diffuse field predictions by Lubrnan."
theory with the Vienna hall results. In this hall, there is no systematic variation of these values with source-receiver distance. Although not shown, measured and predicted spa- tial standard deviation values in the other halls were quite similar and again Davy's theory predicted the characteristic increase in spatial standard deviation with decreasing octave band frequency.
The comparison of the spatial standard deviations of measured EDT values in Fig. 2 ( b ) presents a different pat- tern than that found for the RT values. All of the standard deviations are larger than for R T values and the Boston hall standard deviation values deviate from those of the other two halls at frequencies of 1000 Hz and higher. For these high-frequency octave bands, the Boston hall has the largest variation in EDT values while the Amsterdam hall is most homogeneous. Because the spatial variation of EDT values is greater than for R T values, the perception of reverberance will vary more from seat to seat than indicated by RT values. Figure 3(b) compares spatial standard deviations of G values in the three halls. The Amsterdam and Vienna halls have similar spatial standard deviation values that are ap- proximately 1 dB at frequencies above 125 Hz. The spatial variation of G values in the Boston hall is larger and tends to increase with frequency above 250 Hz.
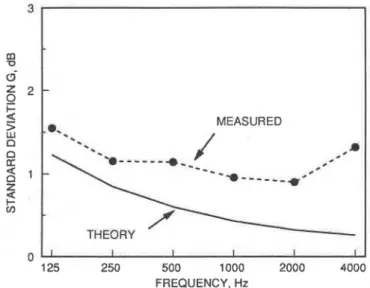
LubmanZ2 has shown how to calculate the expected val- ue of the spatial variance of pressure squared values in an ideal diffuse sound field. chu2' has demonstrated how to extend this to calculating the spatial standard deviation of sound levels in such an ideal sound field. In Fig. 11, the measured spatial standard deviations of G values in the Vien- na hall are compared with these theoretical predictions. Re- sults for the Vienna hall were used because they had very little systematic variation with source-receiver distance. The theoretical standard deviations increase with decreasing measurement bandwidth and decreasing reverberation time. Thus the predicted standard deviations increase with de- creasing octave band frequency due to the decreasing band- width of these filters. While one would not expect a concert
hall to be an ideal diffuse sound field, the measured spatial standard deviations are reasonably close to predictions at lower frequencies and deviate increasingly with increasing frequency. Thus this hall behaves increasingly less like a dif- fuse sound field as frequency increases. This is partly due to the increasing effect of air absorption, but also due to condi- tions simply not being ideally diffuse. The theoretical calcu- lations can at least be considered as a lower bound for con- cert halls and, the more they deviate from this lower bound, the less they behave like a diffuse sound field in this particu- lar respect. Comparison of the Amsterdam hall results with theoretical predictions gave slightly better agreement than that found in Fig. 11, and comparisons for the Boston hall results indicated somewhat less agreement.
The spatial standard deviations of measured C8O values are shown in Fig. 4 ( b ) . For this parameter, the results from the three halls are more similar. From 125 to 500 Hz, the three halls have almost identical spatial variation of CBO val- ues. At the higher octave band frequencies, the Bostoh hall results indicate a little larger spatial variation in these values. Figure 5 ( b ) plots the spatial standard deviations of LF values. There is a trend such that the Vienna hall has the least variation in this quantity and the Boston hall the largest variation. However, the results are a little irregular and vary somewhat with frequency. It is interesting to note that the spatial variations of L F values are quite large when com- pared to the mean values of this quantity in each hall. In some cases, the spatial standard deviation of LF values is as much as 50% of the mean value. By comparison, the spatial variation of RT values is much smaller and is typically only a few percent of the hall mean values at midfrequencies.
Although there are some differences among the halls, which may be attributable to the details of each hall, the spatial variations in these halls show remarkable similarities. In the case of RT values, these spatial variations were shown to agree quite well with theoretical predictions based on the details of the measurement procedure. It is probable that the 1182 J. Acoust. Soc. Am., Vol. 89, No. 3, March 1991 J. S. Bradley: A comparison of three classical concert halls 11 82
similarities among the halls indicate that the spatial varia- tions of the other parameters are similarly limited by the basic physics of the situation. Larger spatial variations have been found in other halls'' and this additional spatial vari- ation is probably due to specific inadequacies of these other halls.
V. EFFECT OF SOURCE POSITION
Although the spatial standard deviation can be used as a convenient single figure of merit concerning the spatial vari- ation within a hall, it is of interest to examine the separate effects of the source and receiver positions. This section con- siders the influence of source position. Mean octave band values of each parameter were calculated by averaging the results at each receiver position for each of the three source positions.
For R T and EDT values, there was very little effect of source position. RT values were essentially the same for all three source positions in all of the halls. A similar pattern existed for EDT values except for some small differences for 125-Hz results. Thus, in all three halls, mean R T and EDT values were essentially independent of the source position.
Small variations of mean G values with source position were observed. In the Amsterdam hall, the source-averaged G values were almost 1 dB lower in all six octave bands for source position S3 than for the other two source positions. This source position was located toward the rear of the or- chestra and toward stage right. The average source-receiver distance for S3, which is 23.3 m, was larger than for the other positions, which were 17.8 and 19.0 m. Thus it appears that the slightly lower levels for this source position may be due to the receivers being on average a little farther from the source. When the early and late arriving sound energy was considered separately for these source-average values, the early and late arriving sound energy was considered sepa- rately for these source-average values, the early energies showed the largest effect of source position. Calculated G80 values, which are the G values of the energy arriving within 80 ms after the direct sound, were approximately 1 dB lower for source position S3. The G(late) values, which are the G values for the sound energy arriving more than 80 ms after the direct sound, exhibited only a very small effect of source position. Thus the small source position effect on the total G values in the Amsterdam hall is probably due to the different average source-receiver distances that most influence the early arriving sound energy. There was no evidence of a source-receiver distance effect in the other halls. Perhaps it is evident in the Amsterdam hall because of its greater width that would relate to weaker side wall reflections, or due to the lack of stage rear wall reflections.
In the Vienna hall, differences in source-averaged values were very small. For the source position that was in the mid- dle of the stage left side of the orchestra, mean values were approximately 0.3 dB higher at lower frequencies with smaller differences at higher frequencies. The cause of these small differences was investigated further and the effects were again largest for the early arriving sound energy. The slightly higher average levels for this source position were due to a less obscured view of receivers in the side balcony on
1183 J . Acoust. Soc. Am., Vol. 89, No. 3, March 1991
the opposite side of the hall and in the side loge under the side balcony. The view of these microphones from the other two source positions was partially blocked by the railing in front of these seats.
The source-averaged G values for the Boston hall were almost identical for all three source positions. There were no risers on the Boston stage when measurements were made. Thus all three source positions were the same height above the stage floor. The risers on the stages of the other two halls led to a variation in source height that had some influence on the screening of the direct sound by railings.
Source-averaged C80 values, like R T and EDT values, did not vary significantly with source position in any of the halls. There were only small effects at 125 Hz in some cases. L F values did exhibit some effect of source position. In the Amsterdam hall, the source position in the center of the stage left side of the orchestra produced on average higher L F values. For this source position, LF values were larger by as much as 0.06 with the greatest differences at 500 Hz. Pre- sumably this position was better situated to direct lateral reflections to the various receiver positions.
Differences among the source-averaged L F values for the Vienna hall were very small and did not follow any par- ticular vattern.
The source position effects on L F values for the Boston hall were larger than in the other two halls. For source posi- tion S2, L F values were approximately 0.1 greater than for the other source positions in the 250- and 500-Hz octave bands. Smaller differences occurred at higher frequencies. In this hall, source position S1 was center stage and S2 and S3 were stage left and stage right, respectively. The stage left source position produced higher L F values at the receivers, which in this case were all on the other side of the hall. Thus, in this hall, there is a tendency for sources to direct early lateral energy preferentially to seats on the opposite side of the hall. This is thought to be due to the shape of the angled side walls of the orchestra enclosure that is unique to this hall. The other two halls do not have any specific orchestra enclosure. In the Boston hall, the side walls of the stage and the ceiling over the stage are angled to direct more energy out to the audience and, as might be expected, this appears to effect the early reflections in this hall.
In general, the effects of source position in these three halls are very small, and this is probably one of many factors that influence the general perception that these are good halls. RT, EDT, and C80 values are not significantly in- fluenced by the position of the source. The small differences in G values appear to relate to the geometry of source and receiver positions but are probably of little practical conse- quence. The source-dependent effects on L F values suggest the influence of the shape of the orchestra enclosure in the Boston hall.
VI. EFFECT OF RECEIVER POSITION
The effect of receiver position was first examined by plotting 1-kHz octave band results versus source-receiver distance in each hall. These plots showed the more impor- tant midfrequency effects. RT values showed virtually no variation with source-receiver distance in these three halls.
1.5
5 10 15 20 25 30 35
DISTANCE, rn
FIG. 12. Measured I-kHz EDT values versus source-receiver distance in the Amsterdam hall. Thedashed line isdrawn so that the horizontal portion follows the mean I-kHz R T value.
However, there were source-receiver distance effects on EDT values that were different for each hall.
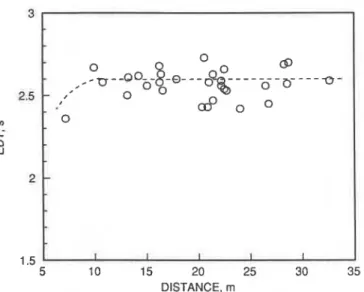
Figure 12 plots I-kHz EDT values versus source-re- ceiver distance in the Amsterdam hall. Here, the EDT values do not indicate any systematic variation with distance. The dashed line in this figure was drawn to follow the mean con- stant trend with distance of the RT values in this hall. The initial curvature was added to parallel the results in the sub- sequent two plots.
Figure 13 plots 1-kHz EDT values versus source-re- ceiver distance in the Vienna hall. Again, the dashed line was drawn to follow the approximate mean trend of the mea- sured values and to level off at the mean RT value at larger distances. There is a more obvious trend for these EDT val- ues to increase with increasing source-receiver distance in
... ... ...'o : 0 0 '..
-
... 0 ,'.-
o*t
BALCONY SEATS-
1 I I Ithis hall to at least a distance of about 20 m. It is also seen that the EDT values for seats in the balcony and gallery are larger than for other seats and are larger than the R T values at these same seats.
The 1-kHz EDT values are plotted versus source-re- ceiver distance for the Boston hall in Fig. 14. In this hall, there is an even more obvious increase of EDT values with source-receiver distance than in the other two halls. EDT values increase in value up to a distance of approximately 30 m. Again, the dashed line has been drawn to follow the mean trend and to level off at the mean value of RT for this hall. This hall is unique among the three in that it has a significant number of seats under a balcony. The results of Fig. 14 show that EDT values tend to be lower at seats that are under the balcony.
The amount of variation of EDT values with source- receiver distance varies among these three halls. This is thought to be due to the variation in the concentration of early energy at the front of these halls. There is a stronger concentration of early energy at the front of the Vienna hall because it is narrower and this leads to stronger lateral re- flections at these closer seats. A similar but stronger concen- tration of early energy occurs at the front of the Boston hall due to the shape of the orchestra enclosure that directs ener- gy to these seats. The effect is minimal or absent in the Am- sterdam hall because of its greater width, lack of a specific orchestra enclosure, and possibly due to the presence of au- dience seating behind the orchestra.
The variations in C80 values with source-receiver dis- tance paralleled those for EDT values, except the effects were inverted. Thus, where EDT values increase with in- creasing source-receiver distance, C80 values decrease with increasing distance. There was in some cases more scatter in the C80 results due to more irregular results at a few seats such as side balcony seats, where in some situations the di- rect sound was partially screened by a railing.
O 0
-
-
- -92w o
--cg
- - -- -
0 ,+)*6-&-
-a
0 ... 0 ,'o ..:. 0 O"....;go
0 : 0 ,; 03:.
I '.. 0 :' I-
0 BALCONY I I I I 2FIG. 13. Measured 1-kHz EDT values versus source-receiver distance in FIG. 14. Measured I-kHz EDT values versus source-receiver distance in the Vienna hall. The dashed live is drawn so that the horiz~nt~al portion the Boston hall. The dashed line is drawn so that the horizontal portion follows the mean I-kHz R T value. follows the mean I-kHz R T value.
1184 J. Acoust. Soc. Am., Vol. 89, No. 3, March 1991 J. S. Bradley: A comparison of three classical concert halls 11 84 1.5
0 10 20 30 40 50 0 10 20 30 40 50
VII. LEVEL DECREASE WITH SOURCE-RECEIVER DISTANCE
The variation of 1-kHz G values with source-receiver distance is illustrated in Fig. 15. To permit clear compari- sons among the results for the three halls, only the best fit regression lines to the measured data are shown. The equa- tions of these regression lines are included in Table I. The actual data points indicated reasonably linear trends with no indication of unusual effects for seats either in or under bal- conies. In all three halls, G values decrease with increasing source-receiver distance. The slopes of these lines vary from
- 0.6, for the Vienna hall, to
-
1.6 dB/ 10 m for the Bostonhall. Larger variations of G values with distance have been
reported. BarronI4 found slopes as steep as - 2 dB/10 m
and Bradley" reported values as great as - 2.6 dB/10 m.
I While the Boston and Amsterdam results exhibit somewhat
similar trends, Gvalues at the farthest seats in the two longer halls, Vienna and Boston, are different by more than 3 dB. Thus the farthest seats in the Vienna hall would receive a louder sound than seats at a similar distance in the Boston hall.
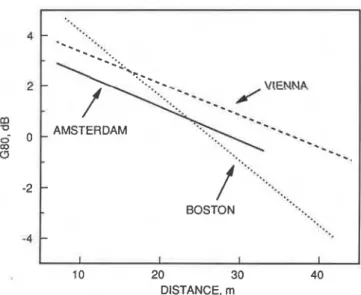
The variation of G values with distance was explored further by considering the early and late components of the G values as well as separately considering the early lateral energy. Figure 16 compares the regression lines fitted to the G8O values that include sound energy arriving up to 80 ms after the direct sound. The equations ofthese regression lines are also found in Table I. The Boston hall G80 values are
largest closer to the source ( 10- to 15-rn distances), but they
decrease more rapidly with distance than in the other two halls. The slopes of the regression lines for the Amsterdam and Vienna halls are almost identical but the Amsterdam hall G80 values are consistently slightly lower. The fact that G80 values are lower in the Amsterdam hall than in the Vien- na hall may be related to its greater width. The different behavior ofthe G80 values in the Boston hall is again thought to be due to the shape of the orchestra enclosure that pro- duces a concentration of early reflections to seats near the front of the hall and consequently less early energy at more distant seats.
This explanation is further supported by the results in Fig. 17, which compares regression lines to measurements of
TABLE I. Regression equations for Gvalues as a function of source-receiv- er distance r in meters. G = - 0.1035 r
+
7.830, dB Amsterdam G = - 0.0616 r+
8.037, d B Vienna G = - 0 . 1 6 3 4 r t 8.651,dB Boston G 8 0 = - 0 . 1 3 2 3 r + 3 . 8 2 8 , d B Amsterdam G 8 0 = - 0.1264 r+
4.360, d B Vienna G 8 0 = - 0.2553 r + 6.718, dB Boston GEL = - 0.2018 r - 2.417, d B Amsterdam G E L = - 0.1357 r - 3.144, d B Vienna G E L = -0.2931 r + 1.017,dB Boston G(late) = - 0.0731 r+
5.227, d B Amsterdam G(late) = - 0.0237 r+
5.366, d B Vienna G(late) = - 0.1008 r + 4.861, d B Boston ''.f--- VIENNAA
--- - - -
--._
J
- - - * _---___
.'...
AMSTERDAM...
-. .
*.. BOSTONI
I t I II
10 20 30 40 DISTANCE, rnFIG. 15. Comparison of best fit linear regression lines t o measured I-kHz G values in each hall.
GEL values, the Gvalues for the early lateral energy arriving
within the first 80 ms after the direct sound. Again, the Bos- ton hall values are larger closer to the source, but they de- crease most rapidly with increasing distance. The Amster- dam and Vienna hall results are very similar but, in the wider Amsterdam hall, GEL values decrease slightly more rapidly with distance. The differences between GEL values from the Boston hall and the other halls, at positions closer to the source, are greater than for G80 values, indicating that a significant portion of the additional early energy in the Bos- ton hall arrives from the side.
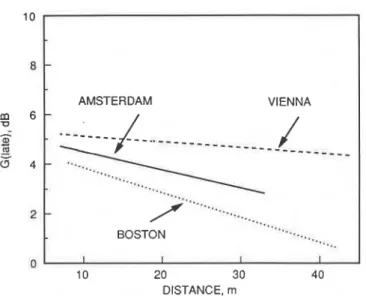
Figure 18 completes the examination of the variation of levels with distance by plotting G(late) values versus the source-receiver distance. These are the G values for the sound energy arriving more than 80 ms after the direct sound. These values are more similar to the total G value data in Fig. 15, indicating that the late arriving energy is the
-- -
10 20 30 40
DISTANCE, m
FIG. 16. Comparison of best fit linear regression lines to measured I-kHz G80 values in each hall.
major component of the total sound energy. Again, there are 10
differences in the slopes of these regression lines varying from
-
0.2 dB/10 m for the Vienna hall to - 1.0 dB/10 mfor the Boston hall. The regression equations are given in 8 Table I. The G(late) values closer to the source are very
similar in all three halls, but further away there are differ-
m,
6ences of up to several decibels.
-
The results of Figs. 16 and 18 and Table I also show that
-
2
early sound levels (G80 values) drop off more rapidly with 4distance than the late energy levels. Thus the attenuation of the overall Gvalues with distance will depend on the portion
of the total sound energy that arrives within the first 80 ms 2
after the direct sound.
VIII. MEASUREMENT AND PREDICTION OF LEVELS 0 10 20 30 40
-
AMSTERDAM VIENNA---______--_---
-
...
BOSTON-....
-...
'..I_ I I I IThe strength or sound level is perhaps the most impor- DISTANCE, m
tant basic quantity, other than reverberation time, that one
FIG. 18. Comparison of best fit linear regression lines to measured I-kHz
might try to predict in a concert hall. One can estimate ex- G(late, values in each hall, pected sound levels from simple diffuse field theory.
S P L = S W L + 1010g[Q/(4rr') +4/A], dB, ( 8 ) where SPL is the measured sound-pressure level, SWL is the source sound power level, Q is the directivity factor of the source, and is 1 for an omnidirectional source, r is the source-receiver distance, m, and A is the total sound absorp- tion, m'. The total sound absorption A can be calculated from the measured RT values using the Sabine reverberation time equation. Thus the total G value calculated from these assumptions would be given by
G = 10 l o g [ Q / ( 4 r r ' )
+
4 RT/(0.161 V ) ]+
31, dB, ( 9 )where V is the room volume, m'.
Barron has pointed out l 4 that this simple approach does
not accurately predict measurements in concert halls. In particular, the simple diffuse field theory predicts that sound levels will be relatively constant throughout most of a large hall. Measured levels in even the present very reverberant
-
BOSTON-
-
*-.
-
AMSTERDAM *.-.
-
I I I Iclassical halls decrease with increasing source-receiver dis- tance. Barron accordingly proposed his revised theory to more accurately predict sound levels in concert halls.
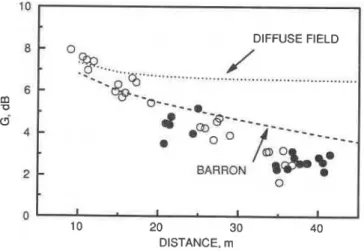
The variation of sound levels with distance in each of the present three classical halls is compared with both the simple diffuse field theory and Barron's revised theory in Figs. 19- 2 1. The open circles in these plots represent measurements at main floor seats and the filled circles represent results from balcony seats. In all three halls, the simple diffuse field theo- ry is not a very accurate predictor of measured results and tends to overpredict measured values at all but a few closer seats. Barron's revised theory presents a reasonable approxi- mation to the mean trends of the measured data and would be a useful procedure for predicting sound levels in these three halls.
A more detailed examination revealed differences indi- cating that, although Barron's revised theory is a consider-
1 186 J. Acoust. Soc. Am., Vol. 89. No. 3. March 1991 J. S. Bradley: A comparison of three classical concert halls 11 86 -2 -4
8
i -6 W 0 -8 -1 0 -12 0 10 20 30 40 50 DISTANCE, rn DISTANCE, rnFIG. 19. Comparison of measured I-kHz G values versus source-receiver FIG. 17. Comparison of best fit linear regression lines to measured I-kHz distance in the Amsterdam hall with predicted values by simplediffuse field G E L values in each hall. theory, and Barron's revised theory.''
8 6 m '0 <j 4 2 0 DIFFUSE FIELD - O 0..
.
a/
.-.
B's~...
...-
l 'a-*..
-
%(go9
a=----9-Q---
-
*--
j - - -
- - _
-
BARRON I I I I 10 20 30 400 10 20 30 40 DISTANCE, rn DIFFUSE FIELD
... ...
-
-
-0....
J
- a - ~ - - - 9 ~ . - ~ --
Q
o"
0 0----__
0-
BARRON-
I I I Idicts them at more distant seats. This seems to be largely due to a similar but larger effect with G80 values in this hall. Again, this may be due to the shape of the orchestra enclo- sure in this hall that tends to concentrate early energy at seats closer to the stage.
Diffuse field theory is thus again confirmed to be inade- quate for concert halls and Barron's revised theory is seen to be a considerable improvement. A further improved predic- tion procedure may require the inclusion of the details of the geometry and materials of each hall such as is possible using computer ray tracing techniques.
IX. FREQUENCY-DEPENDENT EFFECTS AS A
FUNCTION OF SEAT POSITION
FIG. 20. Comparison of measured I-kHz G values versus source-receiver distance in the Vienna hall with predicted values by simple diffuse field the- ory, and Barron's revised theory."
able improvement, there may be factors that it does not in- clude. His revised theory allows one to calculate separately the early and late arriving energies as well as the total sound level or G value. In the case of the Vienna hall results in Fig. 20, the data points suggest, for source-receiver distances greater than approximately 15 m, that G values show no further systematic decrease with distance. Barron's revised theory predicts a continuing small decrease with increasing distance. Both the measured G( late) and G80 values seem to exhibit this same trend to vary less with distance than pre- dicted by Barron's theory.
The Amsterdam hall results have several irregularities in the G values of Fig. 19 due to the effects at particular side balcony seats. These were more pronounced for the G80 val- ues, and appear to be due to the particular direct sound paths to side balcony seats. For this hall, Barron's theory tended to
underpredict the G(1ate) values by approximately 1 dB.
In the Boston hall results of Fig. 21, Barron's revised theory underpredicts G values at closer seats and overpre-
DIFFUSE FIELD
-
0J
...
-
-
m --.-
BARRON*
0 0 10 20 30 40 DISTANCE, rnFIG. 21. Comparison of measured I-kHz G values versus source-receiver distance in the Boston hall with predicted values by simple diffuse field the- ory, and Barron's revised theory."
The results in the previous sections have concentrated on the within-hall variation of midfrequency values. In this section, the variation with frequency of G values in the three halls is discussed. It is desired to examine the average behav- ior of G values versus frequency in different seating areas without the particular details of individual seats. Thus, in each hall, the main floor measurement positions were grouped as "near," "mid," or "far" seats, depending on their distance from the stage. Average G values were then calcu- lated by averaging over the results for all three source posi- tions and all seats in each group. Similar group averages were calculated for balcony seats.
It is well known that the sound passing at grazing inci- dence over audience seating is strongly attenuated at partic-
ular low f r e q u e n ~ i e s . ~ ~ . ~ ~ This effect can preferentially at-
tenuate early low-frequency energy as measured by G80 values and also influence the ratio of early/late arriving sound energy, C80 (see Ref. 6). This effect is smaller in the present three halls than in some other halls,26 and the effect varies among these halls and between seating areas in the same hall.
Figure 22 compares G80 values for main floor seats in the Amsterdam and Vienna halls. In each case the three lines on this graph for each hall correspond, in order of decreasing G80 values, to near, mid, and far seats, respectively. Of these two halls, the G80 values at the main floor seats of the Am- sterdam hall vary less with position. At all three seating areas, there is evidence of a seat dip attenuation, which is greatest at 125 or 250 Hz. (It is assumed that Gvalues would increase below 125 Hz as indicated by previous measure-
m e n t ~ . ~ ~ . ~ ~ ) These dips in the Amsterdam hall results are
quite broad but quite shallow and never exceed 3 dB below the maximum G80 values. The greatest difference for the Vienna hall results is the higher G80 values at the near seats, where the seat dip attenuation is limited to the 125-Hz oc- tave band. This excess of early energy at these seats was seen
to produce smaller EDT values at these same seats in SEC.
.
VI above. For all three seating areas, the seat dip attenuation is again quite shallow.
Figure 23 compares G(1ate) values versus frequency for the three seating areas in the Amsterdam and Vienna halls. These results exhibit a different characteristic shape than found for the G80 values. The G(Late) spectra tend to be relatively flat with an increase sometimes at 125 Hz and a decrease always at 4000 Hz. The high-frequency reduction
1 - - -
-
0 I #-
.
.*
FAR-
I I 1 I I L . - - --
* * - - - _ _ " * -.--
FAR-
I I I I I I -6 0 125 250 500 1000 2000 4000 125 250 500 1000 2000 4000 FREQUENCY, Hz FREQUENCY. HzFIG. 22. Comparison of mean octave band GXO values by main floor seating FIG. 24. Comparison of mean octave band G values by main floor seating area in the Amsterdam hall (solid lines) and the Vienna hall (dashed lines). area in the Amsterdam hall (solid lines) and the Vienna hall (dashed lines). The curves correspond to near, mid, and far seats. The curves correspond to near, mid, and far seats.
at 4000 Hz is caused by increased air absorption at this fre- quency. In the Vienna hall, the G(1ate) values consistently decreased with increasing distance from the stage and so the three dashed curves in Fig. 23 are for near, mid, and far seats in order of decreasing G(1ate) value. The Amsterdam hall results were more irregular and the mid seats had slightly larger G(1ate) values than the other seats. However, the near seats did have slightly larger G(1ate) values than the far seats.
When the early and late arriving sound energy is com- bined, the total Gvalues are obtained, as illustrated in Fig. 24 for the Amsterdam and Vienna halls. Here, the curves for each hall decrease with increasing distance from the stage, except for a small irregularity in the low-frequency results of the Amsterdam hall. The results are very similar for the two halls except for values that are a little larger at the near seats
in the Vienna hall. This increase is due to the higher G 80 values at these seats. It is quite remarkable how flat these spectra are. Even including the small decrease at 4000 Hz, all of these spectra are flat within approximately f 1 dB. Thus
one would expect that these halls do not greatly change the spectrum of the musical sounds that are radiated from the stage. This characteristic is not found in all halls, and would be modified by the presence of an audience.
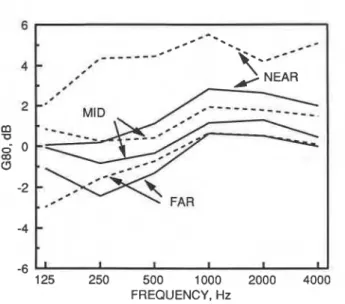
The G values from the Boston hall have not been includ- ed in these plots because the Boston results are a little differ- ent and because it is difficult to compare three sets of curves on a single plot. Figure 25 plots the total G values versus frequency for four main floor seating areas in this hall. These are labeled near, mid, far, and under in order of increasing distance from the stage. The under results are the farthest from the stage and were obtained at seats that were under the
1
NEAR 0'*- MID... ...
...
....
C-..-
...
-
. - - - *.
...
../.
...
-
-0...
. . . a . UNDER-
0t
..0.. =*..@-.#
I I 1 t I 1 0 1 1 I I I 1 I -2 125 250 500 1000 2000 4000 125 250 500 1000 2000 4000 FREQUENCY, Hz FREQUENCY, HzFIG. 23. Comparison of mean octave band G(late) values by main floor FIG. 25. Comparison of mean octave band G values by main floor seating seating area in the Amsterdam hall (solid lines) and the Vienna hall area in the Boston hall. The curves correspond to near, mid, far, and under (dashed lines). The curves correspond to near, mid, and far seats. seats. Under seats were farthest from the stage and under the balcony. 1188 J. Acoust. Soc. Am., Vol. 89, No. 3, March 1991 J. S. Bradley: A comparison of three classical concert halls 11 8 8