Publisher’s version / Version de l'éditeur:
Canadian Journal of Civil Engineering, 17, 5, pp. 752-762, 1990-10
READ THESE TERMS AND CONDITIONS CAREFULLY BEFORE USING THIS WEBSITE. https://nrc-publications.canada.ca/eng/copyright
Vous avez des questions? Nous pouvons vous aider. Pour communiquer directement avec un auteur, consultez la première page de la revue dans laquelle son article a été publié afin de trouver ses coordonnées. Si vous n’arrivez pas à les repérer, communiquez avec nous à [email protected].
Questions? Contact the NRC Publications Archive team at
[email protected]. If you wish to email the authors directly, please see the first page of the publication for their contact information.
NRC Publications Archive
Archives des publications du CNRC
This publication could be one of several versions: author’s original, accepted manuscript or the publisher’s version. / La version de cette publication peut être l’une des suivantes : la version prépublication de l’auteur, la version acceptée du manuscrit ou la version de l’éditeur.
Access and use of this website and the material on it are subject to the Terms and Conditions set forth at
The Strength and testing of window glass
Dalgliesh, W. A.; Taylor, D. A.
https://publications-cnrc.canada.ca/fra/droits
L’accès à ce site Web et l’utilisation de son contenu sont assujettis aux conditions présentées dans le site LISEZ CES CONDITIONS ATTENTIVEMENT AVANT D’UTILISER CE SITE WEB.
NRC Publications Record / Notice d'Archives des publications de CNRC:
https://nrc-publications.canada.ca/eng/view/object/?id=30b79413-1738-4253-b4e2-b5ac235ad70b https://publications-cnrc.canada.ca/fra/voir/objet/?id=30b79413-1738-4253-b4e2-b5ac235ad70bSer
TH1
. -N21d
National Research
Conseil national
no. 1673
$1
c.2
ouncil Canada
de recherches Canada
BLDG.
Institute for
lnstitut de
---
-
-Research in
recherche en
Construction
construction
The Strength and Testing of Window Glass
by W.A. Dalgliesh and D.A. Taylor
Reprinted from
Canadian Journal of Civil Engineering
Vol. 17, No. 5
October 1990
p. 752-762
(IRC Paper No. 1673)
Abstract
This paper presents some of the background to the new Canadian General Standards Board (CGSB) standard on the structural design of glass for buildings. It also describes strength testing of window glass at the Institute for Research in Construction of the National Research Council of Canada using three quite different testing machines. (i)
A
dynamic glass testing rig, with a large 2.35 m diameter piston, applies dynamic air pressures to large panes of glass in the vertical position. Results of 107 tests to failure show the considerable effect of loading rate on strength. (ii) A loading table applies linearly increasing pressures to panes of glass in the horizontal position. Results from 47 fifteen-year-old windows confirm assumptions about the deterioration of strength with in-service use of the new CGSB standard on the structural design of glass for buildings. (iii) A ring-on-ring tester applies linearly increasing loads to small 180 x 180 mrn samples; the equivalent of coupon tests for steel or cylinder tests for concrete. The resulting uniform tensile stress fields avoid failures starting at the edges of the samples. Some results are given. Testing provides the basis for the structural design of glass cladding as it does for other structural materials. A great deal more testing of window glass is required.Key words: glass strength, window strength, testing, strength deterioration, rate effect, dynamic loading.
Ce document expose le contexte general d'elaboration de la nouvelle norme de l10ffice des normes genbrales du Canada (Ongc) concernant la conception structurale du verre destine aux biitiments. I1 dkrit aussi le contrale de la resistance des vitres effectuk l'Institut de recherche en construction du Conseil national de recherches du Canada B l'aide de trois appareils fort differents. (i) Un appareil de contrdle dynamique du verre comportant un gros piston de 2,35 m de diametre applique des pressions d'air dynamiques B de grandes vitres en position vertical. Les ksultats de 107 essais jusqu'a rupture revelent l'effet considerable de la vitesse de
mise
en charge sur la rkistance. (ii) Une table demise
en charge applique des pressions augmentant linbairement sur des vitres en position horizontale. Les resultats des essais effectuks sv* " ' - =theses formul6es dans la nouvelle norme de l'Ongc c biitiments, concernantla diminution de la rkistano u sur anneau applique
une charge augmentant line) : Nquivalant de l'essai
de compression simple pou champs uniformes de
contrainte de traction qui ards de 1'6chantillon.
Certains resultats sont e x r -
conception
structuraledes fapdes de verre, corn ~udrait faire beaucoup
plus d'essais dans le d o m Mots c l k : resistance du vitesse, mise en charge d y
The strength and testing of window glass1
W. ALAN DALGLIESH AND DONALD A. TAYLORInstitute for Research in Construction, National Research Council of Canada, Ottawa, Ont., Canada KIA OR6 Received August 4, 1989
Revised manuscript accepted March 26, 1990
This paper presents some of the background to the new Canadian General Standards Board (CGSB) standard on the struc- tural design of glass for buildings. It also describes strength testing of window glass at the Institute for Research in Construc- tion of the National Research Council of Canada using three quite different testing machines. (i) A dynamic glass testing rig, with a large 2.35 m diameter piston, applies dynamic air pressures to large panes of glass in the vertical position. Results of 107 tests to failure show the considerable effect of loading rate on strength. (ii) A loading table applies linearly increasing pressures to panes of glass in the horizontal position. Results from 47 fifteen-year-old windows confirm assumptions about the deterioration of strength with in-service use in the new CGSB standard on the structural design of glass for buildings. (iii) A ring-on-ring tester applies linearly increasing loads to small 180 x 180 mm samples; the equivalent of coupon tests for steel or cylinder tests for concrete. The resulting uniform tensile stress fields avoid failures starting at the edges of the samples. Some results are given. Testing provides the basis for the structural design of glass cladding as it does for other structural materials. A great deal more testing of window glass is required.
Key words: glass strength, window strength, testing, strength deterioration, rate effect, dynamic loading.
Ce document expose le contexte gknkral d'klaboration de la nouvelle norme de I'Office des normes gknkrales du Canada (Ongc) concernant la conception structurale du verre destink aux biitiments. I1 dkrit aussi le contrBle de la resistance des vitres effectue h 1'Institut de recherche en construction du Conseil national de recherches du Canada h l'aide de trois appareils fort diffkrents. (i) Un appareil de contrBle dynamique du verre comportant un gros piston de 2,35 m de diamttre applique des pressions d'air dynamiques h de grandes vitres en position verticale. Les resultzits de 107 essais jusqu'h rupture rkvtlent 1'efPet considerable de la vitesse de mise en charge sur la rksistance. (ii) Une table de mise en charge applique des pressions augmentant lintairement sur des vitres en position horizontale. Les rksultats des essais effectuks sur 47 fenetres vieilles de 15 ans confirment les hypothkses formulkes dans la nouvelle norme de l'Ongc visant la conception structurale du verre destint aux bltiments, concernant la diminution de la rksistance avec les annees de service. (iii) Un essayeur anneau sur anneau applique une charge augmentant linkairement sur des kchantillons de 180 x 180 mm; c'est l'huivalent de l'essai de compres- sion simple pour le bkton ou de l'essai de traction pour l'acier. Les champs uniformes de contrainte de traction qui en rksultent evitent une fissuration partant des bords de l'khantillon. vertains resultats sont exposks. L'expkrimentation constitue le fondement de la conception structurale des fa~ades de verre, comme dans le cas de autres matkriaux de construction. II
faudrait faire beaucoup plus d'essais dans le domaine des vitres. - -
Mots cl6s : resistance du verre, rksistance des fenetres, essais, diminution de la rtsistance, effet de la vitesse, mise en charge dy namique.
Can. J. Civ. Eng. 17, 752-762 (1990)
Introduction
Structural testing is a necessary part of the development of methods for the design of window glass. Glass, in this regard, is no different than other materials such as concrete, steel, timber, and masonry. Understanding their properties and behaviour required a great deal of testing and field observation over many years, and the research continues. Similarly, test- ing of window glass defines its properties and strength, includ- ing deterioration of strength with use. Field and laboratory studies of the behaviour of windows and glass curtain walls are required for the satisfactory application of glass in buildings. In addition to providing a view, glass acts structurally as a cladding material to separate the internal and external environ- ments. As cladding, it is subject to building code require- ments. Clause 5.7.1.2 of the 1990 National Building Code of Canada (NBC) requires glass to be designed to resist the loads specified in the Code (Sect. 4.1) and installed according to good engineering practice. Many engineers and architects know little about the design of glass for buildings. Typically, NOTE: Written discussion of this paper is welcomed and will be received by the Editor until February 28, 1991 (address inside front cover).
'NRC No. 32341.
Printed in Canada 1 Imprim6 au Canada
they compute the wind (and snow) loads, but the advice of others (glass companies) is commonly sought for the appropri- ate type and thickness of glass for the building.
The first comprehensive Canadian treatment of the struc- tural design of window glass was released by the Canadian General Standards Board (CGSB) in December 1989. Requested by the Associate Committee of the National Build- ing Code, Structural Design of Glass for Buildings2 repre- sents 6 years of teamwork by researchers, designers, and industry experts in both Canada and the United States. Its ori- gins actually go back 20 years, to a synthesis by W. G. Brown at the National Research Council of Canada (NRC) of several failure theories as well as tests to failure of small and large windows (Brown 1969, 1974). He explained apparent dis- crepancies among the tests and proposed a design procedure. Beason (1980) and Beason and Morgan (1984) developed Brown's approach into the failure prediction model used in the CGSB standard.
CGSB 12.20-M89, "Structural Design of Glass for Build- ings," gives tables of annealed glass resistance to lateral pres- 2Standard CGSB-12.20-M89 "Structural Design of Glass for Buildings." Denoted in the text as the Standard or the CGSB standard.
DALGLIESH AND TAYLOR 753
sure as a function of area and shape for rectangular panes simply supported on four edges. The recommended glass strengths, computed by the failure prediction model, are sig- nificantly lower on average (about 30%) than indicated by tests of new glass because of allowances made for the loss of glass strength with in-service use. The CGSB committee, in concert with a U.S. committee working on an ASTM standard for glass design, agreed that design should be based on the reduced strength of glass after some years of normal use.
Test results available from around the world refer to about 5000 panes broken in total (Orr 1957; Bowles and Sugarman 1962; Hershey and Higgins 1973; Ishizaki et al. 1974; Jonsson 1977; Abiassi 1981; Johar 1981, 1982; Krall et al. 1981; Norville and Minor 1985; Kanabolo and Norville 1985). Of
' these, only about 500 involved glass exposed to service condi-
tions in buildings (Norville and Minor 1985). The lower strength found in tests of in-service glass can be related to sur- face damage from normal aging and weathering and is reflected in the parameters used to fit the failure prediction model to experimental data.
Another feature of the CGSB standard is that it explicitly addresses the difference between fluctuating wind pressures and the 1-min constant pressure commonly used to describe glass strength. The dependence of glass strength on load dura- tion had to be specified before the failure prediction model could be fitted to data from tests to failure at different loading rates, and before it could be used to predict resistance to wind effects.
This paper describes the tests aimed at relating loading rate and strength (Johar 1981, 1982) and discusses the fit of the failure prediction model to the data. It also presents additional new data on in-service glass strength. Small sample tests using concentric rings are explored as an economical way of adding to the data base, and other research needed to improve the Standard is recommended.
The main purpose of the paper is, however, to explain some of the background testing and theory used to develop the new Standard (without attempting an authoritative discussion). Further, it aims to describe testing and testing machines used in research at the Institute for Research in Construction (IRC) of the National Research Council of Canada in support of the Standard and in support of the construction industry's needs for more information on window glass.
Mechanical properties of glass
Glass is an inorganic product of fusion that has been cooled to a rigid condition without crystallization. Most architectural glazing is soda-lime glass: silica sand 72%, soda and potash 13 % , lime 1 1 % , magnesia 3 % , and alumina 1 %
.
The compo- nents are mixed with broken waste glass for better heat trans- fer and heated to 1500°C. Almost all flat glass is now "float glass" formed by floating it on molten tin, a process invented 30 years ago. For ease in cutting, after the temperature drops to 550°C, further cooling is controlled to minimize residual surface stresses, producing annealed float glass. After cutting to size, glass plates may be reheated and then their surfaces "set" by rapid cooling for a short time with many air jets. The central core cools more slowly, putting the hardened surfaces into compression and the core into tension. The result is heat strengthened or prestressed glass, which is much stronger thanratio is about 0.22, elastic modulus 70 000 MPa, and, from theoretical considerations, tensile strength should be around 14 000 MPa. In fact, the nominal tensile stress at failure under practical engineering conditions is well below 70 MPa. Sub- microscopic flaws, randomly distributed over the surface, grow slowly under tensile stress (stress corrosion) until a criti- cal level is reached at some particular flaw, at which point cracks propagate at speeds of up to 2000 mls. The number of cracks formed increases with the amount of elastic energy stored in the glass just before failure.
~ n ~ i n e e r i n g strength of glass depends on the interaction between tensile stress and surface flaws normally invisible to the naked eye. Stress corrosion exacerbates the flaws under conditions of moisture and tensile stress. The experimentally verified consequences of surface flaws and stress corrosion are variation in strength of 20 -25 %; strength reduction approxi- mately as the 117th power of surface area; strength decrease approximately as the 1116th power of load duration under a constant load; and strength loss as glass weathers and ages.
Stress corrosion can be suppressed, and flaw severity con- trolled under laboratory conditions. For windows in normal use, polymer coatings have been proposed to prevent moisture from entering the micro-flaws (Michalske and Bunker 1987), but the most common surface treatment to raise the threshold for occurrence of surface tensile stress is heat strengthening or even full tempering. Full tempering is not always favoured because there is some loss of flatness, and some possibility of spontaneous breakage, i.e., failure internally generated by impurities such as nickel sulfide inclusions within the glass. Flaw growth due to stress corrosion is inhibited as long as ten- sile stresses (induced thermally or by bending) are less than the residual compressive stresses left by heat treatment.
For design, a theoretical framework is required. A theory based on stress corrosion is a key to handling fluctuating pres- sures, such as wind loads. Combined with Weibull's theory (1939) on the strength of brittle materials, the decrease in strength with increasing load duration can be described by a damage criterion for failure.
Dependence of glass strength on loading duration and rate
Tests to failure of both small and large specimens of glass show strength decreasing with increasing duration of constant load. Stress corrosion explains the effect of fluctuating pres- sures as well as load duration and the varying loading rates used in different tests. One way of describing the duration or rate effect is to fit a straight line by least squares to a logarith- mic plot of failure stresses, s f , vs. times to failure, tf:
where C1 is a constant.
Of particular interest is the second fitting parameter n, con- sistently found to be 16 or 17 for soda-lime glass in small specimen tests, and in many tests of large panels as well. Some large panel tests indicated larger values, and hence a weaker dependence on load duration (Ishizaki et al. 1974). As n plays a key role in the practical application of the failure prediction model on which the CGSB standard is based, further tests were done to resolve this uncertainty about the rate effect for large panels. Before describing those tests, the role of n in adjusting for differing load histories is discussed briefly. annealed glass. Brown 's damage criterion
I Glass under load deforms elastically until sudden failure is Brown's design procedure (1969, 1974) includes a simple
754 CAN. J . CIV. ENG. VOL. 17, 1990
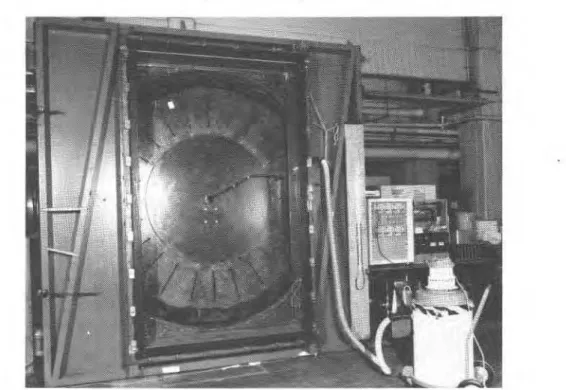
FIG. 1. Front view of dy the glass will be installed.
4
FIG. 2. Side view of the dynamic glass testing rig showing the door open, the large piston, and the controller on the right.
of micro-flaws under tensile stress. If the stress at a particular reduces to the following expression of load duration effect: flaw is given by a function of time, s(t), then failure is
assumed to be imminent at time
*
when the integral of r(t) [3] P60 = Pr[$]'raised to the nth power reaches a critical value:
where P f is the constant pressure causing failure after tf s and
[21 &it =
1:
[s(t)ln dt P60 is the constant pressure causing failure after 60 s. P60 isthe "equivalent 60-second pressure" commonly specified for
DALGLIESH AND TAYLOR
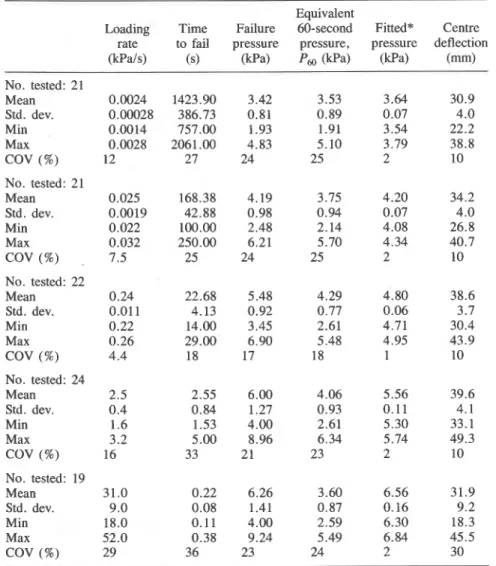
TABLE 1. Test results for 107 panes of new glass 1524 x 2438 mm loaded to failure at five loading rates
Equivalent
Loading Time Failure 60-second Fitted* Centre rate to fail pressure pressure, pressure deflection O<Pa/s) (s) (Wa) Pa (Wa) (Wa) (mm) No. tested: 21 Mean Std. dev. Min Max
cov
(%) No. tested: 21 Mean Std. dev. Min Maxcov
(%) No. tested: 22 Mean Std. dev. Min Maxcov
(%) No. tested: 24 Mean Std. dev. Min Maxcov
(%) No. tested: 19 Mean Std. dev. Min Maxcov
(%)*Fitted means: 5.90 kPa/(time to failure, s)0-067 found by log-log least-square fit (Fig. 3). Expo- nent for load duration effect on pressure is 110.067 = 14.9.
Structural testing to determine glass strength requires pre- ferably 20 - 30 specimens; the strongest in a group of 20 could easily be more than twice as strong as the weakest. Conse-
I
quently, it is impractical to apply the same constant load to all and wait for each to break. For n = 16, if the weakest pane broke after 60 s, [3] indicates that the time to failure for one
I twice as strong would be 45 days.
Pressures increasing linearly with time until failure are more convenient for load tests, but unless stress is linearly propor- tional to pressure, it is not permissible to substitute pressure for stress as in [3]. A linear relation between pressure and stress is unlikely, since glass in windows deflects more than its thickness under lateral loads causing failure; large deflection theory applies and membranes stresses are mobilized. The damage criterion does, however, also provide an expression for load duration effect in terms of linearly increasing stress:
where Sm is the constant stress causing failure in 60 s.
Brown suggested that near failure, stress can be represented approximately by a power law function of pressure. Stress in [2] and [4] can then be replaced by pressure, but a different value of n will apply.
The damage criterion was used by Dalgliesh (1980) to con- vert randomly varying wind pressures to equivalent 60-second loads. The object was to make a rational connection between wind load assessment and glass selection procedures. About the same time, finite element and finite difference methods were used to compute the relation between pressures and sur- face stresses as a function of plate geometry (Moore 1980; Beason 1980). With these analytical methods as incentives, financial support was found for IRC to conduct large-scale tests to verify loading rate effects (and define n), but, first, equipment to do the testing was required. With some foresight it had already been procured.
Design of IRC's dynamic glass testing rig
Between October 1977 and April 1979, the Ontario Research Foundation designed and built for the Institute for Research in
756 CAN. J. CIV. ENG. VOL. 17, 1990 1. 6 0.1 1 1 0 1 0 0 1 0 0 0 TIME T O FAILURE, s 1 I I I I I I I 1 *
.
# m '1;7:,
a t-
\
f
* \1
ILEAU SQUARES LINE:
3
+
-.SLOPE
-
0.067.
-f
-- - I I I I I I J I I
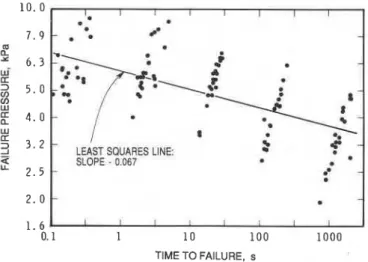
FIG. 3. Effect of loading rate. Strength of glass plates decreased as loading rate decreased (i.e., as load duration increased).
Construction of NRC, first a small prototype, then a full-sized glass testing machine (Stournaras 1979). Its initial use was to study the effect of loading rate on the strength of window glass. The glass is loaded by evacuation of air and in order to ensure fast and uniform loading, a big sealed piston 2.35 m in diameter and 300 mm thick forms most of the back face of the rig and generates the vacuum (Fig. 1). For safety, at rupture the glass is sucked in towards the rig. Initially a hydraulic cylinder controlled by an electric servomechanism retracted the big piston. In 1988, however, a large hydraulic pump with electronic controller was installed which can also drive the large piston back and forth, up to 75 mm each way, applying alternating pressures if required. The pressure variations can be sinusoidal, square wave, or triangular and can be applied at many different rates. The large piston rides on an impervi- ous inflatable seal which reduces friction and prevents leakage.
The glass panels are mounted vertically on glazing tapes or in their frames in the 3 X 3 m front face of the rig. The face is hinged at one side and can be opened like a door (Fig. 2) to gain access to the interior. The "door" was built to take 1524 x 2440 mm windows but has been modified for 1524 x 1524 mm sizes also and can be changed to accommodate other sizes up to 3
x
3 m and perhaps beyond. It can also take other types of cladding including roofing materials.The maximum negative pressure applied by the machine during commissioning in 1979 was 18 kPa. Loading rates applied during the initial testing ranged from 0.0025 to 55 kPa/s. These rates were sustained to failure of the glass
-
0.25 s to 30 rnin. The next section describes the initial and other tests conducted using the dynamic glass testing rig.Testing large glass plates using the dynamic glass testing rig
Three glass manufacturers (Canadian Pittsburgh Industries, Libbey -Owens
-
Ford, and Pilkington Brothers Canada) joined with NRC's Division of Building Research (now IRC) in directing and funding two more contracts with Ontario Research Foundation from late 1979 to the summer of 1982 (Johar 1981, 1982). The objective of this joint research pro- gram was to reduce uncertainty about the application of the cumulative damage criterion to large glass plates. Although allV . " I I I I I I I I I
--
-
0
- -
MEAN 2.41, cov 21 % (WEIBULL CURVE)a
3
-
MEAN 2.43, cov 24 % (DATA)0
-
0 0-
3 . 0 - a - W n - CO.
-
-
-
-
-
--
0 2 0 4 0 6 0 8 0 1 0 0 PROBABILITY O F FAILURE, %FIG. 4. Ratio of failure load to 8 per 1000 load vs. probability of
failure for 107 panes of new glass from one batch. The fitted Weibull I
curve starts at a failure rate of 8 per 1000 using m = 7 and So = I
40 MPa. WING NUT 4 mm GLASS 9 mm REMOVABLE PLYWOOD E E
.z
4
2"x 6" JOIST @ 230 mm ON CENTRE '2 LAYERS OF 19 mm PLYWOODLw\-
\TO VACUUM CLEANERFIG. 5. Section through loading table.
small specimen tests of annealed soda-lime glass consistently show an exponent of n = 16 to 17 (equation [2]) for tensile stress at the site of the flaw causing failure, some large speci- men tests indicated that n = 22 (Ishizaki et al. 1974). In con- trast, an industry guideline (PPG 1979) for the relation of breaking stress to load duration indicated that n = 13.
The first series of tests comprised tests to destruction of 90 plates nominally 6 mm thick, using three different loading rates (0.15, 1.5, and 15 kPa/s) (Johar 1981). Batches of 30 panes of glass were selected from each of three glass manufacturers (Canadian Pittsburgh Industries, Libbey -
Owens -Ford, Pilkington Glass Industries). Ten of each batch 4
were tested at each of the three loading rates. Nondestructive tests on a tempered, strain-gauged plate were also conducted. The nondestructive tests established relations between uniform lateral pressure and surface tensile stresses at several locations on the plate. The plates were 1524
x
2438 mm, tested verti- cally against 12 mm wide neoprene gaskets (55 Durometer hardness) with a constant clamping pressure of 1 N/mm. Lateral support was continuous along all four sides. The results of the first series showed significant correlation between loading rate and breaking strength, but were unsatis- factory as a means for narrowing down the estimate for n. One batch of 30 samples had a higher average strength than the rest (statistically significant at the 5 % level); although the average value of n for the other two batches of 30 samples was about 16, the stronger batch suggested a value as high as 21.DALGLIESH AND TAYLOR 757
A second series of tests (Johar 1982) on windows of the same size was more conclusive; 107 specimens from one batch, tested as above but at five rates (nominally 0.0025, 0.025, 0.25, 2.5, and 25 P a l s ) , gave the following relation between the natural logarithms of failure pressure, Pf, and time to failure, tf (see [I]):
Average thickness and dimensions between support lines, used for calculation of the results given in this paper, are 5.82, 1492, and 2407 mm. Table 1 summarizes the results of the 107 tests, and the effect of loading rate is shown graphically in Fig. 3. Clearly, in accordance with Brown's criteria, as the loading rate drops and load duration rises, the strength decreases. The slope coefficient is 0.067 with a 95% confi- dence interval of f 0.16. The inverse of the slope gives a least- square estimate for n of 14.9 (see [5]).
> Using n = 14.9, equivalent 60-second pressures were calcu-
lated (Table 1). Although the mean failure pressures for the five rates were not identical, their coefficient of variation dropped from 24% to 8 % and the range from the highest to the lowest mean dropped from 2.84 to 0.71 kPa. Simiu and Lechner (1987) tested the validity of estimating 1-min loads from the same data using n = 14, and concluded that the varia- tion among their five means was "shown statistically to be relatively unimportant, though not necessarily negligible."
A value 14.9 for n applied to pressure can be reconciled with n = 16 or 17 for- stress by considering the relation between pressure and stress in the final stages of loading to failure. Nondestructive tests were conducted on one strain- gauged tempered pane (Johar 1981). The tests permitted inter- polation of stresses, a, corresponding to failure locations on the 107 panes, for pressures, P , up to failure. A power law relation was fitted in each case:
where K is a constant. The exponent 0, which is a function of aspect ratio and thickness, varied with failure location on the plate, but for most failure origins was in the range 0.85
<
/3<
0.95. To apply to pressure, the exponent for stress should be multiplied by /3. Thus, if n = 16 for stress, 13.6<
n<
15.2 for pressure; if n = 17 for stress, 14.4<
n<
16.2 for pressure.The failure prediction model uses the Weibull distribution, on theoretical grounds (Weibull 1939), to describe the sta- tistical variation so evident within each loading rate group
b (Table 1). The two-parameter Weibull distribution is defined by the mode (the most frequently occurring value), So (MPa), and the nondimensional shape parameter, m. The two param- eters are interrelated; when the Weibull probability distribu- tion is fitted to data, a change in m requires a change in So. The cumulative distribution is given by
[71 POF = 1 - exp(-B)
where POF is cumulative probability of failure, and
The quantity Sm,p,r has units of stress (MPa) and is a func- tion of the Weibull shape parameter, m, the lateral pressure applied to the plate, p ( P a ) , and the aspect ratio of the plate,
r (long-to-short dimension). A is the area of the plate, and A. is a reference area taken as 1 m2.
When pressure is applied to a glass plate, each flaw on the tension surface experiences a certain stress depending on its location and orientation. Severe flaws in high-stress regions of the plate contribute most to the probability of failure, but all combinations of flaw severity and tensile stress make their contributions as well. The summation of all contributions over the whole plate is represented by the function Beason (1980) and Beason and Morgan (1984) used a specially written finite difference program to compute a risk factor, R, from which Sm,p,r was calculated, as a function of m, p, and r for ranges of aspect ratios, pressures, and m.
where E is the modulus of elasticity of glass and h is the plate thickness. In their Table 2, Beason and Morgan (1984) tabu- lated values of R, the results of hundreds of runs, in nondimen- sionalized, normalized form for simply supported rectangular plates.
Failure data for in-service glass was collected previously and fitted to [7]. It yielded the parameters m = 7 and So =
32.1 MPa for use in the CGSB standard. New glass can be expected to require a considerably higher value of So for best fit. Figure 4 demonstrates the generally satisfactory fit of the Weibull distribution to the 107 tests of new glass at the Ontario Research Foundation, using m = 7 and So = 40 MPa. Since the industry (and CGSB) standard allows 0.8% breakage rate at the design load (8 failures per 1000 windows), the fitted Weibull curve in Fig. 4 starts at a probability of failure of 0.8%.3
The 107 tests have been used by others in the development of design methods (Simiu and Lechner 1987; Simiu and Hendrickson 1987).
Testing large panes using the loading table
At the Institute for Research in Construction large panels of glass to be loaded to failure under ramp loads are tested in the horizontal position on a loading table. Because of the difficulty of accommodating a variety of window sizes with one loading table, it is convenient and relatively inexpensive to build load- ing tables of the required sizes from wood.
Loading tables are shallow airtight boxes with the panes to be tested forming their upper surfaces; two at IRC were designed for glass failure loads ranging from 10 to 25 kPa. Approximately 24 cm deep (inside dimensions), they were made from kiln dried select structural pine for sides and purlins and one or two layers of 19 rnm fir plywood for the bottom as shown in Fig. 5. Sides and bottom were glued and screwed together to make them airtight. A commercial glazing gasket of neoprene rope surrounded by mastic was fixed to the top of the test frame so that the neoprene core was 6 mm in from the edges of the glass when the pane was placed on top of the frame. In short, the glass was simply supported. The edges of the glass were taped to the test frame to prevent leak- age. A frame of wood with glazing gasket on its underside
-
3The 8 per 1000 load used for normalization in Fig. 4 was 1.57
kPa. Reference to Table 2 in Beason and Morgan (1984) to obtain this
number will lead to inaccuracies due to interpolation. Beason recalcu- lated Table 2 for the CGSB committee to give smaller interpolation intervals.
758 CAN. J. C N . ENG. VOL. 17, 1990
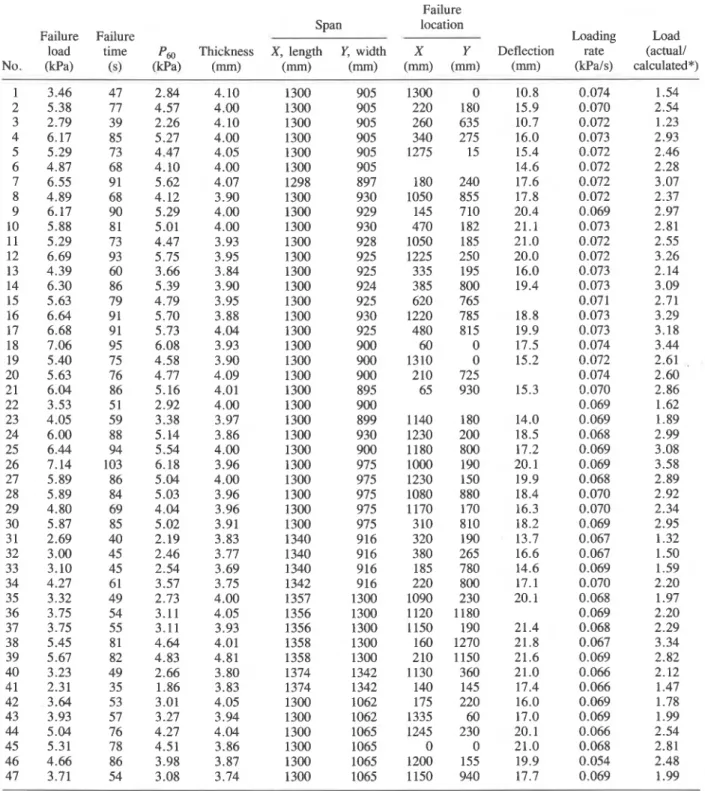
TABLE 2. In-service glass from Thompson Residence (exterior (weathered) surface tested in tension)
Failure Span location
Failure Failure Loading Load load time P , Thickness X, length Y, width X Y Deflection rate (actual1 No. (Wa) 6 ) (Wa) (mm) (mm) (mm) (mm) (mm) (mm) (Wals) calculated*)
1 3.46 47 2.84 4.10 1300 905 1300 0 10.8 0.074 1.54 2 5.38 77 4.57 4.00 1300 905 220 180 15.9 0.070 2.54 3 2.79 39 2.26 4.10 1300 905 260 635 10.7 0.072 1.23 4 6.17 85 5.27 4.00 1300 905 340 275 16.0 0.073 2.93 5 5.29 73 4.47 4.05 1300 905 1275 15 15.4 0.072 2.46 6 4.87 68 4.10 4.00 1300 905 14.6 0.072 2.28 7 6.55 91 5.62 4.07 1298 897 180 240 17.6 0.072 3.07 8 4.89 68 4.12 3.90 1300 930 1050 855 17.8 0.072 2.37 9 6.17 90 5.29 4.00 1300 929 145 710 20.4 0.069 2.97 10 5.88 81 5.01 4.00 1300 930 470 182 21.1 0.073 2.81 11 5.29 73 4.47 3.93 1300 928 1050 185 21.0 0.072 2.55 12 6.69 93 5.75 3.95 1300 925 1225 250 20.0 0.072 3.26 13 4.39 60 3.66 3.84 1300 925 335 195 16.0 0.073 2.14 I 14 6.30 86 5.39 3.90 1300 924 385 800 19.4 0.073 3.09 15 5.63 79 4.79 3.95 1300 925 620 765 0.071 2.71 16 6.64 91 5.70 3.88 1300 930 1220 785 18.8 0.073 3.29 17 6.68 91 5.73 4.04 1300 925 480 815 19.9 0.073 3.18 18 7.06 95 6.08 3.93 1300 900 60 0 17.5 0.074 3.44 19 5.40 75 4.58 3.90 1300 900 1310 0 15.2 0.072 2.61 , 20 5.63 76 4.77 4.09 1300 900 210 725 0.074 2.60 21 6.04 86 5.16 4.01 1300 895 65 930 15.3 0.070 2.86 22 3.53 51 2.92 4.00 1300 900 0.069 1.62 23 4.05 59 3.38 3.97 1300 899 1140 180 14.0 0.069 1.89 24 6.00 88 5.14 3.86 1300 930 1230 200 18.5 0.068 2.99 25 6.44 94 5.54 4.00 1300 900 1180 800 17.2 0.069 3.08 26 7.14 103 6.18 3.96 1300 975 lo00 190 20.1 0.069 3.58 27 5.89 86 5.04 4.00 1300 975 1230 150 19.9 0.068 2.89 28 5.89 84 5.03 3.96 1300 975 1080 880 18.4 0.070 2.92 29 4.80 69 4.04 3.96 1300 975 1170 170 16.3 0.070 2.34 30 5.87 85 5.02 3.91 1300 975 310 810 18.2 0.069 2.95 31 2.69 40 2.19 3.83 1340 916 320 190 13.7 0.067 1.32 32 3.00 45 2.46 3.77 1340 916 380 265 16.6 0.067 1.50 33 3.10 45 2.54 3.69 1340 916 185 780 14.6 0.069 1.59 34 4.27 61 3.57 3.75 1342 916 220 800 17.1 0.070 2.20 35 3.32 49 2.73 4.00 1357 1300 1090 230 20.1 0.068 1.97 36 3.75 54 3.11 4.05 1356 1300 1120 1180 0.069 2.20 37 3.75 55 3.11 3.93 1356 1300 1150 190 21.4 0.068 2.29 38 5.45 81 4.64 4.01 1358 1300 160 1270 21.8 0.067 3.34 39 5.67 82 4.83 4.81 1358 1300 210 1150 21.6 0.069 2.82 40 3.23 49 2.66 3.80 1374 1342 1130 360 21.0 0.066 2.12 41 2.31 35 1.86 3.83 1374 1342 140 145 17.4 0.066 1.47 42 3.64 53 3.01 4.05 1300 1062 175 220 16.0 0.069 1.78 43 3.93 57 3.27 3.94 1300 1062 1335 60 17.0 0.069 1.99 44 5.04 76 4.27 4.04 1300 1065 1245 230 20.1 0.066 2.54 45 5.31 78 4.51 3.86 1300 1065 0 0 21.0 0.068 2.81 I 46 4.66 86 3.98 3.87 1300 1065 1200 155 19.9 0.054 2.48 47 3.71 54 3.08 3.74 1300 1065 1150 940 17.7 0.069 1.99
*Calculated load from CGSB standard.
(directly above the gasket under the glass) was placed on top of the glass at the edges and bolted down to prevent the corners of the pane from lifting during loading. This frame was similar to that specified in ASTM-E997-84 (ASTM 1984).
A clear plastic tape is applied to the top surface of all panes. This provides safety when the glass implodes into the testing box. It also keeps the pieces together so the failure origin can be determined. Panes are placed on the test frame with this film on the compressive (top) side of the glass during testing. As glass is an elastic material which suffers brittle (sudden)
failure in tension, the application of tape or other films on the compression side of the loaded pane does not affect its strength during testing.
A heavy-duty vacuum cleaner is used with a voltage con- troller to evacuate the air from the test box such that the pres- sure on the glass increases at a predetermined constant rate until failure. The rate is chosen to precipitate failure in about 60 s on average. Pressure in the test box and center deflection of each pane are measured continuously by a pressure trans- ducer and LVDT (electronic deflection gauge) and recorded on
A N 0 TAYLOR 759
I I I I I I I I
I
0 20 4 0 60 80 1 0 0
I PROBABILITY OF FAILURE, %
Ro. 6 . Probab~lity dlstribuuon for 47 tests to failure of 15-year-old annealed glass. The failure load is divlded by the design load from
"6
the new CGSB standard (1989) (So = 32.1 MPa, m = 7). computer and tape recorder. Pressure is also recorded on anXY plotter. Failure origins are noted and used to compute approximate maximum principal tensile stresses in the glass at failure. If the glass is heat-strengthened, samples of broken glass are kept from each pane. They are used to determine thickness and the locked-in prestress due to the heat treatment.
Previous tests by others
As noted in the introduction, researchers over the years have acquired the results of over 5000 tests to failure conducted on loading rigs of various designs. The tests included samples of all commercially available thicknesses and ranged in area from 0.5 to 10 m2, with 10-40 or more replications for each size. Most of that glass was new, however. The comparable data base for weathered or aged glass is only one tenth as large, and sample sizes (replications) are usually smaller too. Because used glass has resale value, it is difficult to interest renovators in donating windows for testing after taking the trouble to remove them with the necessary care.
The characteristic strength used in the design does reflect the small data base on in-service glass. To take account of the variability in test results, the Weibull probability distribution rather than the more familiar normal, or Gaussian, distribution is fitted to the data. As noted before, the characteristic strength
"
parameter, So, was set at 32.1 MPa based on the earlier testsof old glass, whereas for new glass, So is 40 MPa or more.
h-service glass - Thompson Residence
0
In 1986, IRC acquired 47 windows removed from the University of Ottawa's Thompson Residence after 15 years of service. Nominally 4 mm thick, they ranged in area from 1.2 to 1.9 m2 and in aspect ratio from 1 to about 1.5. They were loaded to failure, with the weathered (exterior) surfaces in ten- sion, on a specially built loading table at a rate of 0.07 P a l s , so that failure occurred in roughly 40- 100 s depending on the strength of the specimen.
Although these results were not available in time to be con- sidered in setting So for the CGSB standard, they now provide an opportunity to check its calibration. Each failure pressure (after conversion to the equivalent 60-second pressure) was divided by the expected design value according to the Stan- dard. That design pressurc conforms to the traditionnl risk of breakage of 8 per thousand. That is, of every 1000 specimens loaded to their design pressure, on average 8 are expected to
8 %OF LENGTH OF CLEAR SPAN (LONG SIDE)
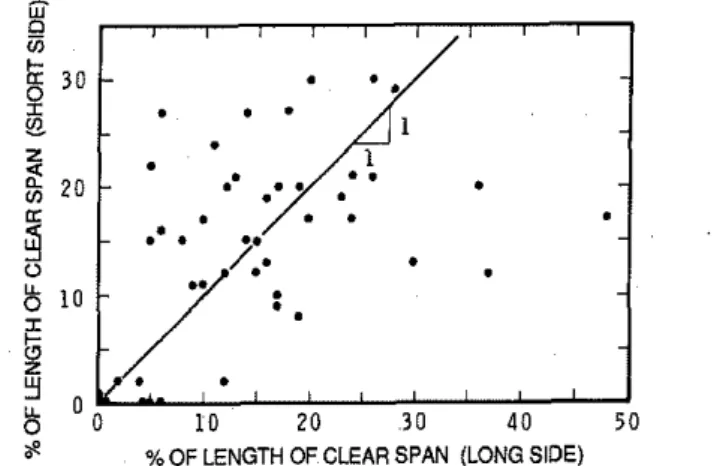
FIG. 7. Failure locations for 45 panes of 15-year-old glass from Thompson Residence
-
two break origins were not identified. break. Use of the design value according to the Standard for normalization assumes that [71 and [8] properly account for variations in aspect ratio and area from window to window.The results are listed in Table 2 and are compared in Fig. 6 with the theoretical Weibull probability distribution for glass designed according to the CGSB standard. It appears that the reduction in strength of the glass from the Thompson Resi- dence is close to the reduction obtained from the data used to develop the Standard. Table 2 also includes the
X
and Y coor- dinates (long and short side, respectively) of the initial break- age locations. Break origins were concentrated in the highly stressed comers of the plates where theoretical bending stresses are highest; Fig. 7 shows them all plotted in one corner.Fifteen percent of the failures started at the cut edges of the panes indicating that edge quality is important, even for plates supported on all sides.
Testing small samples: ring-on-ring tests
The testing described so far using the dynamic glass testing rig and the loading table is time consuming and expensive. A method of obtaining glass strength by testing small samples, cheaply, would clearly be welcomed. As the most severe imperfections on a glass plate are at the cut edges, edge strength could be assessed, to help determine thermal break- age stresses (Pilette and Taylor 1988), by bending narrow strips of glass (Walker and Muir 1984). Failures would cer- tainly begin at the edges. To assess the strength of a window under lateral loading, however, requires that the failure start on the surface of the glass, not at an edge. Nevertheless, under flexural loads, a certain percentage of breaks do start at the edges in the corner regions as discussed in the previous section (Pig. 7).
The ring-on-ring test of small glass plates (180 mm square) appears to provide an economical alternative to tests of full- sizedpanes (Norville and Minor 1984, Simiu eral. 1984). The main benefits, however, appear to be for comparative testing. For example, in the Ottawa area, aged glass is available from double glazed windows that have failed. Either the seals have failed and the windows are cloudy or the windows have cracked owing to thermal stresses. If the latter is the case, the cracked windows can only be evaluated by cutting them up into small samples, as for the ring-on-ring tests, and loading these to failure. To assess the deterioration in strength of the
CAN. I. C N . ENG. VOL. 17. 1990
I
LOAD, CELL ALTERNATIVE RUBBER LOADING RlNG
I
STEEL LOADING RlNG
O-RING
STEEL REACTION RlNG
'
I
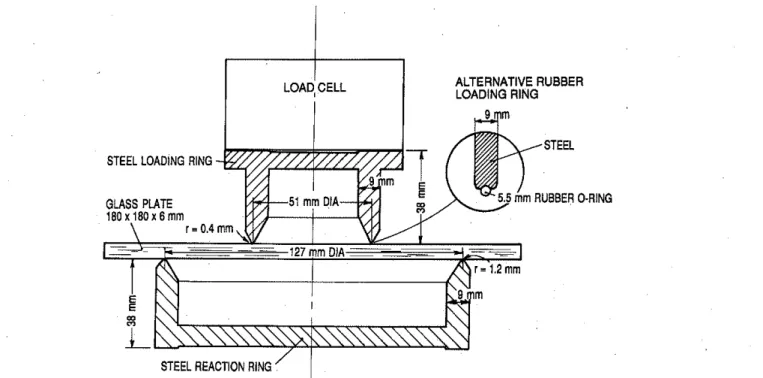
FIG. 8. Rubber and steel loading rings (51 mm diameter) and 127 mm reaction ring. The loading rings are bolted to high-precision load cells.
-0.50
1
1
0.0 20.0 40.0 60.0 80.0
,.
100.0RADIUS, mm
FIG. 9. Typical radial and tangential tensile stress ratios. Radius is measured from centre of loading ring. Edge of loading ring is at
25.5 mm and reaction ring is at 63.5 mm.
TABU 3. Ring-on-ring tests of in-service glass from a double-glazed
window
Outside pane (side 1) Inside pane (side 4)
No. tested 23 20
Successes 20 19
Success ratio (%) 87 95
Mean failure load (kg) 607.8 532.6
COV failure load (%) 19.5 28.8
Thickness (mm) 5.886 5.859
Avg. time to fail (s) 53.8 47.1
COV time (%) 19.8 28.2
aged glass, results from as many ring-on-ring tests as possible can be compared either with the equivalent tests of new glass or with the strength of the (unweathered) inside surfaces of double- and triple-glazed units. Eventually, in this way an esti- mate of the influence of in-service use will emerge.
The test is performed by placing a small glass plate on a cir- cular reaction ring of 127 mm diameter and applying, on its opposite surface, a load transmitted through a smaller, 51 mm diameter loading ring until failure occurs (Fig. 8). As glass fails in tension, the purpose is to produce with this test a uniform tensile stress field on one face of the plate within the smaller ring. Stresses outside the loading ring decrease to almost zero at the cut edges so failures should not start there (Fig. 9). The major disadvantage of ring-on-ring tests is that only a relatively small area (within the smaller ring) is tested. Larger rings can be used, however, for greater glass thickness.
Over 400 ring-on-ring tests have been conducted at
IRC.
Loads were increased linearly at 0.11 kN/s (25 lbls). Series of tests were conducted comparing loading rings made of steel as shown in Fig. 8 with those where a 5.5 mm rubber O-ring 51 mm in diameter applied the load to the glass. The aim wasto check whether the steel loading ring wascausing stress con-
'
centrations that reduced the failure stress and conseouentlv thearea of uniform tensile stress field. A finite element analysis of the sample under steel and rubber loading rings confirmed t what strain gauging of a sample had shown. In 6 mm thick glass, stress concentrations on the tension surface of the sample (6 mm) below both steel and mbber loading rings were
only 1%-2% larger than tensile stresses within the 51 mm > loading ring (Fig. 9). Thus data from samples where breaks
started at any location under and within the 51 m m loading ring could be used and considered to be successes. The tests also showed that the variability of results was less using the steel ring and the proportion of successes was higher. Thus the rubber loading ring was abandoned.
Table 3 shows results of in-service glass of unknown age removed from
NRC
buildings. Two panes of glass from a double-glazed window are shown. The surfaces of the glass are labelled I,?, 3 , 4 , from outside to inside the building. Sur- faces 2 and 3 face each other inside the window and were not tested in this case. Table 3 illustrates that side 4 of the insideOALGLlESH AND TAYLOR
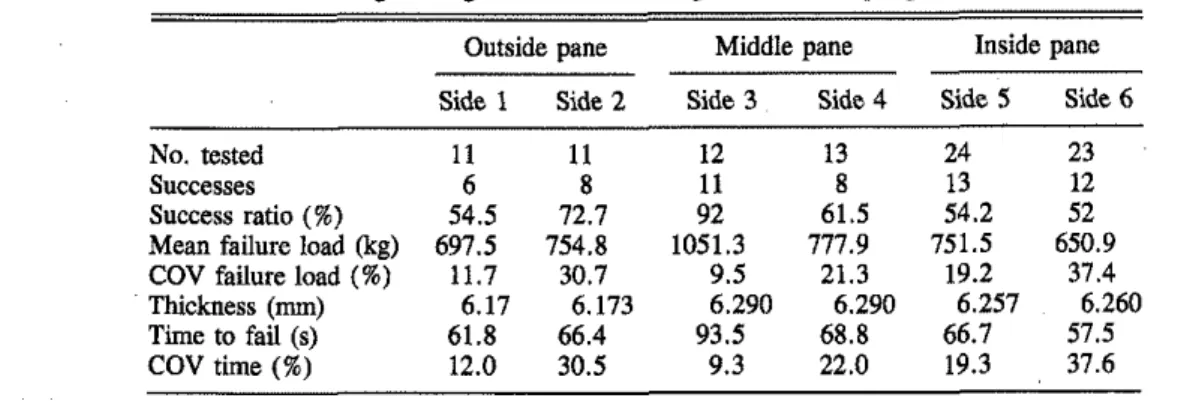
TABLE 4. Ring-on-ring tests of in-service glass from a triple-glazed window Outside pane Middle pane Inside pane Side 1 Side 2 Side 3 Side 4 Side 5 Side 6
No. tested 11 11 12 13 24 23
Successes 6 8 11 8 13 12
Success ratio (%) 54.5 72.7 92 61.5 54.2 52 Mean failure load (kg) 697.5 754.8 1051.3 777.9 751.5 650.9 COV failure load (%) 11.7 30.7 9.5 21.3 19.2 37.4 Thickness (mm) 6.17 6.173 6.290 6.290 6.257 6.260 Time to fail (s) 61.8 66.4 93.5 68.8 66.7 57.5 COV time (%) 12.0 30.5 9.3 22.0 19.3 37.6
>
pane of glass is weaker than the outside (side 1); abrasion due to cleaning side 4 may have weakened it. The variability of * ) samples from the inside pane is higher, indicating a more uneven distribution of microcracks. Natural weathering of side 1 appears to he more uniform. As loading rates for all tests were 0.11 kN/s (25 lbls), nu corrections to failure loads were required.
Similar tests were conducted on a triple-glazed window removed from an NRC building. Samples of each side of each pane were tested (Table 4). Again the weakest side, 6, was inside the room, and side 1, outside. Samples from the pro- tected sides 2 to 5 were tested and were found to be signifi- cantly stronger. These results from two windows are given as examples. Clearly, results from many such windows are required before conclusions can be drawn.
Ring-on-ring tests must be done carefully, with the rings centred precisely, or results will be quite variable. Their appeal, as noted previously, is in salvaging useful data on the strength of in-service glass from broken or damaged windows. However, when an adequate number of undamaged windows come available they should he tested, full-sized, on a loading table.
Hard body impacts due to windborne debris may result in broken windows in tall buildings and so may earthquakes. Palling glass breaks other windows below and causes hazardous conditions at street level. Research is required on ways to keep broken windows from falling out. This may entail comparative testing of the behaviour of laminated glass, heat-strengthened glass, and glass with plastic surface fiims, for which the dynamic glass testing rig is ideally suited.
The strength of thin heat-strengthened laminated windows under lateral loads need study. Tests on the loading table will indicate how these windows compare in strength and stiffness with nonlaminated heat-strengthened windows of the same total thickness.
Conelusions
1. Structural testing is a necessary part of dealing with glass. The engineering properties of glass and the behaviour of windows, glass curtain walls, and spandrel glass have to he obtained by tests in the laboratory or in the field.
2 . The most important question to he answered by testing of window glass is how much allowance should be made in desien for the deterioration in elass streneth with service. A "
-
-
Research nperlr companion question is, should the glass in a building be
---"---
--- ---
replaced at some stage?The deterioration of window strength throughout its service 3. structural testing should be conducted in prescribed life is not well understood and requires further research. The ways. Because glass is so variable, many replications of tests in-service strength reflected by the CGSB standard is based On should be done (at least 20); the loading history must be care- a limited number of tests of glass 8-25 Years old, from the fullv controlled and recorded: windows must be tested in a
0
mid-western United States. The effects of different exposures reaionablv clean environmentto avoid jab-induced scratches, and the rate of deterioration with time are largely unknown.
At least 20 panes are normally tested to establish a mean breaking strength. What is more, of the total of about 500 tests mentioned earlier some were tests of interior surfaces of sealed insulating glass units not exposed to abrasion or wet- ness. The 279 panes on which the CGSB estimate is based yielded six separate evaluations, from only four different building sites.
More studies of the edge quality of annealed window glass are required. To get improved resistance to thermal breakage, heat-strengthened glass is often selected. This is expensive. Development of ways of improving edge quality of annealed windows would enhance their performance against thermal breakage.
Further research on impact is required. Snow slides off roofs onto skylights below and falling icicles ricochet off obstacles and hit windows. Experimental research should be conducted on the impact resistance of various sizes of win- dows with a selection of gaskets and frames.
4. The bynamic glass testing rig, the loading table, and ring- on-ring test facility are all important research tools for evaluat- ing the structural strength of window glass.
5. Glass is another material that can be understood and "engineered." To assist the designer, a new CGSB standard has recently been published. With it the structural engineer is in a good position to expand his expertise from wood, steel, concrete, and masonry, to include glass.
Acknowledgments
The authors would like to thank Preston and Lieff Glass of Ottawa who donated 47 windows removed from the Thomp- son Residence at the University of Ottawa during a renovation program. They would also like to express appreciation for the assistance of Pat Daly who conducted most of the testing and Claude Pilette, at the time a co-op student from the University of Ottawa, who did the finite element analysis of the ring-on- ring tests.
ABIASSI, J. J. 1981. The strength of weathered window glass using surface characteristics. Institute for Disaster Research, Texas Tech University, Lubbock, TX (NTIS Accession No. PB82-172735). ASTM. 1984. Structural performance of glass in exterior windows,
curtain walls, and doors under the influence of uniform static loads by destructive method. ASTM E 997-84, Vol. 4.07, 1988 Annual Book of ASTM Standards, pp. 807-814.
BEASON, W. L. 1980. A failure prediction model for window glass. Institute for Disaster Research, Texas Tech University, Lubbock, TX (NTIS Accession No. PB81-148421).
BEASON, W. L., and MORGAN, J. R. 1984. Glass failure prediction model. ASCE Journal of Structural Engineering, 110(2): 197- 212.
BOWLES, R., and SUGARMAN, B. 1962. The strength and deflection characteristics of large rectangular glass panels under uniform pressure. Glass Technology, 3(5): 156-170.
BROWN, W. G. 1969. A load duration theory for glass design. Proceedings, Annual Meeting of the International Commission on Glass, Toronto, Ont., pp. 75-78; NRCC 12354, Division of Building Research, National Research Council of Canada, Ottawa, Ont.
-
1974. A practical formulation for the strength of glass and its special application to large plates. NRCC 14372, Division of Building Research, National Research Council of Canada, Ottawa, Ont.CGSB. 1989. Structural design of glass for buildings. CANICGSB- 12.20-M89, Canadian General Standards Board, Ottawa, Ont. DAWLIESH, W. A. 1980. Assessment of wind loads for glazing
design. Proceedings, IAHRIIUTAM Symposium on Practical Experiences with Flow-Induced Vibrations (September 3-6, 1979). Edited by E. Naudascher and D. Rockwell. Springer- Verlag, Berlin, Heidelberg. pp. 696-708.
HERSHEY, R. L., and HIGGINS, T. H. 1973. Statistical prediction model for glass breakage from nominal sonic boom loads. Report No. FAA-RD-73-79, Booz-Men Applied Research, Inc., Bethesda, MD (NTIS Accession No. AD-763-594).
ISHIZAKI, H., MIYOSHI, S., MIURA, T., IDA, M., KASAOI, S., and ~RAYAMA, T. 1974. Fatigue effect on wind resistance of glass
panels. Tenth International Congress on Glass, July 1974, The Ceramic Society of Japan, Kyoto, Japan, pp. 10-50 to 10-55. J ~ H A R , S. 1981. Dynamic fatigue of flat glass. Phase 11, Final Report
(670391, Ontario Research Foundation, Mississauga, Ont.
---
1982. Dynamic fatigue of flat glass. Phase El, Final Report (67049), Ontario Research Foundation, Mississauga, Ont. JONSSON, B. 1977. Glas i byggnader. Glassets tjocklek. Rapport R67:1977 Statens rad for hyggnadsforskning, Stockholm, Sweden (in Swedish).
KANABOLO, D. C., and NORVILLE, H. S. 1985. The strength of new window glass plates using surface characteristics. Glass Research and Testing Laboratory, Texas Tech University, Lubbock, TX. KRALL, W. R., SISKOS, W. R., STEWART, R. A,, and SPINDLER, R. G.
1981. The behavior of float glass under uniform wind loading. Preprints of 4th U.S. National Conference on Wind Engineering Research, July 27-30, Seattle, WA, pp. 155-159.
MICHALSKE, T. A., and BUNKER, B. C. 1987. The fracturing of glass. Scientific American, December, Dalton, MA, pp. 122- 129. Moone, D. M. 1980. Proposed method for determining the glass
thickness of rectangular glass solar collector panels subjected to uniform normal pressure loads. JPL Publication 80-34, Jet Propul- sion Laboratoly, Pasadena, CA.
NBC. 1990. National building code of Canada 1990. NRCC 30619, Associate Committee on the National Building Code, National Research Council of Canada, Ottawa, Ont.
NORVILLB, H. S., and MINOR, J. E. 1984. Glass strength evaluation using ring-on-ring tests. Proceedings, American Society of Civil Engineers Specialty Conference on Engineering Mechanics in Civil Engineering, University of Wyoming, Laramie, WY, pp.
1437-144(1.
ORR, L. 1957. Engineering properties of glass. In Windows and glass in the exterior of buildings. Publication 478, Building Research Institute, National Academy of Sciences, National Research Coun- cil, Washington, DC, pp. 51-62.
PILBTTE, C. F., andTnywn, D. A. 1988. Thermal stresses indouble- glazed windows. Canadian Journal of Civil Engineering, lS(5):
Xn7-1114 -.
..
PPG. 1979. PPG glass thickness recommendations to meet architects' specified l-minute wind load. Technical Services, Flat Glass Divi- sion, PPG Industries, Pinsburgh, PA.
SMIU, E., and HENDRICKSON, E. M. 1987. Design criteria for glass cladding subjected to wind loads. ASCE Journal of Structural Engineering, 113(3): 501-518.
SIMIU, E., and LECHNBR, J. A. 1987. Experimental glass failure data and equivalent one-minute loads. ASCE Journal of Structural Engineering, 113(12): 2503-2508.
SIMIU, E., Reen, D. A,, YANCY, C. W., MARTIN, J. W., HENDRICK- ,i SON, E. M., GONZALEZ, A. C., KOIKB, M., LECHNER, J. A,, and
BATTS, M. E. 1984. Ring-on-ring tests and load capacity of clad-
~ 1.
ding glass. NBS Building Series 162, National Bureau of Stan-
dards, Gaithersburg, MD. f
S~URNARAS, C. J. 1979. Development and evaluation of a rig for the
study of dynamic fatigue of flat glass. Final Report (67005), I!
Ontario Research Foundation, Mississauga, Ont.
WALKER, G. R., and MUIR, L. H. 1984. An investigation of the bend- ing strength of glass louvre blades. Proceedings, Ninth Australian Conference on the Mechanics of Structures and Materials, Univer- sity of Sydney, Sydney, Australia, pp. 122-131.
%BULL, W. 1939. A statistical theory of the strength of materials. Royal Swedish Institute for Engineering Research, No. 151, Stock- holm, Sweden.
List of symbols
A area of glass plate
A, reference area of glass plate (= 1.0 m2)
B function which reflects the risk of failure of a glass plate
C1 a constant
D,,,, measure of critical resistance to failure of
a
surface flaw exposed to tensile stress and water vapourE modulus of elasticity of glass
h thickness of glass plate . K a constant
m shape parameter of two-parameter Weibull distribution n exoonent. describes sloue of loading rate eauation
p,
P
Pf pmPOF
r R s m s , r S(f) s m $0 Sf tf 0P
-
latkral pressure on glass plate
constant pressure causing failure after tf seconds A'
constant pressure causing failure after 60 s , also called "equivalent 60-second pressure"
cumulative probability of failure I
aspect ratio of glass plate (long-to-short dimension) risk factor in Beason and Morgan (1984), measures contribution of flaws over the whole surface of a plate under pressure to the failure load
risk function, measures contribution of flaws over the whole surface of
a
plate under pressure to the failure loadnominal tensile stress at surface flaw at time t constant stress causing failure in 6 0 s
mode of two-parameter Weibull distribution nominal tensile stress at failure
time to failure
surface stresses at failure locations under pressures
P
exponent which relates stress and pressures at breakage
- . .