Publisher’s version / Version de l'éditeur:
International Journal of Nanoscience, 3, Dec. 6, pp. 757-763, 2004-12-01
READ THESE TERMS AND CONDITIONS CAREFULLY BEFORE USING THIS WEBSITE. https://nrc-publications.canada.ca/eng/copyright
Vous avez des questions? Nous pouvons vous aider. Pour communiquer directement avec un auteur, consultez la première page de la revue dans laquelle son article a été publié afin de trouver ses coordonnées. Si vous n’arrivez pas à les repérer, communiquez avec nous à [email protected].
Questions? Contact the NRC Publications Archive team at
[email protected]. If you wish to email the authors directly, please see the first page of the publication for their contact information.
NRC Publications Archive
Archives des publications du CNRC
This publication could be one of several versions: author’s original, accepted manuscript or the publisher’s version. / La version de cette publication peut être l’une des suivantes : la version prépublication de l’auteur, la version acceptée du manuscrit ou la version de l’éditeur.
For the publisher’s version, please access the DOI link below./ Pour consulter la version de l’éditeur, utilisez le lien DOI ci-dessous.
https://doi.org/10.1142/S0219581X04002620
Access and use of this website and the material on it are subject to the Terms and Conditions set forth at
X-ray diffraction analysis of nanoparticles: recent developments,
potential problems and some solutions
Whitfield, P. S.; Mitchell, L. D.
https://publications-cnrc.canada.ca/fra/droits
L’accès à ce site Web et l’utilisation de son contenu sont assujettis aux conditions présentées dans le site LISEZ CES CONDITIONS ATTENTIVEMENT AVANT D’UTILISER CE SITE WEB.
NRC Publications Record / Notice d'Archives des publications de CNRC:
https://nrc-publications.canada.ca/eng/view/object/?id=56db0433-a4cd-41f5-a708-6934d1fd42bd https://publications-cnrc.canada.ca/fra/voir/objet/?id=56db0433-a4cd-41f5-a708-6934d1fd42bdX-ray diffraction analysis of nanoparticles: recent
developments, potential problems and some
solutions
Whitfield, P.; Mitchell, L.
NRCC-46765
A version of this document is published in / Une version de ce document se trouve dans :
International Journal of Nanoscience, v. 3, no. 6, Dec. 2004, pp. 757-763
Doi:
101142/S0219581X04002620
International Journal of Nanoscience © Crown in right of Canada
X-RAY DIFFRACTION ANALYSIS OF NANOPARTICLES - RECENT DEVELOPMENTS, POTENTIAL PROBLEMS AND SOME SOLUTIONS
PAMELA WHITFIELD
Institute for Chemical Process and Environmental Technology, National Research Council Canada, 1200 Montreal Road, Ottawa, Ontario K1A 0R6, Canada
LYNDON MITCHELL
Institute for Research in Construction, National Research Council Canada, 1200 Montreal Road, Ottawa, Ontario K1A 0R6, Canada
Received (Day Month Year) Revised (Day Month Year)
Powder X-ray diffraction has become a cornerstone technique for deriving crystallite size in nanoscience due to speed and 'simplicity'. Unfortunately, this apparently simple technique commonly has unexpected problems. Anisotropic peak broadening related to crystallite shape, defects, and microstrain occur frequently in nanomaterials and can significantly complicate analyses. In some instances usage of the conventional single peak approach would give erroneous results, and in others this type of analysis is not even possible. A number of different nanocrystalline oxides have been examined to determine their crystallite sizes by different techniques. They differ in terms of crystal symmetry, crystallinity, density, and present different challenges with regard to size analysis.
Keywords: X-ray diffraction; oxides.
1. Introduction
Powder diffraction techniques have a wide variety of applications in compositional, structural, microstructural and many other areas. The ease in data collection makes its application to the microstructure of nanomaterials an obvious choice. In the study of nanomaterials the crystallite size is usually the sole factor of interest. The broadening of reflections in a powder diffraction pattern contains much information, such as crystallite strain, shape and stacking faults, which are often not considered. Nanomaterials even have their own unique problems, such as multiply twinned particle phenomena in metal nanoparticles. The extensive peak broadening and possible overlap exhibited by nanomaterials can even make determining phase purity a non-trivial process, and mis-identification of a two-phase system as being single-phase could lead to some very misleading results. Visual inspection is often insufficient where closely related phases can co-exist, e.g. in solid solution series. Full-pattern profile fitting techniques such as Rietveld analysis can assist greatly in gauging sample purity.
Whitfield and Mitchell
2
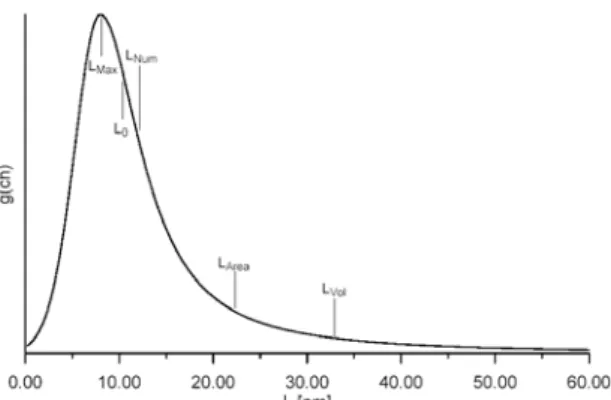
The first description of size broadening was given by Scherrer in 1918,1 although the first rigorous theory of line broadening was formulated in 1944.2 Williamson-Hall size-strain analysis3 was developed in 1953 as a method to separate size and strain effects by their angular dependence. Since then, most studies have been carried out using either Fourier peak shape-based Warren-Averbach,4 or simplified integral breadth methods. These methods give statistical measures of 'column lengths', L, usually volume-weighted (figure 1) rather than crystallite dimensions. Column lengths must be corrected to give real dimensions. Direct imaging techniques such as TEM provide number weighted results (see figure 1). Conversion of column length to crystallite dimension(s) requires information on crystallite shape. Where there is no anisotropic line broadening it is relatively safe to assume a spherical shape, in which case:
> < = >
<D vol 43 L vol (1)
where <L>vol is the volume weighted average column length, and <D>vol is the volume
weighted average crystallite diameter.
Figure 1. Schematic representation of a column height distribution with the important statistical points indicated. LMax = most probable value, L0 = median value, LNum = number weighted mean, LArea = area weighted
mean, and LVol = volume weighted mean. Reproduced with permission from Topas 2.1 manual.5
Integral-breadth methods currently dominate routine size/strain analysis. These often assume that crystallite size broadening is Lorentzian and strain broadening Gaussian, referred to in this paper as the LG approach, although the choice is rather arbitrary and has been demonstrated to be unreliable. Recently, it has been shown that size and strain broadening are each more accurately modelled by Voigt functions.6 Size and strain contributions are still separated by the 1/cos(θ) and tan(θ) dependence of the individual functions. The double-Voigt approach performed well in a Round-Robin organised to compare size results from various techniques for analysing powder diffraction data 7. A novel technique particularly suited to nanoparticulate materials is the use of Debye scattering analysis to yield radial distribution functions.8 In this context, crystallite diameters are assumed to be the maximum interaction distance on a next-nearest neighbour basis. For the purpose of determining crystallite size, conventional wide-angle X-ray techniques can be used satisfactorily,9 even with the truncation problems and
X-Ray Diffraction Analysis of Nanoparticles 3
limited range. This technique does not rely on any underlying order, so is suited to poorly crystalline and amorphous materials.
2. Experimental
A number of different nanocrystalline powders were analysed for size characteristics using a number of different techniques. They were commercial CeO2 (Nanoscale
Materials Inc.) and laboratory synthesised LiMn2O4 and alumina materials. Ceria is used
in Solid Oxide Fuel cells (SOFCs), and LiMn2O4 is an established cathode material for
lithium batteries. The spinel and alumina were produced using a variation on the sucrose method for producing nanocrystalline oxides.10
Diffraction data for this paper were collected from a parallel-beam CuKα Bruker D8, and a Scintag XDS2000 CuKα Bragg-Brentano diffractometer. Instrument and emission source profiles were modelled using NIST LaB6 660 and 660a profile standards.
The software used to analyse the data using the 'double-Voigt' approach was a beta version of Bruker's Topas 2.1 software.5 Fourier radial distribution function analysis was carried out using the program RAD.11 Selected samples were also examined using a Hitachi S4800 FEG-SEM.
3. Results and Discussion
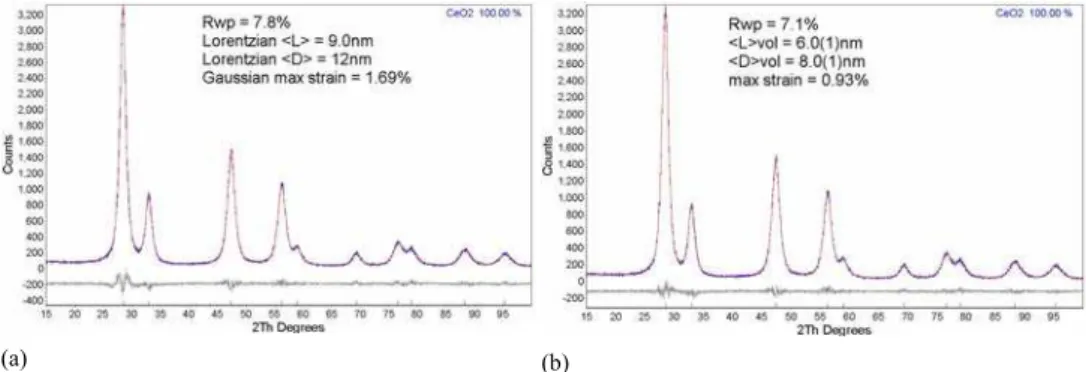
The diffraction data for all the samples are shown in figure 2. The alumina shows very poor crystallinity, and it is not possible to identify its polymorph. Ceria is frequently used as a standard material for the study of nanomaterials and is expected to show isotropic broadening behaviour. Structural refinements using both the LG and double-Voigt approaches were carried out. The double-double-Voigt fitting achieved a better fit to the data than the LG approach as seen in figure 3, with an Rwp of 7.1% as opposed to 7.8%
for the LG approach. In general terms, the smaller the value of Rwp,12 the better the fit,
although noise and high backgrounds can impact Rwp values. Assuming a spherical
shape, a crystallite diameter <D>vol of 8.0(1)nm was derived. This value compares
favourably with the manufacturers' claim of ≤7nm.
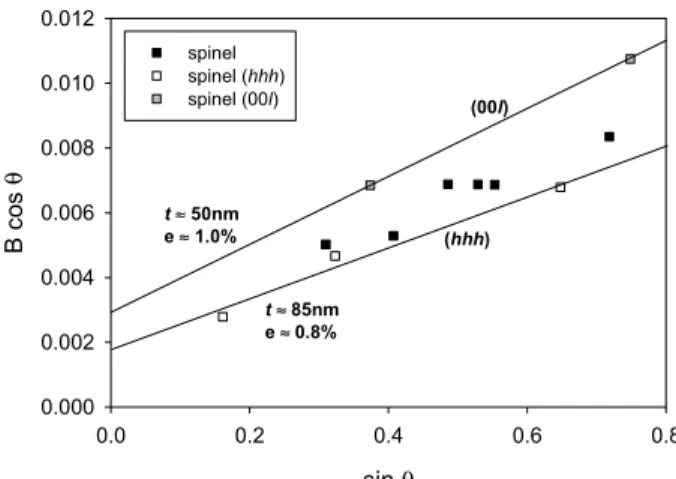
The Williamson-Hall plot for data collected from the LiMn2O4 spinel are shown in figure
4. In Williamson-Hall plots, <L>vol is extracted from the intercept, and strain from the
slope in a semi-quantitative manner. It is apparent from the plot that there are some hkl-dependent differences in the apparent size and strain, i.e. the apparent size for the 00l reflections is smaller than those for the (hhh) reflections), e.g. the (222). This suggests that the spinel crystallites have a distinct shape. Cubic materials usually form crystal shapes somewhere in a continuum between a cube and an octahedron. The mathematical description of shape-dependent hkl broadening is complex in many instances, although papers describing the hkl dependence in terms of apparent size for a number of simple shapes do appear in the literature.13 Fortunately, cubic materials form simple shapes, and <111> faceting of an octahedral crystallite would be expected to give rise to a larger
Whitfield and Mitchell
4
apparent size in the [111] direction than the [001]. Therefore the diffraction data suggests that the crystallites are octahedral in shape, with apparent dimensions of approximately 85nm in the [111] direction. Such a conclusion is consistent with observations of the sample by FEG-SEM as seen in figure 5.
2θ (degrees) 20 40 60 80 100 R e la ti ve in te n s it y alumina LiMn2O4 CeO2
Fig. 2. X-ray diffraction patterns of the various samples. The intensities have been rescaled to afford better comparison of the weaker patterns.
(a) (b)
Fig. 3. Difference plot yielded by (a) LG, and (b) double-Voigt Rietveld refinement of the ceria structure.
The alumina could not be analyzed using conventional techniques, so a Debye scattering-based radial distribution function was calculated for this phase. Trials with other nanocrystalline samples indicated that comparable values are obtained to other diffraction methods. Size is indicated by the point at which G(r), or electron density, reaches zero. The Fourier transform introduces background noise, introducing an error in the point at which the function reaches zero. The graph in figure 6 indicates a crystallite size of approximately 40Å or 4nm. This technique does not produce column lengths and is a direct measure of crystallite dimension.
X-Ray Diffraction Analysis of Nanoparticles 5 sin θ 0.0 0.2 0.4 0.6 0.8 B co s θ 0.000 0.002 0.004 0.006 0.008 0.010 0.012 spinel spinel (hhh) spinel (00l) t≈ 50nm e ≈ 1.0% t≈ 85nm e ≈ 0.8% (hhh) (00l)
Fig. 4. Williamson-Hall plot for the LiMn2O4. The (hhh) and (00l) reflections are plotted separately. B was
extracted from FWHM values of Pearson VII fitting to the sample and the LaB6 standard.
Fig. 5. Micrograph of the nanocrystalline LiMn2O4 material.
4. Conclusions
It has been shown a variety of techniques can be employed to extract size and sometimes strain data from diffraction data. The choice of technique depends largely on any complicating factors. One may have to resort to exotic methods based on Debye scattering where crystallinity is poor and crystal symmetry uncertain. Crystallite shape effects must also be considered, even in cubic materials. Williamson-Hall plots can be useful in determining hkl-dependent broadening, and even suggest shapes for crystallites. The double-Voigt model for peak size/strain broadening can be employed successfully in full-pattern peak fitting methods.
Whitfield and Mitchell 6 r(Å) 0 20 40 60 80 100 G(r) -200 -100 0 100 200
Estimated point at which RDF reaches background
Fig. 6. Reduced radial distribution function calculated from the diffraction data of the nanocrystalline alumina.
Acknowledgements
The authors would like to thank Dr Isobel Davidson, Dr Arnt Kern and Dr Alan Coelho for discussions regarding this paper. Mr Tai Sato is thanked for allowing the authors to use his alumina sample for this paper. Mr Yves Giroux of Hitachi Electron Microscope Division is thanked for permission to use the image in figure 5.
References
1. P.Scherrer. Nachrichten von der Gesellschaft der Wissenschaften zu Göttingen 98-100 (1918) 2. A.R.Stokes & A.J.C.Wilson. Proc. Phys. Soc. 56, 174-181 (1944)
3. G.K.Williamson & W.H.Hall. Acta Metallurgica 1, 22-31 (1953) 4. B.E.Warren & B.L.Averbach. J. Appl. Phys. 21, 595-599 (1950) 5. Bruker AXS. TOPAS V2.1 User Manual, Karlsruhe, Germany. (2003). 6. D.Balzar & H.Ledbetter. Advances in X-Ray Analysis 38, 397-404 (1995)
7. Balzar,D. & Popa,N.C. Report on the Size/Strain Round Robin. Commission of Powder
Diffraction Newsletter No.28 International Union of Crystallography. (2002).14-15
8. B.D.Hall. J. App. Phys. 87, 1666-1675 (2000)
9. B.D.Hall, D.Zanchet & D.Ugarte. J.Appl.Crystallogr. 33, 1335-1341 (2000)
10. L.D.Mitchell, P.S.Whitfield, J.Margeson & J.J.Beaudoin. J.Mat.Sci.Lett. 21, 1773-1775 (2002)
11. K.Petrov. J.Appl.Crystallogr. 22, 387-389 (1989)
12. R.A.Young. The Rietveld Method ( Oxford Science Publications, Oxford, 1995). 13. J.I.Langford & A.J.C.Wilson. J.Appl.Crystallogr. 11, 102-113 (1978)