Publisher’s version / Version de l'éditeur:
Vous avez des questions? Nous pouvons vous aider. Pour communiquer directement avec un auteur, consultez la
première page de la revue dans laquelle son article a été publié afin de trouver ses coordonnées. Si vous n’arrivez pas à les repérer, communiquez avec nous à [email protected].
Questions? Contact the NRC Publications Archive team at
[email protected]. If you wish to email the authors directly, please see the first page of the publication for their contact information.
https://publications-cnrc.canada.ca/fra/droits
L’accès à ce site Web et l’utilisation de son contenu sont assujettis aux conditions présentées dans le site LISEZ CES CONDITIONS ATTENTIVEMENT AVANT D’UTILISER CE SITE WEB.
Student Report (National Research Council of Canada. Institute for Ocean Technology); no. SR-2005-21, 2005
READ THESE TERMS AND CONDITIONS CAREFULLY BEFORE USING THIS WEBSITE.
https://nrc-publications.canada.ca/eng/copyright
NRC Publications Archive Record / Notice des Archives des publications du CNRC :
https://nrc-publications.canada.ca/eng/view/object/?id=7daa2b05-01e2-4320-a8eb-b1726054888a https://publications-cnrc.canada.ca/fra/voir/objet/?id=7daa2b05-01e2-4320-a8eb-b1726054888a
NRC Publications Archive
Archives des publications du CNRC
For the publisher’s version, please access the DOI link below./ Pour consulter la version de l’éditeur, utilisez le lien DOI ci-dessous.
https://doi.org/10.4224/8895152
Access and use of this website and the material on it are subject to the Terms and Conditions set forth at Liferaft performance under tow
DOCUMENTATION PAGE REPORT NUMBER
SR-2005-21
NRC REPORT NUMBER DATE
August 19, 2005
REPORT SECURITY CLASSIFICATION
Unclassified
DISTRIBUTION
Unlimited
TITLE
Liferaft Performance Under Tow AUTHOR(S)
Michael Phillips
CORPORATE AUTHOR(S)/PERFORMING AGENCY(S)
Institute for Ocean Technology (IOT)
PUBLICATION
SPONSORING AGENCY(S)
Institute for Ocean Technology (IOT)
IMD PROJECT NUMBER
2064
NRC FILE NUMBER KEY WORDS
Life rafts, liferafts, evacuation, life saving crafts, EER, towing, tow loads
PAGES
31 FIGS.20 TABLES0
SUMMARY
During June and July of 2005, the Escape, Evacuation, and Rescue team (EER) at the Institute for Ocean Technology completed sea trials on 16 and 42-person capacity liferafts. This report investigates the effects of several parameters on the force required to tow the liferafts. These include the use of a drogue, the direction of tow, the weight distribution, the inflation of the floor, and tow line length variations.
This report also details some of the failures that the liferafts experienced during the trials. Recommendations for the towing and design of liferafts are made as well.
ADDRESS National Research Council
Institute for Ocean Technology Arctic Avenue, P. O. Box 12093 St. John's, NL A1B 3T5
Tel.: (709) 772-5185, Fax: (709) 772-2462
National Research Council Conseil national de recherches Canada Canada
Institute for Ocean Institut des technologies Technology océaniques
LIFERAFT PERFORMANCE UNDER TOW
SR-2005-21
M. Phillips August 2005
TABLE OF CONTENTS
1.0 INTRODUCTION...1
2.0 EXPERIMENTAL SETUP...3
2.1 Test Location and Conditions ...3
2.2 Equipment, Instrumentation, and Data Acquired ...3
2.3 Tests Performed ...6
3.0 TOW FORCE RESULTS AND DISCUSSION ...7
3.1 Effect of Using a Drogue...8
3.2 Effect of Tow Direction...10
3.3 Effect of Weight Distribution ...10
3.4 Effect of Floor Inflation...13
3.5 Effect of Adjusting the Tow Line Length ...14
3.6 Effect of the Speed of Tow ...17
4.0 OBSERVED FAILURES...20
5.0 CONCLUSIONS...26
6.0 RECOMMENDATIONS ...28
7.0 REFERENCES...31
1.0 INTRODUCTION
Liferafts are commonly used worldwide as a primary or a secondary means of evacuation from merchant ships, passenger vessels, fishing boats, and offshore petroleum installations. In many cases, liferafts are required by regulations or laws whose explicit aims are to provide for the safety of life at sea. Despite being almost universally prescribed and carried by ships and offshore platforms, the actual performance that can be expected of liferafts and the people who have to use them in practice is largely unknown. Current Canadian regulations only require the successful completion of tests in calm water in order for manufacturers to obtain type approvals for their liferafts [1]. The performance of liferafts in ocean conditions is thus unknown. This absence of qualitative and quantitative knowledge, especially in different weather conditions, weakens rational decision-making processes and a host of associated search and rescue operations and planning.
The Institute for Ocean Technology in St. John’s, Newfoundland, a branch of the Canadian National Research Council, in partnership with the faculties of Engineering and Human Kinetics and Recreation at Memorial University of Newfoundland, as well as the Marine Institute’s Offshore Safety and Survival Center are conducting research on liferaft operational performance to address some of these unknowns. The research will investigate liferaft operational performance in a range of weather conditions, and also evaluate the influence of external factors on performance, including human factors and training.
During June and July of 2005, tests were performed on 16 and 42-person capacity liferafts at sea. This report will provide a comparative analysis of the tow loads when several parameters are varied. These parameters include the use of a drogue, the direction of tow, the weight distribution within the raft, the effect of inflating the floor, and the effect of varying the length of the towline. Quantitative observations shall be made as well, and a set of recommendations concerning the towing and design of liferafts shall follow.
2.0 EXPERIMENTAL
SETUP
2.1 Test Location and ConditionsThe sea trials were conducted approximately ten miles east of St. John’s harbour and approximately 3 miles south of the shipping lane (47o 30.0’ N, 52o 28.0’ W) to avoid interference with harbour traffic. This location was chosen to minimize shore effects on the incident waves. For safety reasons, maximum weather conditions for testing were established prior to the commencement of the test program. The limits for testing of the 16-person liferaft were set at approximately 25-knot winds, a 2.5m significant wave height and a 3.0m maximum. These limits were slightly reduced for the 42-person raft due to its increased weight and size. Weather conditions varied within these limits during the trials and were recorded by the project team.
2.2 Equipment, Instrumentation, and Data Acquired
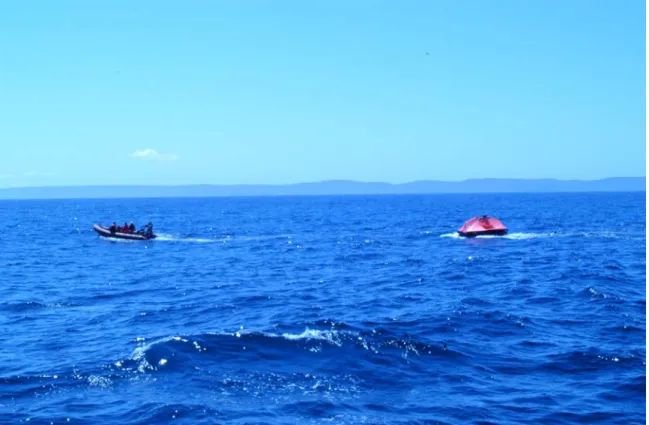
The sea trials were done from aboard the MV Louis M Lauzier and the tow craft used for the tests was a Zodiac Hurricane 640 FRC. The FRC can be seen towing the 16-person liferaft in Figure 1. The 16-person capacity liferaft used was a new year-2004 model from DBC Marine Safety Systems. The 42-person capacity raft was manufactured by RFD Beaufort in 1990 and had previously been on the MV Joseph and Clara Smallwood, although it was never used. The target load for the experiments was approximately 75%, which would represent 12 persons in the 16-person raft, and around 32 persons in the 42-person raft.
For safety reasons, 200L ballast bags filled with water were used instead of human subjects. Ballasting diagrams dictating the distribution of the bags within the 16 and 42-person liferafts are shown in Appendix A. In order to keep the trials consistent, the rafts were frequently re-filled to their blow-off pressures with compressed air contained in cylinders onboard.
Figure 1: FRC Towing Liferaft
Three “MotionPaks” were used to record the heave, surge, and sway accelerations, as well as the roll, pitch, and yaw rates of the FRC, the raft, and of a mannequin sitting in the liferaft. The MotionPaks use an inertial sensing system to measure angular rates and linear accelerations. A picture of the mannequin equipped with a MotionPak is shown in Figure 2. GPS units were also fitted
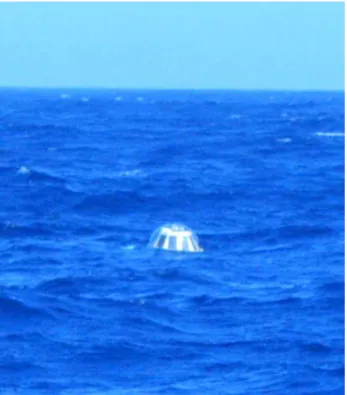
aboard both the liferaft and the FRC. The tow force was measured using a 5000lb capacity load cell, while the FRC’s shaft speed and rudder angle were measured using a tachometer and a yo-yo pot respectively. These three channels were recorded by a DaqBook 2000 acquisition system aboard the FRC. A schematic of the data acquisition systems is shown in Appendix B. Marine forecasts for the previously specified location containing wind and wave data were obtained from AMEC Corporation to allow the team to select appropriate days for testing. A TRIAXYS buoy, shown in Figure 3, was used to collect wave data at the test location. Early problems with the system required the team to rely on the AMEC weather forecasts for wave data for the 16-person liferaft trials. The wave buoy was functioning for the 42-person liferaft trials and its data is preferentially used for these experiments.
Figure 2: MotionPak Mannequin
Figure 3: Wave Buoy
2.3 Tests Performed
The test matrices for the 16 and 42-person liferafts were designed to investigate the effects of using a drogue, tow direction, weight distribution, inflating the floor, and adjusting the towline length. Tow tests corresponding to FRC shaft speeds of 1000 and 1500rpm were done for each condition. Full matrices of the tests performed are shown in Appendix C. The matrices allow for parameters to be varied individually so that their effects can be isolated during the analysis.
3.0 TOW
FORCE
RESULTS AND DISCUSSION
All of the comparisons to follow isolate the parameter being changed. No comparisons are attempted between runs that involve more than one parameter change. For example, when examining the effect of the drogue on the tow force, comparisons are only made between pairs of runs that were exactly the same except for the drogue parameter variation. Ideally, for the 16-person raft, this would allow for sixteen direct comparisons for any single parameter change, or eight per shaft speed. Several runs were not completed which reduced the number of possible comparisons. Other runs involved significant flooding of the liferaft, and thus no comparisons were made with these runs so as to avoid free surface effects. The data presented in this section can refer to either the 16 or the 42-person capacity liferafts, depending on which one allows for more direct comparisons. This is clearly listed in every plot. Many of these plots display the average tow force and the average speed of advance of the liferaft. These averages are computed from several runs at the given condition. Only runs that have a matching run with the desired single parameter change are considered. For a run to be included in an average, it must also form part of a matching pair of runs completed at 1000rpm and 1500rpm. For example, if referring to the 16-person raft’s test matrix in Appendix C, and if it were desired to investigate the effect of the weight distribution, runs 1, 2, 17, and 18 would only be eligible to form part of the averages if all runs were completed and did not involve flooding of the raft. The investigation of the effect of inflating the floor is the lone
exception to this rule, as it was not possible to make direct comparisons between runs completed at 1500rpm.
3.1 Effect of Using a Drogue
The use of a drogue was found to increase the required tow force, as expected. This also agrees with previous research done with the 16-person liferaft in the clear water tow tank at the Institute for Ocean Technology [2]. Results from the tow tank showed that the tow force at 3 knots with the drogue deployed was approximately 175N greater than without the drogue. Figure 4 clearly shows an increase in tow force when a drogue is used. The calm data shown in the figure is from the clear water tow tank tests. Figure 5 is a column chart of the same data. The equations of the polynomial lines of best fit shown in Figure 4 were used to predict tow force values at 2.2 and 3.4 knots in calm water for Figure 5. The average speed without the drogue is slightly higher than these two speeds, but since there were only two different constant shaft speeds tested, similar regressions to speeds of 2.2 and 3.4 knots were not possible, since a linear fit would be inappropriate. Instead, since the difference between the average speeds when using a drogue versus not using a drogue was small, the average tow forces with no drogue were left unchanged when forming Figure 5. Realistically, the average tow forces with no drogue would be slightly lower at these lower speeds. Therefore, the increase in load when using a sea anchor in ocean waves would be even greater than what is shown in Figure 5.
Effect of Drogue on 16-Person Raft
y = 134.97x2 - 23.374x + 15.594 R2 = 0.9987 y = 124.65x2 - 69.577x + 44.818 R2 = 0.9988 300.0 500.0 700.0 900.0 1100.0 1300.0 1500.0 1700.0 1900.0 2.0 2.5 3.0 3.5 4.0 Speed (knots) Averag e T o w F o rce (N) Favg - Drogue Favg - No Drogue Calm - Drogue Calm - No Drogue Poly. (Calm - Drogue) Poly. (Calm - No Drogue)Figure 4: Effect of Drogue
Effect of Drogue on 16-Person Raft
0 200 400 600 800 1000 1200 1400 1600 1800 2.2 3.4 Speed (knots)
Average Tow Force (N)
Calm - No Drogue Calm - Drogue Ocean - No Drogue Ocean - Drogue
Figure 5: Effect of Drogue Column Chart
3.2 Effect of Tow Direction
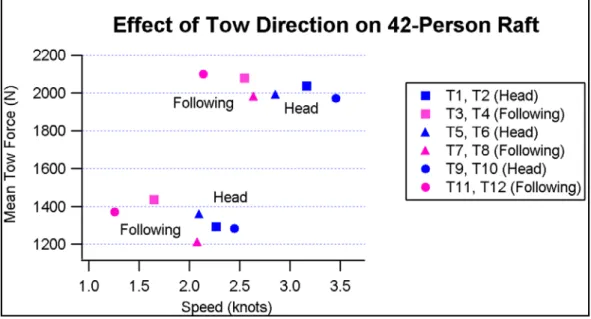
The effect of the tow direction was found to be different than what was initially expected. Upon inspection of Figure 6, it is observed that for a given tow load, it was possible to tow faster into head seas than in following seas. This effect is suspected to be due to a predominant current that was present at the testing location. This hypothesis remains to be verified.
Figure 6: Effect of Tow Direction
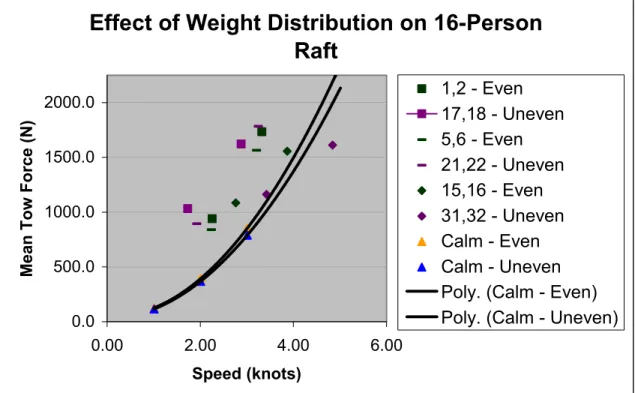
3.3 Effect of Weight Distribution
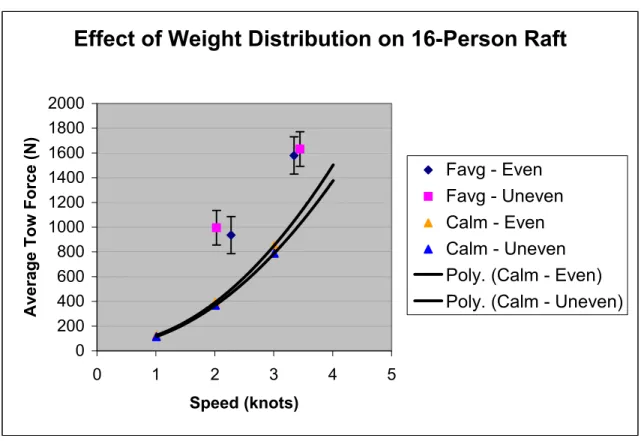
Results from the tow tank have shown a negligible difference in tow force between towing with an even weight distribution and an uneven distribution, when the floor was inflated [2]. When the floor was uninflated, the required tow force with an even weight distribution was found to be slightly higher than with an
uneven distribution. It is believed that the uneven distribution, which shifts weight aft, reduces the “plowing” of the bow of the raft into the waves by lifting up the bow, thus reducing the average tow force as well. The results from the sea trials shown in Figure 7, however, would initially seem to contradict those previous findings. Some possible reasons for this unexpected result become apparent when the individual differences between runs shown in Figure 8 are compared to the weather data that was acquired.
Effect of Weight Distribution on 16-Person Raft
0 200 400 600 800 1000 1200 1400 1600 1800 2000 0 1 2 3 4 5 Speed (knots)
Average Tow Force (N)
Favg - Even Favg - Uneven Calm - Even Calm - Uneven Poly. (Calm - Even) Poly. (Calm - Uneven)
Figure 7: Average Effect of Weight Distribution
Runs 1, 2, 17, and 18 were all done into head seas, but runs 1 and 2 were completed on a different day than runs 17 and 18. The opposing wind during
runs 17 and 18 was nearly 10 knots stronger, and the opposing wind waves were an average height of 1.1m versus 0.4m for runs 1 and 2. The increased speed that was achieved with the even distribution may therefore be due to less severe weather. Also, the inflation tank normally located underneath the raft was lost prior to runs 1 and 2 being completed, which may have reduced the drag of the raft as well.
Runs 5 and 6 show a similar pattern when compared to runs 21 and 22. Both runs were completed straight into the weather, but the wind during runs 21 and 22 was approximately 8 knots stronger, and the wind waves were 1.0m high, which was greater than the 0.4m wind waves experienced during runs 5 and 6. The inflation tank was also missing during runs 5 and 6, which may have resulted in less drag during these runs as well.
Runs 15, 16, 31, and 32, on the other hand, would indicate that the tow force was reduced when towing with an uneven distribution. These runs were all completed following the weather. The tail wind was approximately 3 knots stronger for runs 15 and 16, the wind waves were equal, but the swell and combined seas (aiding) were slightly smaller. The weather thus does not appear to have significantly reduced the tow force for runs 31 and 32 (uneven), as it had for the even distribution runs in the previous two comparisons, and this combination of runs may in fact offer the fairest comparison between even and uneven weight distributions.
Effect of Weight Distribution on 16-Person
Raft
0.0 500.0 1000.0 1500.0 2000.0 0.00 2.00 4.00 6.00 Speed (knots)Mean Tow Force (N)
1,2 - Even 17,18 - Uneven 5,6 - Even 21,22 - Uneven 15,16 - Even 31,32 - Uneven Calm - Even Calm - Uneven Poly. (Calm - Even) Poly. (Calm - Uneven)
Figure 8: Effect of Weight Distribution for Individual Runs
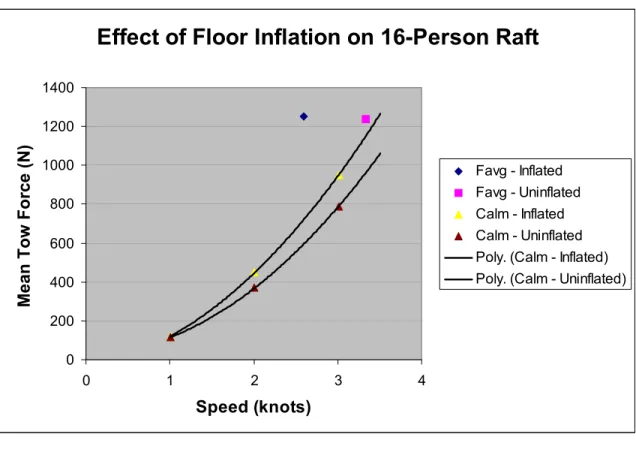
3.4 Effect of Floor Inflation
Data from the sea trials shows that for a given tow load, a greater towing speed may be achieved when the floor is left uninflated. This result agrees with previous experiments done in the clear water tow tank, which showed an increase in tow load when the floor was inflated. The data points shown in Figure 8 are both from an average of runs done at 1000rpm only, as no direct comparisons could be made at 1500rpm.
Effect of Floor Inflation on 16-Person Raft
0 200 400 600 800 1000 1200 1400 0 1 2 3 4 Speed (knots)Mean Tow Force (N)
Favg - Inflated Favg - Uninflated Calm - Inflated Calm - Uninflated Poly. (Calm - Inflated) Poly. (Calm - Uninflated)
Figure 9: Effect of Floor Inflation
3.5 Effect of Adjusting the Tow Line Length
The length of the towline was kept constant at 30m for the majority of the tests completed with the exception of a few runs with the 42-person liferaft which were completed using tow lengths that were adjusted to try to get the FRC and the raft to be in phase. The general formula that was used to determine an appropriate towline length was:
LTL = 0.75 * T132 ; where LTL = Towline length
T13 = Significant wave period
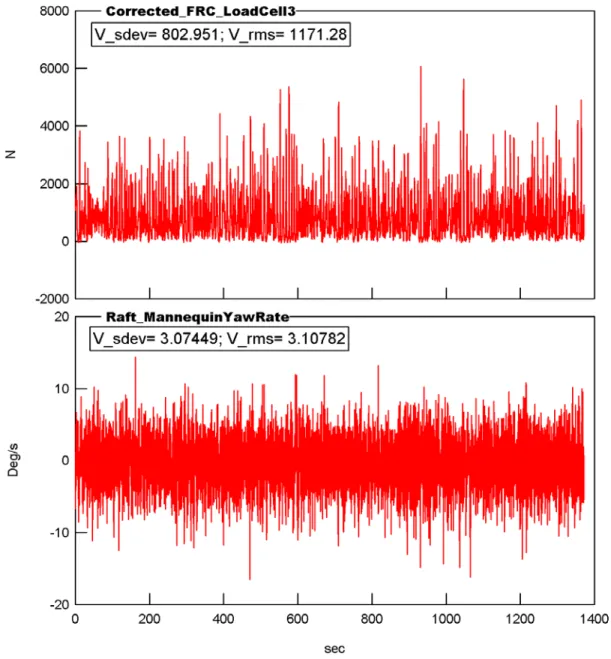
It was hoped that this adjustment would provide a more constant tow load. Also, it was noticed in the tow tank and at sea that the 16-person raft had a tendency to yaw when traveling down past the crests of waves. A similar effect was noticed with the 42-person raft at sea. It was therefore hoped that a more constant force in the towline would help to reduce the yawing of the liferaft as well.
An examination of Figures 10 and 11 shows that both the tow load and the yaw rate could indeed be significantly reduced by adjusting the towline length to get the FRC and raft in phase. Figure 10 shows a run where the liferaft and FRC were observed to be out of phase and the raft was observed to be yawing a lot. Figure 11 shows the same run in similar weather, but with the towline length adjusted so as to get the FRC and raft in phase. The two figures show a drop in root mean square average yaw rate of approximately 25%. The tow load was also reduced by nearly 200N, or approximately 13%. The reason for this relates to the yaw rate of the raft and whether or not the system is in phase. When the raft is out of phase, there is much greater variability in the towline load. In this particular case, comparing the two figures shows a drop in the standard deviation of the tow load of 20% when the raft is in phase with the FRC. When the tow force becomes small, the raft yaws as it descends a wave. Therefore, when there is greater variability in the tow load due to the system being out of phase, the average yaw rate will also be greater. This in turn affects the tow load, as a force in the direction of sway is required to return the raft to a straight alignment as the raft begins to climb the next wave. The forward force in the towline also becomes
the surge component of the total tow force when an angle exists in the towline. The resultant of these two force components is significantly greater than if no yaw occurs. Therefore, significant reductions in the tow load, its variability, and in yaw are possible when the raft is in phase with the FRC.
Figure 10: System Out of Phase
Figure 11: System in Phase
3.6 Effect of the Speed of Tow
Increasing the speed of tow by increasing the shaft speed from 1000rpm to 1500rpm resulted in increased tow loads, as expected. An increase in speed, however, also often resulted in a more constant tow force, which had the effect of significantly reducing the yaw rate. An inspection of Figures 12 and 13 shows two
identical runs done at different FRC shaft speeds. There were fewer occurances of the tow load dropping to zero at the higher FRC shaft speed. This more constant tow load in the run at 1500rpm in turn resulted in a reduction in the yaw rate of over 50% when compared to the run done at 1000rpm. Therefore, increasing the tow speed will increase the tow load, but will also often result in much lower yaw rates.
Figure 12: Run at Lower Shaft Speed
Figure 13: Run at Higher Shaft Speed
4.0 OBSERVED
FAILURES
The canopy of the 16-person liferaft frequently collapsed during testing. This was due to water spraying onto the canopy when the bow of the raft plowed into the incoming waves when it was being towed into head seas. This problem occurred both when the floor of the liferaft was inflated and when it was uninflated. However, the problem was particularly severe when the floor was left uninflated. The 42-person liferaft experienced no such problems, which can be attributed to its higher freeboard and its slightly better structural canopy support. The greater freeboard that is gained when the floor is inflated explains why the problem was less severe when the floor of the 16-person liferaft was inflated. Figure 14 shows the 16-person raft with its canopy collapsed due to water accumulation on top of it. Figure 15 shows a pool of water on top of the canopy near the bow entrance.
Figure 14: Collapsed Canopy
Figure 15: Accumulation of Water Near Entrance
Once the canopy collapses, it loses its ability to effectively keep water out of the raft. The water is no longer deflected off the raft since the slope in the canopy no longer exists. Instead, the water pools on top of the canopy and begins to flow into the raft through the canopy closure. Severe flooding quickly ensues. The water that accumulated in the liferaft frequently needed to be pumped out during the sea trials. On one occasion, after towing up-weather for thirty minutes at 1000rpm, followed by another 30 minutes at 1500rpm, approximately 700L of water had accumulated inside the raft. Figure 16 shows this volume of water inside the raft.
Figure 16: Water Inside Liferaft
The collapse of the canopy eliminates any headroom for the occupants and results in severe flooding of the liferaft. This situation is obviously unacceptable for the occupants. The water in the liferaft due to flooding would significantly reduce the potential survival time of the occupants, as heat would quickly be lost to the water. It also can not be assumed that the occupants will be capable of bailing, and therefore the canopy should prevent this occurrence from happening. Changes to the design of the canopy are obviously necessary.
The securing points for the canopy closure also failed during the sea trials. A red ellipse in Figure 17 highlights one such point. The location of these securing points makes them vulnerable to friction damage during boarding of the liferaft
while it is alongside the vessel from which it is launched. All three securing points at the bow entrance were quickly lost due to friction during the sea trials. The weather-tight integrity of the entrance is compromised if any of the securing points are lost during boarding. Repairs were made for the sea trials, but this would not be possible during a real evacuation.
Figure 17: Canopy Closure Securing Point
Another failure that occurred was that many of the water pockets with which the 16-person liferaft was equipped were also during the tow tests. These water pockets had to be frequently replaced. The current mode of attachment (tied on) of the water pockets to the raft is weak, as is much of the stitching that is used on
the water pockets themselves. The 42-person raft experienced no such problems as its water pockets were firmly stitched directly to the raft. The design of the 16-person liferaft’s water pockets needs to be revised if these are to be relied upon to provide a righting moment. Figure 18 shows several of the water pockets on the 16-person liferaft missing after a day of testing.
Figure 18: Missing Water Pockets
The factory-supplied towing bridle for the 42-person raft also experienced nearly immediate failure at the tow patch. Similar damage that was detected prior to a failure is shown in Figure 19. The supplied bridle had small angles at the two attachment points to the liferaft, and a deeper angle where the bridle attached to the towline. The failure is believed to be due to the large angle at the attachment
point to the towline. The reason for this is obvious from trigonometry. The load in each half of the bridle increases quickly with an increasing angle at the point of attachment to the towline. Therefore, a smaller angle is desirable.
Figure 19: Damage to Tow Patch
5.0 CONCLUSIONS
This report has shown that several factors have an effect on the tow loads created when towing a liferaft. The use of a drogue was shown to increase the force in the towline. This was in agreement with previous research done in the tow tank. It was also found that a greater speed could be achieved for a given tow load when the liferafts’ floors were uninflated. The experimentally observed effects of tow direction and weight distribution are different than what was hypothesized. However, the causes for this remain to be investigated in detail and are suspected to be environmental in nature.
It was also found that adjusting the tow length so that the liferaft and FRC were in phase could significantly reduce the tow force, its variability, and the yaw rate of the raft. An increase in the speed of tow has the effect of increasing the tow force, but the yaw rate can be significantly reduced as a result of the more constant tow force. These two findings emphasize the need for good training for FRC operators.
Several failures also occurred during testing. The canopy of the 16-person liferaft frequently collapsed under the weight of the water that accumulated on top of it. This resulted in massive flooding into the liferaft and eliminated all headroom for the simulated occupants. This problem was more severe when the floor was left uninflated. The current structural design of the canopy was therefore deemed to
be inadequate. The design of the canopy closures for the 16-person liferaft was also deemed to be inadequate, as these would be easily damaged during boarding, as was the case during the sea trials.
The 42-person liferaft’s towing bridle arrangement was also a source of failure during the sea trials. The supplied bridle was deemed to be too “shallow”, and was replaced with a deeper bridle, which performed better. It was also found that the towline attachment to the bridle should be free to move, as was the case with the supplied bridle, since a fixed attachment also resulted in failure during the trials.
6.0 RECOMMENDATIONS
The structural design of the 16-person raft’s canopy needs to be changed if it is to remain weather-tight in an ocean environment, especially when being towed. The current design provides little support in the area around the entrances. A single canopy arch tube across the middle of the liferaft supports it. Two possible solutions include significantly increasing the pressure in the existing arch tube or adding structural support. One possible modification that would provide the additional support required, especially around the entrances, is shown in Figure 20. The current design is shown and the dashed lines illustrate the proposed additions. Proper design of the new arch tubes would also allow the current shape of the canopy to be maintained if desired.
Figure 20: Proposed Canopy Design Change
The securing points in the existing design of the 16-person raft are very vulnerable to being lost due to friction between the liferaft and the ship during boarding. The 42-person liferaft employs zippers to close the entrances and does not experience any problems. If it is desired to avoid zippers for reliability or other reasons, then the securing points for the 16-person raft canopy closures should be moved to the top of the upper tube, or to a position within the raft. One possible way to do this would be to pass longer cords through loops similar to tow patches on the outside of the liferaft, and then to loop the cords around the securing points at the new locations. This would greatly improve the design, while only adding one additional task to the process of securing the canopy.
The supplied towing bridle for the 42-person liferaft was judged to have too large an angle at the point of attachment to the towline. This was the cause of near immediate failure when towing in waves. This problem could probably be rectified by reducing the angle at the point of attachment so as to decrease the load in both sections of the towing bridle. The attachment between the towing bridle and the towline should also be left free to move during towing so as to avoid excessive loading to one side of the bridle when the raft yaws.
This report has shown that significant reductions in the tow load, its variability, and in yaw rates can be achieved by selecting a tow length that results in the liferaft and FRC being in phase. Speeds can also be chosen to reduce the yaw of the liferaft in tow. These significant differences in performance stress the
importance of good training for FRC operators. The differences in tow load will be very significant in more severe weather and therefore, FRC operators need to be well trained to make educated decisions that will optimize the towing performance of the raft.
7.0 REFERENCES
1. TP7321: Standards for life rafts and inflatable rescue platforms.
[Ottawa : Marine Safety Directorate, Transport Canada, 1992].
2. Kuczora, A.; Mak, L.; Simões Ré, A.. Motion Response of Full-Scale
Life Raft in Laboratory Tow Experiments (TR-2005-11). St. John’s,
Nfld. : National Research Council of Canada, Institute for Ocean Technology (2005).
APPENDIX A – BALLASTING DIAGRAMS
16-Person Liferaft Ballasting Diagram
42-Person Liferaft Ballasting Diagram
APPENDIX B – DATA ACQUISITION SYSTEMS
Life Raft Raft MotionPak Mannequin MotionPak GPS (Ciro) IOT MPStreamer IOT MPStreamer Bluetooth Radio (A) Bluetooth Radio (B) Bluetooth Radio (C) Bluetooth Radio (A) Bluetooth Radio (B) Bluetooth Radio (C) NMEA SentencesLife Raft Logger
(Panasonic CF51 Notebook Computer B) Serial Data
Lines
Fast Rescue Craft
FRC Data Logger (Panasonic CF73 Notebook Computer) DGPS (Trimble) FRC MotionPak DaqBook 2000 w/ DBK45 and DBK43 Signal Cond. Strain Gauges Shaft RPM Rudder Angle Analog Transducers Parallel Serial Data Lines Wireless Ethernet Router Service Vessel (MV Lauzier) Master Control Computer (Panasonic CF51 Notebook Computer A) Cat. 5 Cable Cat. 5 Cable IEEE 801.11g Wireless Ethernet
APPENDIX C – TEST MATRICES
16-Person Raft Test Matrix Version 4.2
Tow Test FRC Test Number Personnel Loading (12 person) Liferaft Stiffness (100% of nominal psi) Boarding Platform Aft Tow Line Length (30 m) Free Surface
(Dry) Personnel Distribution
Floor Inflation
(Uninflated) Sea Anchor Tow
Direction Tow RPM
Variables Even Inflated Conventional Head RPM 1
Uneven (load more weight aft and 1 additional person
weight to one side) Uninflated No Following RPM 2
1 Even Inflated Conventional Head RPM 1
2 RPM 2 3 Following RPM 1 4 RPM 2 5 No Head RPM 1 6 RPM 2 7 Following RPM 1 8 RPM 2
9 Uninflated Conventional Head RPM 1
10 RPM 2 11 Following RPM 1 12 RPM 2 13 No Head RPM 1 14 RPM 2 15 Following RPM 1
16 RPM 2
17 Uneven Inflated Conventional Head RPM 1
18 RPM 2 19 Following RPM 1 20 RPM 2 21 No Head RPM 1 22 RPM 2 23 Following RPM 1 24 RPM 2
25 Uninflated Conventional Head RPM 1
26 RPM 2 27 Following RPM 1 28 RPM 2 29 No Head RPM 1 30 RPM 2 31 Following RPM 1 32 RPM 2 Not Completed
42-Person Raft Test Matrix Version 4.0 (July 2005)
Note Upper & lower chamber inlfated to blow-off (3.2 psi)
Towing bridal as supplied by manufacturer (boarding platforms, port & Stbd) FRC Towline length 30 m, Lauzier towline length to be determined
raft) No freesurface (dry
Personnel loading 32 persons Test duration 30 minutes
Instrumented Manikin positioned near door close to tow line Drift test duration 2 hours
Tow Test FRC - fixed towline Tow Test Lauzier
Test
Number Ballast Floor Drogue Seas RPM Test Number Ballast Floor Drogue Seas Speed
even uneven inflated yes no head following 1000 1500 even uneven inflated yes no head following 2 knots 3 knots
T1 even inflated no head 1000 L1 even inflated yes head 2
T2 1500 L2 3
T3 following 1000 L3 following 3
T4 1500
T5 yes head 1000
T6 1500
T7 following 1000 Drift tests
T8 1500 Test Number Ballast Floor Drogue
T9 even uninflated no head 1000 even uneven inflated yes no
T10 1500 D1 even inflated yes
T11 following 1000 D2 no
T12 1500
42-Person Raft Test Matrix Version 4.0 (July 2005)
Note Upper & lower chamber inlfated to blow-off (3.2 psi)
Towing bridal as supplied by manufacturer (boarding platforms, port & Stbd) FRC Towline length 30 m, Lauzier towline length to be determined
No free surface (dry raft)
Personnel loading 32 persons Test duration 30 minutes
Instrumented Manikin positioned near door close to tow line Adjust towline length accordingly
Tow Test FRC -variable towline
Test
Number Ballast Floor Drogue Seas RPM Towline Comments
even uneven inflated yes no head following 1000 1500 (m) Formula Swell Period Result
V1 even inflated yes head 1000 50 1.5* Tw^2 6 54
V2 1000 75 0.75*Tw^2 10 75 V3 1500 75 10 75 V4 Following 1000 75 10 75 V5 1500 75 10 75 V6 Head 1500 75 10 75 Raft GPS failed