HAL Id: inria-00479724
https://hal.inria.fr/inria-00479724
Submitted on 2 Aug 2010
HAL is a multi-disciplinary open access
archive for the deposit and dissemination of
sci-entific research documents, whether they are
pub-lished or not. The documents may come from
teaching and research institutions in France or
abroad, or from public or private research centers.
L’archive ouverte pluridisciplinaire HAL, est
destinée au dépôt et à la diffusion de documents
scientifiques de niveau recherche, publiés ou non,
émanant des établissements d’enseignement et de
recherche français ou étrangers, des laboratoires
publics ou privés.
Salim Jouili, Salvatore Tabbone, Ernest Valveny
To cite this version:
Salim Jouili, Salvatore Tabbone, Ernest Valveny. Comparing Graph Similarity for Graphical
Recog-nition. J.-M. Ogier and W. Liu and J. Llados. Graphics RecogRecog-nition. Achievements, Challenges, and
Evolution, 6020, Springer Berlin / Heidelberg, pp.37-48, 2010, Lecture Notes in Computer Science,
978-3-642-13727-3. �10.1007/978-3-642-13728-0�. �inria-00479724�
Graphical Recognition
⋆Salim Jouili1, Salvatore Tabbone1, and Ernest Valveny2
1
LORIA UMR 7503 - University of Nancy 2 BP 239, 54506 Vandoeuvre-l`es-Nancy Cedex, France
{salim.jouili,tabbone}@loria.fr 2
Centre de Visi´o per Computador, Dep. Ci`encies de la Computaci´o
Universitat Aut`onoma de Barcelona, Edifici O, Campus UAB, 08193 Bellaterra, Spain ernest@cvc.uab.cat
Abstract. In this paper we evaluate four graph distance measures. The analysis is performed for document retrieval tasks. For this aim, different kind of documents are used including line drawings (symbols), ancient documents (ornamental letters), shapes and trademark-logos. The ex-perimental results show that the performance of each graph distance measure depends on the kind of data and the graph representation tech-nique.
Keywords: Graph matching, Graph retrieval, Structural representation,
Performance evaluation.
1
Introduction
In document retrieval applications, it is necessary to define some description of the document based on a set of features. These descriptions are then used to search and to determine which documents satisfy the query selection criteria. The effectiveness of a document retrieval system ultimately depends on the type of representation used to describe it. In pattern recognition, the document rep-resentation can be broadly divided into statistical and structural methods [6]. In the former, the document is represented by a feature vector, and in the latter, a data structure (e.g. graphs or trees) is used to describe objects and their relation-ships in the document. The classical retrieval systems are often limited to work with a statistical representation due to the need of computing distances between documents (feature vectors) or finding a representative cluster of documents. However, when a numerical feature vector is used to represent the document, all structural information is discarded although the structural representation is more powerful in terms of its representational abilities [6]. In the last decades,
⋆This work is partially supported by the French National Research Agency project NAVIDOMASS referenced under ANR-06-MCDA-012 and Lorraine region.
many structural approaches have been proposed. These approaches deal, espe-cially, with graph-based representations. Nevertheless, dealing with graphs suf-fers, on the one hand from the high complexity of the graph matching problem which is a problem of computing distances between graphs, and on the other hand from the robustness to structural noise which is a problem related to the capability to cope with structural variations and differences in the size of the graph. In order to overcome this problem, several approximate graph matching methods have been proposed [11, 15, 19, 21]. In this paper, our attention is fo-cused on the comparison of different graph similarity measures in the context of document retrieval.
Graph similarity measures use different techniques to minimize the complex-ity and to optimize the robustness to structural noise. Robles-Kelly and al. [21] propose a spectral seriation approach to reduce the graph matching to a string edit distance in a probabilistic framework. Jouili and al. [11] simplify the problem to a bipartite graph matching by making use of node signatures. Lopresti and al. [15] use a probe technique to reduce the graph matching to distance between vectors. Papadopoulos and al. [19] introduce an histogram-based technique.
In this paper, we present an evaluation of these four graph distance measures on four different document data sets. We use the well-known GREC [20] data base which consists of graphs representing symbols from architectural and elec-tronic drawings. Here the ending points (ie corners, intersections and circles) are represented by nodes which are connected by undirected edges and labeled as lines or arcs. We have also performed a retrieval evaluation on an ornamental let-ters data set which contains lettrine (graphical object) extracted from digitized ancient document3. Since one lettrine contains a lot of information (i.e. texture,
decorated background, letters), the graphs are extracted from a region-based segmentation [9] of the lettrine with a user-based parameterization technique. The nodes of the graph are represented by the regions and the edges describe their adjacency relationships. We have also evaluated the graph similarity mea-sures on a shape data set [23] in which the graph is extracted by making use of a skeletonizing algorithm and a delaunay triangulation of detected endpoints. Finally, the graph similarity measures are evaluated on a set of trademark-logos in which the graph is extracted by making use of an interest points detector [10] and the delaunay triangulation.
The performance evaluation is performed using the Precision-Recall curves. Through this evaluation, we will examine the robustness of each graph similarity distance and this will allow us to investigate the applicability of each measure to the problem of retrieval for different kinds of documents.
2
Graph-based representations
Region-Based approaches have been one of the most important research issues in content-based image retrieval. Representing images at the region level
cap-3
Provided by the CESR - University of Tours on the context of the ANR Navidomass project http://l3iexp.univ-lr.fr/navidomass/
tures not only the local variations of regions but also their spatial organizations. Graph-based representations are widely used in region-based segmentation. To incorporate both region attributes and adjacent relationship an image is usu-ally represented as an attributed graph. Classical image representations such as colors histograms, texture descriptors, or shape descriptions do not take into account the regions localization in the document.
Graph-based representations are used in many applications, for instance, to represent circuit diagrams [4], for shape recognition [8], image matching [14, 2], or old document analysis [12]. Other works on graph-based representation [1, 3, 18, 17], use different methods to incorporate features of the document image. The methods vary according to the characteristics of the data and the aims of the representation (i.e. matching or retrieval). Bunke [4] illustrates an example of converting a circuit diagram to a graph by representing the lines in the cir-cuit diagram; each graph node represents a line endpoint, corner or intersection point, and node attributes record the image coordinates (x,y) of this feature. In [12] the authors manipulate initial letters from old documents. They proceed by segmenting the initial letter into different information layers to obtain ”Informa-tion layers of homogeneous zones”. Then, each homogeneous zone of the initial letter is converted to a node of graph with two attributes: size and shape descrip-tions, and each edge contains two attributes: angle and distance. Baeza-Yates and al. [2] also represent images as attributed graphs and adopt the graph edit distance to calculate the image distance. In another way using graphs in image analysis, Pan and al. [18] introduce a graph-based automatic image annotation. The authors propose a graph-based method to assign automatically keywords to an image. The main idea of this work is to represent all the images, as well as their attributes (caption words and regions) as nodes and link them according to their known association into a graph. For the task of image annotation, they use a ”3-layer” graph, with one layer for image nodes, one layer for annotation term nodes, and one layer for the image regions.
In this section, we have seen that graphs can be widely used as a data structure-model in the pattern recognition domain. Moreover, most of the previ-ous graph-based representations aim to measure some similarity between objects for recognition or retrieval tasks. This leads to the development of several simi-larity measures for graphs.
3
Graph matching measures
An important step in structural pattern recognition is the representation of doc-uments by a graph data structure. This structural representation should provide a description of the characteristics of the images efficiently for the task under consideration (e.g. retrieval). The retrieval problem can then be addressed in the corresponding graph space without addressing the original images. The process of comparing graphs is generally referred as graph matching. Generally, given two graphs G1=(V1,E1) and G2=(V2,E2), the graph matching methods are
called graph isomorphism that requires to find a one-to-one mapping f :V17→ V2
such that (u,v ) ∈ E1if (f(u),f(v)) ∈ E2with |V1|=|V2|. The second category
con-tains inexact matching methods, where a strict correspondence among the nodes or the edges of the two graphs can not be found. Therefore, in these cases no iso-morphism can be expected between both graphs, and the graph matching does not consist in finding the exact matching but the best matching between them. To perform such a structural matching, various formalisms have been proposed, using error-tolerant methods based on continuous optimization [16], quadratic programming, and spectral decomposition of graph matrices [21]. Other methods try to characterize the properties of graphs using a vector-based representation in order to profit from the existing vector measures[15, 11, 19]. Most of the inexact graph matching measures are based on some sort of edit operations. The basic idea is to define the similarity of graphs based on the effort needed to make the graphs identical. This is an extension of the well known string edit distance [13] to the graph edit distance (GED) [22]. For a review of graph similarity measures we refer the readers to [7, 5].
The matching methods selected for our evaluation belong to different for-malisms. The spectral technique proposed by the Robles-Kelly’s method [21] has proven to obtain good performance results. The graph matching based on node signature [11] uses a local decomposition of graphs and an assignment method to carry out an optimum node-to-node correspondence. Papadopoulos and al. [19] provide a histogram-based representation for graphs to compute the edit distance between graphs as a sequence of three different primitive opera-tions. Finally, using the new concept of probe, Lopresti [15] introduces the graph probing which is characterized by its rapidity.
3.1 Graph edit distance from spectral seriation
Robles-Kelly and al. [21] use a spectral method to represent graphs by strings, and then the similarity of graphs is measured according to the edit distance of strings in a probabilistic framework. The graph edit distance is the cost of the shortest edit path in an edit lattice for transforming the data graph into the model. The rows and columns of edit lattice are indexed by two strings Y={y1,y2,,y|VD|} for data graph GD=(VD,ED) and X={x1,x2,,x|VM|} for the
model graph GM=(VM,EM), with null symbol ε, and VDand EDbeing the point
set and the edge set of the data graph. The problem of computing the edit dis-tance is posed as that of finding the least expensive path Γ∗= hγ
1, γ2, ..., γk, , γLi
from (y1,x1) to (y|VD|,x|VM|) through the edit lattice based on the Levenshtein
distance. Each state γk∈ (VD∪ ε) × (VM∪ ε) of the edit path is a Cartesian pair.
Then cost functions are defined for elementary matches, according to the cost edit path Γ∗ (i.e., graph edit distance) computed using the following equation:
d(X, Y ) = C(Γ∗) = X
γk∈Γ
η(γk → γk+1) (1)
where η(γk → γk+1) = −(lnP (γk|φ∗X(xi), φ∗Y(yj))+lnP (γk+1|φ∗X(xi+1), φ∗Y(yj+1))+
Rk,k+1= P(γk|γk+1) P(γk)P (γk+1) = ρMρD
if γk→ γk+1 is a diagonal transition on the edit lattice
ρM
if γk→ γk+1 is a vertical transition on the edit lattice
ρD
if γk→ γk+1 is a horizontal transition on the edit lattice
1 if yj= ε or xi = ε and yj+1= ε or xi+1= ε P(γk|φ∗X(xi), φ∗Y(yj)) = 1 √ 2πσexp{− 1 2σ2(φ∗X(xi) − φ∗Y(yj))2} if yj 6= ε and xi6= ε α if yj = ε and xi6= ε
where ρM and ρD are respectively the edge densities of the graphs GM and
GD (ρM = |VM|
2
EM ) and φ
∗
X and φ∗Y are, respectively, the leading eigenvectors of
the adjacency matrices for the graph GM and GD. In the remainder, we denote
this graph matching technique by GEDSS.
3.2 Graph matching based on node signatures
Jouili and al. [11] propose a new algorithm for matching and computing the distance between graphs. This approach is based on node signatures notion. In order to construct a signature for a node in an attributed graph, all available information into the graph and related to this node is used. The collection of these informations should be refined into an adequate structure which can pro-vides distances between different node signatures. In this perspective, the node signature is defined as a set composed by four subsets which represent the node attribute, the node degree and the attributes of its adjacent edges and the degrees of the nodes on which these edges are connected. Given a graph G=(V,E,α,β), the node signature of ni∈ V is defined as follows:
γ(ni) =
n
αi, θ(ni), {θ(nj)}∀ij∈E, {βij}∀ij∈E
o
where
– αi the attribute of the node ni.
– θ(ni) the degree of ni.
– {θ(nj)}∀ij∈E the degrees set of the nodes adjacent to ni.
– {βij}∀ij∈E the attributes set of the incident edges to ni.
Then, to compute a distance between node signatures, the Heterogeneous Euclidean Overlap Metric (HEOM) is used. The HEOM uses the overlap met-ric for symbolic attributes and the normalized Euclidean distance for numemet-ric
attributes. Next the similarities between the graphs is computed: firstly, a defi-nition of the distance between two sets of node signatures is given. Subsequently, a matching distance between two graphs is defined based on the node signatures sets. Let Sγ be a collection of local descriptions, the set of node signatures Sγ of
a graph g=(V,E,α,β) is defined as : Sγ( g ) =
n
γ(ni) | ∀ni∈ V
o
Let A=(Va,Ea) and B=(Vb,Eb) be two graphs. And assume that φ : Sγ(A) →
Sγ(B) is a function. The distance d between A and B is given by ϕ which is the
distance between Sγ(A) and Sγ(B)
d(A, B) = ϕ(Sγ(A), Sγ(B)) = min φ
X
γ(ni)∈Sγ(A)
dnd(γ(ni), φ(γ(ni)))
The calculation of the function ϕ(Sγ(A), Sγ(B)) is equivalent to solve an
as-signment problem, which is one of the fundamental combinatorial optimization problems. It consists of finding a maximum weight matching in a weighted bi-partite graph. This assignment problem can be solved by the Hungarian method. The permutation matrix P, obtained by applying the Hungarian method to the cost matrix, defines the optimum matching between two given graphs. In the remainder, we denote this graph matching technique by GMNS.
3.3 Graph probing approach
Lopresti and al. [15] introduce the paradigm of graph probing. This technique consist on using a probe into the graphs to determine some particular informa-tion. The measure of similarity between two graphs is an L1 norm distance of the two corresponding vectors. For the construction of vectors, Lopresti present three classes of construction each one led by a question, Class 0: ”How many vertices with degree n are present in graph G = (V,E)? ”, Class 1: ”How many vertices with in-degree m and out-degree n are present in G? ”, Class2 : ”How many vertices labeled as att are present in G? ”. The use of such class depends on the type of graph.
Therefore, for each graph, a representative vector is computed and the corre-sponding graph distance. Concretely, let G = (V,E) be an undirected graph, the vector associated to G is: PR(G)≡(n0,n1,n2, ...) where ni=|{ v in V | deg(v )=i}|.
So the distance between two graphs is L1(PR1,PR2). In the remainder, we denote
the graph probing technique by GP. 3.4 Graph histogram approach
Papadopoulos and al. [19] present a similarity measure for graphs, which is based on the concept of edit operations. They propose three different primitive opera-tions, which are vertex insertion, vertex deletion and vertex update. While vertex insertions or deletions have a trivial meaning, the update operation is needed to
insert or delete edges incident to a vertex. Additionally they introduce the degree sequence of a graph, i.e. the non-increasing sequence of the degrees of vertices in a graph. The similarity distance between two graphs is defined as the minimum number of primitive operations which are required so that the two graphs have the same degree sequence. To calculate the similarity measure, the sorted graph histogram is introduced, which is a histogram of the degrees of the vertices in a graph. Papadopoulos and al. show also that the L1-distance between two sorted
graph histograms defines their similarity distance. Additionally it is proven that the similarity distance satisfies the metric properties. In some cases, the sorted degree histograms of the graphs in a database are of different dimensionality if not all graphs are of the same order. To allow the use of index structures for vector spaces, the authors introduce a histogram folding technique to achieve a constant dimensionality of the histograms for all graphs. In the remainder, we denote this method by GH.
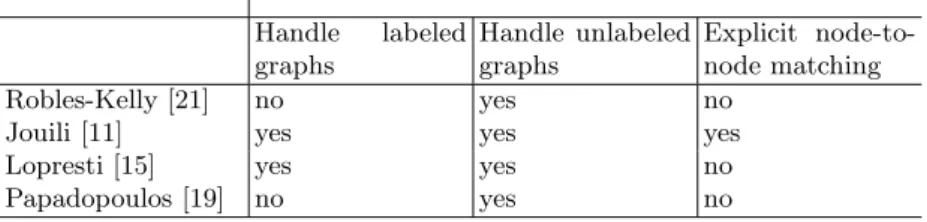
Table 1 provides a description of the selected graph similarity measures. In this table, we show the capability of each graph similarity measure to deal with labeled or unlabeled graphs and it provides a node-to-node matching.
Table 1.A summarization of the selected graph similarity measures
Handle labeled graphs Handle unlabeled graphs Explicit node-to-node matching Robles-Kelly [21] no yes no
Jouili [11] yes yes yes Lopresti [15] yes yes no Papadopoulos [19] no yes no
4
Experimental results
In this section, we provide a performance comparison of the graph similarity mea-sures described above. In addition, even if the statistical/structural approaches comparison is not the aim of this paper, we also use the generic Fourier de-scriptor (GFD) well known for its good performance [24] to show the general behavior of structural approaches vs a statistical one. In GFD, feature vectors are created from images by extracting information in the frequency domain. This statistical descriptor is invariant to rotation and scaling. In our experiments, we use the Euclidean distance to compute the distance between images represented by GFD feature vectors. Four graphic databases have been used to perform the comparison study. The precision/recall curves are used to measure retrieval per-formances. The leave-one-out protocol is used to provide precision/recall curves.
4.1 Data sets
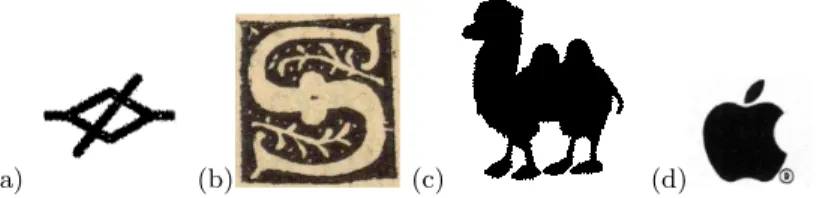
The graph retrieval tasks considered in this paper includes the retrieval of line drawings (symbols), ancient documents (ornamental letters), the set of trademark-logos and LEMS shape database. Figure 1 represents samples for each database used.
(a) (b) (c) (d)
Fig. 1.Samples from: (a) GREC database, (b) Ornamental letters database, (c) Shape database, (d) Logo database
– GREC database: The GREC database [20] (see figure 1(a)) consists of graphs representing symbols from architectural and electronic drawings. Here, the ending points (ie corners, intersections and circles) are represented by nodes which are connected by undirected edges and labeled as lines or arcs. The graph database used in our experiments has of 528 graphs, 24 classes and 22 graphs per class.
– Ornamental letters database: The ornamental letters database (see figure 1(b)) contains lettrine (graphical objects) extracted from digitized ancient document4. Since one lettrine contains a lot of information (i.e. texture,
dec-orated background, letters), the graphs are extracted from a region-based segmentation [9] of the lettrine with a user-based parameterization tech-nique. The nodes of the graph are represented by the regions and the edges describe their adjacency relationships. The graph database used in our ex-periments consists of 280 graphs, 4 classes and 70 graphs per class.
– Shape database: We use the shapes provided by the LEMS laboratory of the Brown University [23] (see figure 1(c)). The graphs are extracted from the shapes by skeletonizing and applying a polygonal approximation to the skeleton to obtain straight line segments. For each line segment, we locate endpoints and the graphs are based on the Delaunay triangulations of these endpoints. The graph database used in our experiments has 216 graphs, 18 classes and 12 graphs per class.
– Logo database: This database (see figure 1(d)) consists of graphs repre-senting binary images of trademark-logos. Here, graphs are extracted by the delaunay triangulations on the detecting points of interest using Harris al-gorithm [10]. The graph database used in our experiments consists of 80 graphs, with 10 classes and 8 graphs per class.
4
Provided by the CESR - University of Tours on the context of the ANR Navidomass project http://l3iexp.univ-lr.fr/navidomass/
Table 2 provides a description of the characteristics of the used graph data sets. Each graph data set is described by the maximum number and the average of nodes and edges (max nodes/edges and φ nodes/edges). Let us recall that all the graphs used in this paper are weighted graphs. That is, there is no labels attached to the nodes, but each edge is weighted by a unique numeric label.
max nodes max edges φ nodes φ edges GREC 24 29 11.54 11.6 Ornamental Letter 178 4314 97.6 1779.6
Shape 73 2592 29.1 471.8 Logo 292 802 102.5 264.9
Table 2.Description of the four graph data sets
4.2 Results analysis
The results of our experiments for these four databases with the four graph matching measures are presented in figure 2.
From the precision-recall curves, we can remark that the performance of the graph matching methods depend on the databases and more particularly the description we put in the graph. For the GREC database, the matching measures (GP, GH and GMNS) that use simple structural modification perform similarly and better than the GEDSS method which use a string representation for graphs. We realize that for graphs with low edge and node densities (as the case of the GREC database) the string-based representation is not discriminant. In addition, the GMNS method provides a performance peak for low recall values, and it joins the performance of the GP and GH methods for high recall values. The discrimination of the node signatures provides a good robustness for this kind of database.
From the results provided on the Lettrine database, we see that all the dis-tance measures provide similar results with a little less performance for the GP technique. This may be explained by the fact that the different methods pro-duce a quite similar response to the structural errors between the graphs used to represent the ornamental letters. In the other way, one can conclude that this kind of graph representation (region adjacency graph) of the ornamental letter is more or less robust to different graph matching methods.
In the case of the shape database, the performance of the graph probing fails clearly in comparison with other distance measures. It seems that the probe of the node degree is not a good discriminating feature for this database which presents important structural errors between graphs in different classes. Fur-ther, the GEDSS method which has shown previously good results for similar databases (see [21]), provides the better retrieval results.
(a) 0 0.1 0.2 0.3 0.4 0.5 0.6 0.7 0.8 0.9 1 0 0.1 0.2 0.3 0.4 0.5 0.6 0.7 0.8 0.9 1 Precision Recall GMNS GEDSS GH GP GFD (b) 0.2 0.3 0.4 0.5 0.6 0.7 0.8 0.9 1 0 0.1 0.2 0.3 0.4 0.5 0.6 0.7 0.8 0.9 1 Precision Recall GMNS GEDSS GH GP GFD (c) 0.1 0.2 0.3 0.4 0.5 0.6 0.7 0.8 0.9 1 0.1 0.2 0.3 0.4 0.5 0.6 0.7 0.8 0.9 1 Precision Recall GMNS GEDSS GH GP GFD (d) 0 0.1 0.2 0.3 0.4 0.5 0.6 0.7 0.8 0.9 1 0 0.1 0.2 0.3 0.4 0.5 0.6 0.7 0.8 0.9 1 Precision Recall GMNS GEDSS GH GP GFD
Fig. 2. Precision-Recall curves on: (a) GREC database, (b) Ornamental letters database, (c) Logo database, (d) Shape database
For the logo database, all the distance measures provide similar behaviors. Here, the graph probing keeps the leader position among the other distances. In addition, the provided results of all the distance measures are particularly better in comparison with the other databases. This may be due to the suit-able graph representation used for this database. We can think that the graph representation approaches used for other databases is not necessary the most suitable. In addition, different distance measures provide quite similar results for a given graph representation as the case of the Ornamental letters database. From all these results, we can remark that the GP and GEDSS methods are more sensitive to the representation we put in the graph.
In addition, the GFD descriptor outperforms the results of all the graph similarity measures for the Shape database. However, for the Ornamental letters and the Logo databases in which the structural information is more important we remark that the structural approaches provide better results.
5
Conclusion and perspectives
In this paper we have compared the performance of four graph matching meth-ods for graph retrieval with different kind of document databases. The evalu-ation is performed using Precision rate against Recall rate. Our experimental results show that the performance of each graph distance measure depends on the databases and the approaches are also more and less robust to the variabil-ity of the representation. That is to say, a given graph distance can provide a good performance for one database and poor performance for an other database. Moreover, for a good graph representation we can remark that the performances of different graph matching methods are quite similar. In future works we want to study the behavior of these methods against the representation we put in the graph and the type of database.
References
1. R. Ambauen, S. Fisher, and B. H. Graph edit distance with node splitting and merging, and its application to diatom identification. IAPR-TC15 Workshop on
GbRPR, LNCS 2726, pages 95–106, 2003.
2. R. Baeza-Yates and G. Valiente. An image similarity measure based on graph matching. Proc. International Symposium on String Processing Information
Re-trieval, pages 28–38, 2000.
3. H. G. Barrow and R. J. Popplestone. Relational descriptions in picture processing.
In Machine Intelligence, 4:377–396, 1971.
4. H. Bunke. Attributed of programmed graph grammars and their application to schematic diagram interpretation. IEEE Transactions on Pattern Analysis and
Machine Intelligence, 4(6):574–582, Novembre 1982.
5. H. Bunke. Recent developments in graph matching. Pattern Recognition, 2000.
Proceedings. 15th International Conference on, pages 117–124 vol.2, 2000.
6. H. Bunke, S. G¨unter, and X. Jiang. Towards bridging the gap between statisti-cal and structural pattern recognition: Two new concepts in graph matching. In
S. Singh, N. A. Murshed, and W. G. Kropatsch, editors, ICAPR, volume 2013 of
Lecture Notes in Computer Science, pages 1–11. Springer, 2001.
7. D. Conte, P. Foggia, C. Sansone, and M. Vento. Thirty years of graph matching in pattern recognition. International Journal of Pattern Recognition and Artificial
Intelligence, 18(3):265–298, 2004.
8. C. Di Ruberto, G. Rodriguez, and L. Casta. Recognition of shapes by morpholog-ical attributed relational graphs. AIIA, 2002.
9. P. F. Felzenszwalb and D. P. Huttenlocher. Efficient graph-based image segmen-tation. International Journal of Computer Vision, 59(2):167–181, 2004.
10. C. Harris and M. Stephens. A combined corner and edge detection. In Proceedings
of The Fourth Alvey Vision Conference, pages 147–151, 1988.
11. S. Jouili and S. Tabbone. Graph matching using node signatures. In IAPR-TC15
Workshop on GbRPR, Italy, LNCS 5534, Springer, pages 154–163, 2009.
12. A. Karray, J.-M. Ogier, S. Kanoun, and M. A. Alimi. An ancient graphic documents indexing method based on spatial similarity. In W. Liu, J. Llad´os, and J.-M. Ogier, editors, GREC, volume 5046 of Lecture Notes in Computer Science, pages 126–134. Springer, 2007.
13. V. I. Levenshtein. Binary codes capable of correcting deletions, insertions, and reversals. Soviet Physics Doklady, 10(8):707–710, 1966.
14. C.-Y. Li and C.-T. Hsu. Region correspondence for image retrieval using graph-theoretic approach and maximum likelihood estimation. International Conference
on Image Processing, pages 421–424, 2004.
15. D. P. Lopresti and G. T. Wilfong. A fast technique for comparing graph rep-resentations with applications to performance evaluation. IJDAR, 6(4):219–229, 2003.
16. M. Neuhaus. Edit distance-based kernel functions for structural pattern classifica-tion. Pattern Recognition, 2006.
17. I. Ounis and M. Pasca. Modeling, indexing and retrieving images using conceptual graphs. In G. Quirchmayr, E. Schweighofer, and T. J. M. Bench-Capon, edi-tors, DEXA, volume 1460 of Lecture Notes in Computer Science, pages 226–239. Springer, 1998.
18. J. Pan, H.Yang, C. Faloutsos, and P. Duygulu. Gcap: Graph-based automatic image captioning. In Proceedings of the 4th International Workshop on Multimedia
Data and Document Engineering, 2004.
19. A. N. Papadopoulos and Y. Manolopoulos. Structure-based similarity search with graph histograms. Proceedings of International Workshop on Similarity Search
(DEXA IWOSS’99), pages 174–178, Septembre 1999.
20. K. Riesen and H. Bunke. Iam graph database repository for graph based pattern recognition and machine learning. In N. da Vitoria Lobo, T. Kasparis, F. Roli, J. T.-Y. Kwok, M. Georgiopoulos, G. C. Anagnostopoulos, and M. Loog, editors,
SSPR/SPR, volume 5342 of Lecture Notes in Computer Science, pages 287–297.
Springer, 2008.
21. A. Robles-Kelly and E. R. Hancock. Graph edit distance from spectral seriation.
IEEE Trans. Pattern Anal. Mach. Intell., 27(3):365–378, 2005.
22. A. Sanfeliu and K. Fu. A distance measure between attributed relational graphs for pattern recognition. IEEE Trans. on Systems, Man and Cybernetics, 13(3):353– 362, May 1983.
23. D. Sharvit, J. Chan, H. Tek, and B. B. Kimia. Symmetry-based indexing of image databases. J. Visual Communication and Image Representation, 9:366–380, 1998. 24. D. Zhang and G. Lu. Shape-based image retrieval using generic fourier descriptor.