Publisher’s version / Version de l'éditeur:
Journal of the American Chemical Society, 125, 47, pp. 14642-14647, 2003-10-29
READ THESE TERMS AND CONDITIONS CAREFULLY BEFORE USING THIS WEBSITE. https://nrc-publications.canada.ca/eng/copyright
Vous avez des questions? Nous pouvons vous aider. Pour communiquer directement avec un auteur, consultez la première page de la revue dans laquelle son article a été publié afin de trouver ses coordonnées. Si vous n’arrivez pas à les repérer, communiquez avec nous à PublicationsArchive-ArchivesPublications@nrc-cnrc.gc.ca.
Questions? Contact the NRC Publications Archive team at
PublicationsArchive-ArchivesPublications@nrc-cnrc.gc.ca. If you wish to email the authors directly, please see the first page of the publication for their contact information.
NRC Publications Archive
Archives des publications du CNRC
This publication could be one of several versions: author’s original, accepted manuscript or the publisher’s version. / La version de cette publication peut être l’une des suivantes : la version prépublication de l’auteur, la version acceptée du manuscrit ou la version de l’éditeur.
For the publisher’s version, please access the DOI link below./ Pour consulter la version de l’éditeur, utilisez le lien DOI ci-dessous.
https://doi.org/10.1021/ja036168c
Access and use of this website and the material on it are subject to the Terms and Conditions set forth at
Overlooked difference between hydrogen bonds of equal strength
formed between catechol and an oxygen or nitrogen base. Experiments
and DFT calculations
Foti, Mario C.; DiLabio, Gino A.; Ingold, K. U.
https://publications-cnrc.canada.ca/fra/droits
L’accès à ce site Web et l’utilisation de son contenu sont assujettis aux conditions présentées dans le site LISEZ CES CONDITIONS ATTENTIVEMENT AVANT D’UTILISER CE SITE WEB.
NRC Publications Record / Notice d'Archives des publications de CNRC:
https://nrc-publications.canada.ca/eng/view/object/?id=ebc1a7ee-4a37-46f6-b0a9-61df133eef7f https://publications-cnrc.canada.ca/fra/voir/objet/?id=ebc1a7ee-4a37-46f6-b0a9-61df133eef7f
Overlooked Difference between Hydrogen Bonds of Equal
Strength Formed between Catechol and an Oxygen or
Nitrogen Base. Experiments and DFT Calculations
Mario C. Foti,*,†Gino A. DiLabio,*,‡and K. U. Ingold§
Contribution from the Istituto di Chimica Biomolecolare del CNR-Sezione di Catania, Via Del Santuario 110, 1-95028 ValVerde (CT), Italy, National Institute for Nanotechnology,
National Research Council of Canada W6-010 ECERF, 9107 116thStreet,
Edmonton, AB, Canada T6G 2V4, and National Research Council of Canada, 100 Sussex DriVe, Ottawa, ON, Canada K1A 0R6
Received May 15, 2003; E-mail: foti@issn.ct.cnr.it; Gino.DiLabio@nrc.ca
Abstract:The IR spectrum of catechol in CCl4shows two fairly sharp O-H stretching bands of roughly equal absorbance at 3615.0 and 3569.6 cm-1due, respectively, to the “free” OH and the intramolecularly H-bonded OH groups. Intermolecular H-bond formation between the “free” OH and a hydrogen bond acceptor (HBA) decreases its stretching frequency by several hundred wavenumbers and simultaneously decreases the frequency of the intramolecularly H-bonded OH by a few tens of wavenumbers. The magnitude of these frequency shifts, ∆υinterand ∆υintra, respectively, are very well reproduced by DFT calculations. As would be expected, the magnitudes of ∆υinterand ∆υintraincrease as the HB accepting ability of the HBA increases as quantified, on a relative scale, by the HBA’s β2Hvalues (Abraham et al.J. Chem. Soc. Perkin
Trans. 21990, 521). However, plots of experimental, or calculated, frequency shifts versus β2Hreveal that ∆υinterand ∆υintraare ca. 40% larger for a nitrogen atom HBA than for an oxygen atom HBA having equal HBA activity. We hypothesize that for HBAs of equal strength, i.e., of equal β2H, the Hbond in (OH -O)interis shorter and, hence, intrinsically stronger than the H-bond in the (O-H- - -N)inter. However, we further hypothesize that there is more charge separation in the H-bond to N because N is a better proton acceptor than O. Hence, it is the greater Coulombic attraction in (O-H- - -N)interwhich strengthens this H-bond and compensates for its greater length. Theoretical calculations lend support to these hypotheses.
We recently described a previously overlooked feature in the IR spectra of intermolecularly hydrogen-bonded 1,2-benzene-diols (catechols) and naphthalene 1,2-benzene-diols.1 These diols contain either a five-membered cyclic intramolecular H-bond (catechols and 2,3-naphthalene diol) or a six-membered cyclic intramo-lecular H-bond (1,8-naphthalene diol). In CCl4, the IR spectra of all the diols show two fairly sharp O-H fundamental stretching bands of roughly equal absorbance separated by 42-138 cm-1. Addition of a low concentration of DMSO, a strong hydrogen bond acceptor (HBA), causes the band due to the intramolecularly H-bonded OH group to decrease in absorbance to roughly half the extent that the “free” OH band decreases in absorbance. The “free” OH forms an intermolecular H-bond with the DMSO (to give a very broad band ca. 400 cm-1lower in frequency), whereas the intramolecularly H-bonded OH does not. What had been overlooked was that as the DMSO concentration was increased the band due to the intramolecularly H-bonded OH group first broadened and then evolved into a new, relatively sharp band 23.5-92 cm-1lower in frequency. The magnitude of the HBA-induced shift in the IR frequency,
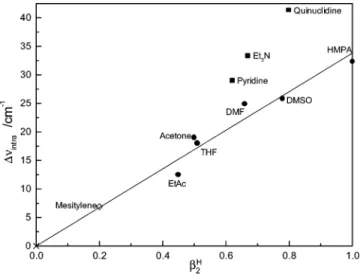
∆υintra, of the intramolecularly H-bonded OH group, identified hereafter as (O-H- - -O)intra, for 3,5-di-tert-butylcatechol was found to give an excellent linear correlation with the relative HB-accepting abilities of seven added bases (as conveniently quantified on a scale ranging from 0.00 to 1.00, by the β2H values of Abraham et al.2), see Figure 1. The seven bases were mesitylene, ethyl acetate, acetone, THF, DMF, DMSO, and HMPA. With the exception of mesitylene, these bases were, fortuitously, HBAs in which an oxygen atom is the acceptor of an intermolecular H-bond from the “free” OH group in this catechol, represented hereafter as (O-H- - -O)inter. Later, three nitrogen atom-acceptor bases were employed, pyridine, triethy-lamine, and quinuclidine, giving intermolecular H-bonds (O-H- - -N)inter. All these nitrogen bases gave larger frequency shifts to the (O-H- - -O)intramoiety than would have been predicted from the data for the oxygen bases (see Figure 1).
A systematic underestimation of β2H for nitrogen bases or overestimation of β2
H
for oxygen bases could account for the data in Figure 1, but this seemed very improbable in view of the rigor with which Abraham established his β2
H scale.2 Nevertheless, we immediately checked that each of the three nitrogen bases (plus 3,5-dichloropyridine) and two oxygen bases
†Istituto di Chimica Biomolecolare del CNR. ‡NINT.
§NRC Ottawa.
(1) Foti, M. C.; Barclay, L. R. C.; Ingold, K. U. J. Am. Chem. Soc. 2002, 124, 12 881-12 888.
(2) Abraham, M. H.; Grellier, P. L.; Prior, D. V.; Morris, J. J.; Taylor, P. J. J. Chem. Soc., Perkin Trans 2 1990, 521-529.
(ethyl acetate and DMSO) had β2 H
values that not only agreed with the literature2but also were essentially identical whether calculated from the measured equilibrium constants for 1:1 H-bond complex formation in CCl4 with phenol or 3,5-dichlorophenol in the usual way.1-3 These two phenols were chosen because their HB-donating abilities (as conveniently quantified on a relative scale ranging from 0.00 to nearly 1.0 by the R2
H
values of Abraham et al.4) bracket the HB-donating abilities of 3,5-di-tert-butylcatechol (R2H ) 0.685)1 and cat-echol (R2H ) 0.726),1 viz.,4 phenol (R
2
H ) 0.590) and 3,5-dichlorophenol (R2H)0.774). The results are given in Table 1. We also made certain5that the R
2 H
value for the very strong HBD, 3,5-dichlorophenol, was in agreement with the literature4 and essentially the same whether measured with oxygen bases (ethyl acetate and DMSO) or with nitrogen bases (pyridine and triethylamine). These data are also included in Table 1. The method for calculating β2H and R2H values has been so thor-oughly described1-4that it will not be repeated here.
Because there are no systematic errors in the relevant β2H values, the results shown in Figure 1 require that intermolecular
H-bonds of equal strength formed with oxygen and nitrogen bases differ in some fundamental manner. Because of the way in which β2H values are obtained,2 “equal intermolecular H-bond strengths” means equal equilibrium constants, Ki, for 1:1 complex formation between dilute solutions of an oxygen or nitrogen base (HBA) and a dilute solution of a given acid (ArOH) in CCl4at room temperature, viz., Ki) ([ArOH -HBA]H-bonded)/([ArOH]free[HBA]free). This is the case because the entropy change that occurs upon H-bond formation will be approximately the same for all HBAs.
Recognizing the existence of an O-base/N-base difference led us to hypothesize that for equal strength H-bonds the H-bond in (O-H- - -O)interis shorter than the H-bond in (O-H- - -N)inter.
Because oxygen is more electronegative than nitrogen the electron density maxima of the orbitals containing the lone pairs of electrons on oxygen are closer to the oxygen nucleus than the electron density maximum of the lone pair orbital on nitrogen is to the nitrogen nucleus. Because H-bonding involves these lone pairs, the H-bond in (O-H- - -O)interwill tend to be shorter than that in (O-H- - -N)inter, and the shorter bond will be intrinsically the stronger. However, there is expected to be a compensating factor that will strengthen the longer (OH -N)interH-bond (and to some extent, shorten it). That is, there is likely to be more charge separation in (O-H- - -N)interthan in (O-H- - -O)interbecause nitrogen is a stronger proton acceptor than oxygen. Coulombic forces will therefore tend to make the intrinsically weaker and longer (O-H- - -N)interH-bond equal in strength, though not in length, vide infra, to the (OH -O)interH-bond:
With no obvious way to check these hypotheses, a combina-tion of density funccombina-tional theory (DFT) calculacombina-tions validated, when possible, by experimental measurements was (again)6 employed. To simplify the calculation we moved from 3,5-di-tert-butylcatechol to catechol itself where the calculations were validated by the excellent agreement between the observed HBA-induced shift in the intramolecular H-bond band frequen-cies and the calculated shifts.
Calculations and experiments were also carried out on 1,8-naphthalene diol with results concordant with the catechol data. Nevertheless, these results have been relegated to the Supporting Information because the same validation test largely failed. This was not because of failed calculations but because the HBA-induced shifts in the intramolecular H-bonded OH group could not be experimentally determined in many cases (see Figure S1 in Supporting Information).
(3) (a) Astolfi, P.; Greci, L.; Paul, T.; Ingold, K. U. J. Chem. Soc., Perkin Trans 2 2001, 1631-1633. (b) Snelgrove, D. W.; Lusztyk, J.; Banks, J. T.; Mulder, P.; Ingold, K. U. J. Am. Chem. Soc. 2001, 123, 469-477. (4) Abraham, M. H.; Grellier, P. L.; Prior, D. V.; Duce, P. P.; Morris, J. J.;
Taylor, P. J. J. Chem. Soc., Perkin Trans 2 1989, 699-711.
(5) This was in the nature of “overkill” because 3,5-dichlorophenol is one of Abraham’s reference acids.2Equilibrium constants in CCl
4for 1:1 complex
formation between this phenol and 27 bases make its R2H value well
defined and, by implication, independent of the base.
(6) (a) Pratt, D. A.; Wright, J. S.; Ingold, K. U. J. Am. Chem. Soc. 1999, 121, 4877-4882. (b) Pratt, D. A.; de Heer, M. I.; Mulder, P.; Ingold, K. U. J. Am. Chem. Soc. 2001, 123, 5518-5526. (c) Pratt, D. A.; DiLabio, G. A.; Valgimigli, L.; Pedulli, G. F.; Ingold, K. U. J. Am. Chem. Soc. 2002, 124, 11 085-11 092. (d) DiLabio, G. A.; Litwinienko, G.; Lin, S.; Pratt, D. A.; Ingold, K. U. J. Phys. Chem. A 2002, 106, 11 719-11 725.
Figure 1. Plot of ∆υIntra versus β2 H
for 3,5-di-tert-butylcatechol com-plexed with various oxygen (b) and nitrogen (9) bases. The straight line is the best fit to all of the data except those marked with 9, and is taken from ref 1. The fit is forced through (0,0).
Table 1. Measured R2HValues for 3,5-Dichlorophenol Using Four
Reference Bases and β2HValues for Various Bases Using Both
3,5-dichlorophenol and Phenol as the Reference Acids, with Literature Values of β2H(ref 2) for Comparison
phenol 3,5-Cl2C6H3OH C6H5OH literature base R 2 H a β 2 H β2 H β2 H ethyl acetate 0.79 0.48 0.40 0.45 pyridine 0.79 0.65 0.61 0.62 3,5-dichloropyridine 0.41 0.41 triethylamine 0.79 0.67 0.67 0.67 dimethyl sulfoxide 0.74 0.76 0.78 0.78 quinuclidine 0.81 0.79 0.80 aLiterature,40.77.
H-Bonds between Catechol and O or N Bases A R T I C L E S
Results
HBA-Induced Shifts in the O-H Stretching Frequencies
of Catechol.Fourier Transform infrared (FTIR) spectra were
obtained in CCl4 at room temperature using low catechol concentrations (ca. 3 mM) where self-association does not occur.1There are two O-H stretching bands, the one at 3615.0 cm-1is due to the “free” OH group, and the one at 3569.6 cm-1 is due to the intramolecularly H-bonded OH group. Addition of a HBA (3-50 mM) reduces the absorbance of both bands and, at sufficiently high HBA concentrations, both bands are replaced by new bands at lower frequencies (for quinuclidine see Figure 2 and for DMSO see Figure 4 in ref 1).7The “free” OH band shifts to dramatically lower frequencies (by hundreds of wavenumbers). The (O-H- - -HBA)interband becomes ex-tremely broad (e.g., width at half-height, ∆υ(1/2)≈ 190 cm-1 for acetone as the HBA) which makes the assignment of many band maximum frequencies difficult or even impossible. The (O-H- - -O)intraband shifts to lower frequencies by only a few tens of wavenumbers and broadens (see Figure 2). This broadening reflects the thermal distribution of intermolecular HB complexes (as is indicated by the large ∆υ(1/2)values for (O-H- - -HBA)intercomplexes). The integrated band intensities of the shifted (O-H- - -O)intrabands, at least in those cases where reliable measures of band areas could be obtained, remain essentially unchanged.
The experimental frequency shifts for the two catechol OH stretching bands which have been produced by 15 HBAs are summarized in Table 2. Hydrogen bonding of the HBAs to the intramolecularly bonded O-H group does not occur to any significant extent under the current experimental conditions. (In this connection, we have previously reported that it takes ca. 200 mM DMSO to reduce the intensity of the O-H stretch in 2-methoxyphenol by 40%. This band is not broadened and a second broad band “grows in” ca. 325 cm-1lower in frequency, see Figure 5 of ref 1).
Density Functional Theory (DFT) calculations on the H-bonded complexes were performed using the B3LYP8functional with 6-31G(d) basis sets for geometry optimization and fre-quency calculations. This level of theory is known to yield vibration frequencies that are generally too large by ca. 4%.9It is therefore not surprising that catechol’s two O-H stretching frequencies were calculated to be 3774.0 and 3716.2 cm-1, values which are somewhat higher than the measured (in CCl4) frequencies1 of 3615.0 and 3569.6 cm-1. The method of calculation is therefore expected to produce reliable values for HBA-induced shifts in O-H stretching frequencies, ∆υ. Similar conclusions were reached by Korth et al. in their study of intramolecular hydrogen bonding in 2-substituted phenols.10The calculated values of ∆υ for (O-H- - -O)intra, ∆υintra, and (O-H- - -HBA)inter, ∆υinter, are given beside the experimental values in Table 2.
The enthalpies of H-bond formation were computed at the MP2 ) FC/6-31+G(d,p)//B3LYP/6-31G(d) level and basis set incompleteness effects were approximated using the
counter-poise correction scheme.11Comparisons between calculated and experimental12H-bond enthalpies, (-∆H
HB)inter, for 1:1 com-plexes of p-fluorophenol with acetone (6.1 vs 4.8 kcal/mol13), ethyl acetate (6.0 vs 4.7 kcal/mol), and tetrahydrofuran (7.2 vs 5.7 kcal/mol) indicate that the present theoretical method overestimates (-∆HHB)interby 1.3-1.5 kcal/mol. The (-∆HHB)interdata for the catechol-HBA 1:1 complexes, which are also expected to be overestimated by ca. 1.4 kcal/mol, are presented in Table 3 together with some relevant geometric data for these complexes. Table 3 also includes the charge (q/e
-) transferred from the HBA to catechol, as determined using Natural Bond Orbital (NBO) analysis14 at the MP2 ) FC/ 6-31+G(d,p)//B3LYP/6-31G(d) level. In some cases, the NBO
(7) A detailed description of the changes in the IR spectrum of 3,5-di-tert-butylcatechol as a function of DMSO concentration has been given previously.1
(8) (a) Becke, A. D. J. Chem. Phys. 1993, 98, 5648-5652. (b) Lee, C.; Yang, W.; Parr, R. G. Phys ReV. B. 1988, 37, 785-789.
(9) Scott, A. P.; Radom, L. J. Phys. Chem. 1996, 100, 16 502-16 513. (10) Korth, H.-G.; de Heer, M. I.; Mulder, P. J. Phys. Chem. A 2002, 106,
8779-8789.
(11) See, for example: Schwenke, D. W.; Truhlar, D. G. J. Chem. Phys. 1985, 82, 2418-2426, and references therein.
(12) Gurka, D.; Taft, R. W. J. Am. Chem. Soc. 1969, 91, 4794-4801. (13) This experimental value is for 2-butanone.12
(14) Version 3.1 is implemented in the Gaussian-98 program package15and used
in the present work. A more recent version of the program is NBO 4.M Glendening, E. D.; Badenhoop, J. K.; Reed, A. E.; Carpenter, J. E.; Weinhold, F., Theoretical Chemistry Institute, University of Wisconsin, Madison 1999.
Table 2. Experimental and Calculated ∆υIntraand ∆υInter(in cm-1) in Catechol/HBA Complexes
∆υIntra ∆υInter
HBA β2Ha exptb calcdc exptb calcd
1mesitylene 0.20 7.0 6.7 112 113 23,5-dichloropyridine 0.41 15.1 18.1 289 339 3acetonitrile 0.44 17.4 18.3 197 157 4ethyl acetate 0.45 15.6 16.5 d 283 5diethyl ether 0.45 17.0 16.4 327 298 6acetone 0.50 15.1 15.7 297 292 7tetrahydrofuran 0.51 16.0 18.4 345 343 8pyridine 0.62 27.3 27.8 d 462 9dimethylformamide 0.66 24.3 22.4 d 375 10triethylamine 0.67 30.1 30.3 (740)e 726 11trimethoxyphosphine oxide 0.76 16.6 16.5 375 307 12dimethyl sulfoxide 0.78 23.5f 18.9 432 500 13quinuclidine 0.80 33.7 31.7 d 684 141,4-diazabicyclo[2.2.2]octane 0.81 28.5 29.8 d 663 15hexamethylphosphoramide 1.00 29.0 29.4 d 413
aRef 2.bIn CCl4at room temperature.cThe calculated O-H stretching
frequency in the catechol anion is 3151 cm-1, corresponding to ∆υIntra) 565 cm-1.dIndeterminate.eBroad band, maximum subject to considerable
error because of incomplete cancellation of contributions from C-H stretching bands.fIncorrectly given as 19 cm-1in ref 1.
Figure 2. FT-IR spectra of catechol in CCl4 (solid line) and catechol
complexed with quinuclidine (dashed line). The origins of the bands are indicated.
calculations did not complete properly due to problems with basis set linear dependencies.
Additional calculations were performed on catechol-Et2O and catechol-DABCO complexes with the HBA H-bonded to the intramolecularly H-bonded O-H group of catechol. These binding energies are more than 3 kcal/mol lower than those in which the bases are bound to the “free” O-H group. In addition, the calculated ∆υintra values for these two structures are 187 (Et2O) and 548 (DABCO) cm-1, supporting our conclusion that the complexes examined by IR spectroscopy in the present work have the HBA H-bonded to the “free” O-H group.
Discussion
The agreement between theory and experiment for the HBA-induced shifts in frequency of the intramolecularly bonded O-H group stretching bands of catechol is excellent (see Table 2 and Figure 3). The corresponding plot for ∆υinteris also excellent (see Figure 4) but has fewer data points because the band maximum could not always be determined. The good agreement between theory and experiment shown in Figures 3 and 4 is extremely gratifying in view of the small size of the basis set used for the geometry optimization/frequency calculations.16 (15) Frisch, M. J.; Trucks, G. W.; Schlegel, H. B.; Scuseria, G. E.; Robb, M.
A.; Cheeseman, J. R.; Zakrzewski, V. G.; Montgomery, J. A., Jr.; Stratmann, R. E.; Burant, J. C.; Dapprich, S.; Millam, J. M.; Daniels, A. D.; Kudin, K. N.; Strain, M. C.; Farkas, O.; Tomasi, J.; Barone, V.; Cossi, M.; Cammi, R.; Mennucci, B.; Pomelli, C.; Adamo, C.; Clifford, S.; Ochterski, J.; Petersson, G. A.; Ayala, P. Y.; Cui, Q.; Morokuma, K.; Rega, N.; Salvador, P.; Dannenberg, J. J.; Malick, D. K.; Rabuck, A. D.; Raghavachari, K.; Foresman, J. B.; Cioslowski, J.; Ortiz, J. V.; Baboul, A. G.; Stefanov, B. B.; Liu, G.; Liashenko, A.; Piskorz, P.; Komaromi, I.; Gomperts, R.; Martin, R. L.; Fox, D. J.; Keith, T.; Al-Laham, M. A.; Peng, C. Y.; Nanayakkara, A.; Challacombe, M.; Gill, P. M. W.; Johnson, B.; Chen, W.; Wong, M. W.; Andres, J. L.; Gonzalez, C.; Head-Gordon, M.; Replogle, E. S.; Pople, J. A. Gaussian 98, revision A.11.3, Gaussian, Inc., Pittsburgh, PA, 2002. This package was used for all the calculations in the present work.
Figure 3. Plot of calculated versus experimental ∆νintravalues for catechol/
HBA complexes. Oxygen atom acceptor bases, b; nitrogen atom acceptor bases, 9; mesitylene, ). The HBAs are numbered as in Table 2. The straight line drawn in this Figure has a slope of 1.0.
Figure 4. Plot of calculated versus experimental ∆νintervalues for catechol/
HBA complexes. Οxygen atom acceptor bases, b; nitrogen atom acceptor bases, 9 and mesitylene, ). The HBAs are numbered as in Table 2. The straight line has a slope of 1.0.
Figure 5. Plot of experimental ∆υintravalues for catechol/HBA complexes
versus β2 H
. Oxygen atom acceptor bases, b, solid line; nitrogen atom acceptor bases, 9, dashed line and mesitylene, ) (not included in either fitting). The HBAs are numbered as in Table 2. The lines have been forced through (0,0).
Table 3. Calculated Hydrogen-Bond Enthalpies ((-∆HHB)Inter
/kcal/mol), Hydrogen-Bond Lengths (r(O-H- -HBA)Inter/Å), and
Charge Transferred (q/e-) in Catechol/HBA Complexes
HBAa (−∆H
HB)inter r(O−H- - -HBA)inter qb
1 4.1 2.322c d 2 7.0 1.879 -0.045 3 5.7 1.954 -0.031 4 7.4 1.806 -0.036 5 7.5 1.791 -0.045 6 6.4 1.811 -0.039 7 7.7 1.747 d 8 8.8 1.827 -0.056 9 8.1 1.754 -0.049 10 12.5 1.781 -0.072 11 8.5 1.763 d 12 10.5 1.715 -0.059 13 10.8 1.762 -0.068 14 10.3 1.768 -0.065 15 11.2 1.699 d
aThe HBAs are numbered as in Table 2.bElectron density is transferred
from the HBA to the catechol.cDistance to nearest ring carbon.d
Calcu-lation fails due to linear dependency problems.
H-Bonds between Catechol and O or N Bases A R T I C L E S
We confirmed (probably unnecessarily) that β2Hparameters are true, i.e., acid-independent, measures of the relative HB-accepting abilities of bases and, hence, of the relative strengths of the HBs they form with acids. The plot of experimental ∆υintra vs β2Hfor 3,5-di-tert-butylcatechol (Figure 1) and the similar plot for catechol (Figure 5) show that these frequency shifts correlate poorly with the strengths of the (O-H- - -HBA)inter H-bonds as indicated by β2H, with R ) 0.75 and SD ) 4.6 cm-1 (line not shown in Figure 5). Korth et al.10 have also reported a poor correlation between the OH band frequencies of ortho-substituted phenols and (-∆HHB)intra. However, im-proved relationships are obtained by analyzing the data in terms of whether the acceptor atom in the HBA is oxygen, viz., R ) 0.83, SD ) 3.3 cm-1 or nitrogen, viz., R ) 0.94, SD ) 2.6 cm-1. (The ∆υ
intravalue for mesitylene, shown by a diamond in Figure 5 was not included in these correlations). The least-squares fitting (forced through (0,0)) of the data for the oxygen and nitrogen bases give lines with slopes of 30.1 ( 1.8 and 40.5 ( 1.7 cm-1 (errors represent one standard deviation of the slope), respectively. A statistical analysis of the data (student’s t-test) indicates that the two data sets (fit to y ) mx + b) are distinct sets with a level of confidence >95%.
Turning to the intermolecular HBs, a plot of calculated ∆υinter for catechol/HBAs vs β2H(see Figure S2) can also be divided into two data sets, one for oxygen atom-acceptor HBAs, slope ) 528 ( 41 cm-1, R ) 0.68, SD ) 78 cm-1and one for the nitrogen atom-acceptors, slope ) 828 ( 77 cm-1, R ) 0.89, SD ) 123 cm-1. Similarly, a plot of calculated ∆υ
interfor HBA complexes for p-fluorophenol18(from Table 4) vs. β
2 H
(Figure
S3) gives for the oxygen-atom acceptors, slope ) 438 ( 39, R ) 0.60, SD ) 73 cm-1and for the nitrogen-atom acceptors, slope ) 674 ( 65, R ) 0.89, SD ) 103 cm-1. Calculated HB enthalpies, (-∆HHB)inter, for catechol-HBA complexes (from Table 3) have been plotted against β2H in Figure 6. The points for two HBAs (Et3N (10) and HMPA (15)) deviate significantly from the least-squares line, but there is obviously no discrimination between the oxygen and nitrogen atom HBAs in this plot. This lack of discrimination is further evidence that HB strengths (i.e., calculated HB enthalpies) are solely related to the β2Hvalue of the base.
Because our calculated values of ∆υintra and ∆υinter are in such good agreement with our experimental measurements we can use other calculated quantities with considerable confidence. In particular, and returning to the hypothesis advanced in the Introduction, a plot of the calculated intermolecular HB lengths, R(O-H- - -HBA)inter, from Table 3 against β2
H
yields two distinguishable data sets, one for oxygen atom-acceptor HBAs
(16) It is particularly gratifying in view of a report17that B3LYP/6-31G(d, p)
fails to predict experimental ∆υinter, (-∆HHB)inter and intermolecular
distances for a number of H-bonded complexes, including the water dimer. We note that Korth et al. found that B3LYP/6-31G(d, p) works quite well for intramolecular H-bonds in 2-substituted phenols.10
(17) Del Bene, J. E.; Person, W. R.; Szczepaniak, K. J. Phys. Chem. 1995, 99, 10 705-10 707.
(18) This phenol was chosen for these calculations because there are also extensive experimental data on HBA-induced shifts in the19F NMR signal,12
∆δ. We had hoped that19F ∆δ values would provide another, independent,
method for distinguishing between oxygen and nitrogen bases of equal HBA activity. However, neither the experimental12nor the calculated19∆δ values (Table 4) could make this distinction.
(19) Chemical shifts were computed within the GIAO framework20 at the
B3LYP/6-311G(d)//B3LYP/6-31G(d) level.
(20) (a) Ditchfield, R. Mol. Phys. 1974, 27, 789-807. (b) Wolinski, K.; Hinton, J. F.; Pulay, P. J. Am. Chem. Soc. 1990, 112, 8251-8260.
Table 4. Calculated ∆υInter(cm-1) and ∆δ (ppm) for p-Fluorophenol/HBA Complexes Plus Experimental ∆δ (ppm) from Ref 12
HBAa ∆
υinterb ∆δ(calc)c ∆δ(exptl)
1 86 1.89 2 269 2.38 1.62 3 119 4.34 1.88 4 231 3.00 1.85 5 246 2.73 1.88 6 243 2.98 2.02d 7 292 3.23 2.00 8 373 4.23 2.49 9 307 4.10 2.72 10 588 3.39 2.66 11 254 3.32 12 438 2.92 2.74 13 568 4.71 14 540 3.11 15 327 4.87 3.71
aThe HBAs are numbered as in Table 2.bThe calculated reference O-H
stretching frequency of p-fluorophenol is 3754 cm-1.cThe calculated
shielding tensor for the fluorine atom is 300.63 ppm. The calculated shielding tensor for the fluorine atom in p-fluorophenoxide is 343.47 ppm.
dExperimental ∆δ is for 2-butanone.
Figure 6. Plot of calculated hydrogen bond enthalpies for catechol/HBA
complexes versus β2 H
. Οxygen atom acceptor bases, b; nitrogen atom acceptor bases, 9 and mesitylene, ). The HBA’s are numbered as in Table 2. The straight line has been forced through (0,0).
Figure 7. Plot of intermolecular HB length, R(O-H- - -HBA)inter, for
catechol/HBA complexes versus β2 H
. Οxygen atom acceptor bases, b, solid line and nitrogen atom acceptor bases, 9, dashed line. The HBA’s are numbered as in Table 2.
and one for nitrogen atom-acceptors, see Figure 7. Similarly, the calculated electron density that is transferred from the HBA to the catechol, q, increases as β2H increases (see Table 3). Moreover, for those stronger HBAs (β2Hg 0.50) for which q could be calculated, the values of q/β2Hare larger for the four nitrogen acceptor bases (mean 0.091 e
-) than for the three oxygen atom acceptors (mean 0.076 e-). Such a large difference in the extent of charge transfer for HBs of equal strength indicates that there will be a significantly greater Coulombic contribution to the strength of HBs to nitrogen bases than to oxygen bases (and, consequently, a greater Coulombic-induced shortening of (O-H- - -N)inter HBs than of (O-H- - -O)inter HBs). Thus, DFT calculations support our hypotheses regarding the origin of the differences between equal strength (OH -O)interand (O-H- - -N)interHBs.
It will be obvious that the transfer of negative charge from the HBA to catechol will increase the HB-accepting ability of the oxygen atom of the intermolecularly H-bonded OH group. As a consequence, the O-H bond in (O-H- - -O)intra will become longer, weaker, and have a lower stretching
frequen-cy. That is, ∆υintrawill increase as charge transfer and the HB-accepting ability of the base increase21but at different rates for oxygen and nitrogen atom-acceptor bases.
Supporting Information Available: Calculated and experi-mental ∆υintra values for intramolecularly hydrogen-bonded O-H groups in 1,8-naphthalene diol with HBA solvents, the energies used to compute (-∆HHB)intervalues given in Table 3, IR spectra of 1,8-naphthalene diol in CCl4 and in CCl4 containing acetonitrile, plot of calculated ∆υinter values for catechol vs β2H, plot of calculated ∆υinterfor p-fluorophenol/ HBA complexes Vs β2Hand B3LYP/6-31G(d) optimized struc-tures for H-bonded complexes and their components. This material is available free of charge via the Internet at http://pubs.acs.org.
JA036168C
(21) In the limit, the catechol anion is calculated to have a ∆υintra)565 cm-1
which is more than 1 order of magnitude greater than ∆υintrafor any of the
catechol- - -HBA complexes, see Table 2, footnote c.
H-Bonds between Catechol and O or N Bases A R T I C L E S