*Corresponding author: Sauro Bianchi, Bern University of Applied Science, Architecture Wood and Civil Engineering, Solothurnstrasse 102, 2502 Biel/Bienne, Switzerland, e-mail: [email protected]. http://orcid.org/0000-0002-6979-3622
Gerald Koch: Thünen Institute (TI), Institute of Wood Research, Leuschnerstrasse 91, 21031 Hamburg, Germany
Ron Janzon and Bodo Saake: University of Hamburg, Chemical Wood Technology, Leuschnerstrasse 91b, 21031 Hamburg, Germany Ingo Mayer and Frédéric Pichelin: Bern University of Applied Science, Architecture Wood and Civil Engineering, Solothurnstrasse 102, 2502 Biel/Bienne, Switzerland
Sauro Bianchi*, Gerald Koch, Ron Janzon, Ingo Mayer, Bodo Saake and Frédéric Pichelin
Hot water extraction of Norway spruce (Picea
abies [Karst.]) bark: analyses of the influence
of bark aging and process parameters on the
extract composition
DOI 10.1515/hf-2015-0160
Received July 15, 2015; accepted November 15, 2015; previously published online December 16, 2015
Abstract: The hot water (HW) extraction of Norway spruce
(Picea abies [Karst.]) delivers condensed tannins and
con-siderable amounts of other compounds. Yield and
compo-sition of the HW extracts were investigated as a function of
natural weathering for up to 15 months. Total phenol
mon-omers and oligmon-omers were detected by Folin-Ciocaltau
assay after fractionation by solid phase extraction (SPE).
Procyanidins (PC) were determined by HPLC-UV after acid
thiolysis and carbohydrates by HPLC combined with acid
hydrolysis. Topochemistry of the bark before and after
extraction was investigated by UV-microspectrometry
(UMSP) and non-extractable PC analyzed by direct
thi-olysis on the bark. The influence of the parameters on
the yield and composition of the extracts were evaluated,
such as the extraction temperature, time and the
addi-tion of sodium sulfate and urea. Prolonged weathering
resulted in a considerable decrease of the total
extrac-tion yield, partly because of leaching of phenolic
mono-mers, mono- and oligosaccharides. The yield of phenolic
oligomers also decreased at a moderate rate, while the
yield of polysaccharides (pectins) was almost stable.
Non-extractable and non-leachable compounds deposited in
the cell lumens represent the majority of the phenolic
extractives in spruce bark. Sequential extractions
per-formed at increasing temperature proved to be a suitable
method for the recovery of tannin-rich extracts.
Keywords: bark aging, carbohydrates, condensed tannins,
extraction parameters, face centered cubic statistical
design, hot water extraction, non-extractable tannin,
Norway spruce bark, response surface method, thiolysis,
topochemistry, UMSP
Introduction
Condensed tannins are polyphenolic compounds abundant
in the bark of several European softwoods (SWs) (Haslam
1989; Porter 1989; Matthews et al. 1997), which are
com-posed of different procyanidin (PC) or prodelphinidin (PD)
type building units (Figure 1). Bark tannins are well suitable
for wood adhesive formulations (Yazaki and Collins 1994;
Roffael et al. 2000; Bertaud et al. 2012). The annual volume
of harvested SWs in Central and Northern Europe is about
25 × 10
7m
3(EUROSTAT 2015) and ca. 10% of this volume
is bark, which is currently disposed or burned for energy
recovery. In Germany, ca. 67% of forest is composed of
spruce species and in northern-central Europe’s forests the
situation is similar (DESTATIS 2014). Thus Norway spruce
(Picea abies [Karst.]) bark can be regarded as a largely
avail-able source of condensed tannins in Europe.
The main limitations in the exploitation of SW
bark tannins are the low extraction yields and the high
amounts of co-extracted non-tannin type compounds.
In particular, the presence of carbohydrates is not
desir-able as they lower the concentration of reactive phenolics
and increase the viscosity in tannin resin formulations
(Weissman 1985; Garnier et al. 2001; Pizzi 2008). Stilbene
glucosides and lignans were reported as typical phenolic
extractives from spruce bark and root neck
(Latva-Mäen-pää et al. 2014). The purification of bark tannins from the
co-extracted compounds furthers their exploitation field.
Effective use of purified tannins and other phenolic bark
extracts were identified in applications as radical
scav-engers (Makino et al. 2011), biological antioxidants
(Tely-sheva et al. 2011), antifungal agents (Anttila et al. 2013),
foamed resins (Lacoste et al. 2015) and heavy-metal
chela-tion (Seki et al. 1997). Thermosetting and thermoplastic
resins can be developed through hydroxypropylation of
SW tannins (Garcia et al. 2014).
Isomerization and self-condensation of the tannins
lead to the formation of phlobatannins with low
solubil-ity (Figure 1). In the worst case, phlobaphenes are formed,
i.e. reddish-colored and non-soluble compounds with
not yet clarified molecular structure, which may also
occur naturally in bark. Phlobaphenes of Douglas fir bark
(Pseudotsuga menziesii [Mirb.]) contain highly condensed
polymers consisting of tannins, flavonoids, lignans, and
carbohydrates (Foo and Karchesy 1989).
The extraction temperature influences essentially
the tannin yield (Dix and Marutzky 1983; Jorge et al. 1999;
Vázquez et al. 2001; Kemppainen et al. 2014). The addition
of alkalis and sulfites to the hot water (HW), occasionally in
combination with urea, also increases the extraction yield
through inhibition of the phlobatannin rearrangements
(Liiri et al. 1982; Dix and Marutzky 1983; Weissman 1983;
Sealy-Fisher and Pizzi 1992). Huge variations in the
extrac-tion yields can be observed also within the same species.
For example, the total yield of pure HW extractions from
spruce bark ranged from 3.0 to 15.3 g kg
-1dry bark
(Weiss-man 1981; Bertaud et al. 2012; Kemppainen et al. 2014).
The age, storage conditions, harvesting time etc.
of the bark influence heavily the yield and composition
of the extracts. Matthews et al. (1997) highlighted the
importance of age on the extractability of bark. Relevant
differences in the extract yields from spruce bark collected
at a sawmill and at a pulp mill were also observed, which
are most likely related to different moisture conditions
during log storage (Liiri et al. 1982). The stem heights are
also influential in terms of polyphenols yields (König and
Roffael 2002). The amount of co-extracted carbohydrates
are influenced by the harvesting season (Weissman 1984).
In the present study, bark flakes should be extracted
with HW, which were collected from Norway spruce log
exposed to natural weathering. Topochemistry of the bark
samples will be investigated by cellular UV
microspec-trometry (UMSP) before and after HW extraction. Extract
composition should be characterized with regard to
phe-nolic monomers, condensed tannins, mono-, oligo-, and
polysaccharides. The influence of extraction temperature
and time on the extract quality and on the ratio between
tannins and carbohydrates will be in focus. The
expecta-tion is that the relaexpecta-tionship between the extracexpecta-tion
param-eters and the tannin quality will be better understood and
that an optimal set of extraction parameters will be found
for tannin-rich extracts.
Materials and methods
Material collection: A Norway spruce log was felled end of October 2013 in a forest nearby Biel (Switzerland) at approximately 1000 m above mean sea level and exposed to natural weathering in a log yard. The tree was 120 years old, with a breast-high diameter (BHD)
R R R O O O O O O OH OH OH OH OH
a
b
OH OH OH OH OH OH OH OH OH OH OH OH OH OH HO HO HO HO HO HO HO HO HOFigure 1: Examples of tannins with units of (a) procyanidins (a, with R = H) and prodelphinidins (a, with R = OH) and (b) phlobatannins (Steenkampf et al. 1985).
of 50 cm and a total height of about 35 m. Bark flakes containing both inner and outer bark were collected periodically from 1 to 469 days after tree felling by handheld tools at 1 m and 10 m from the stump. Three other Norway spruce trees were also felled in March 2013 with BHD 40 and 60 cm in the same forest but at lower altitude (600 m). The logs were left on the ground close to the harvesting site and after 1–3 month barks were sampled. All the bark samples were deep- frozen and stored airtight on the day of collection.
Extraction: The bark flakes were milled to fine-powder in a swing-ing mill (Herzog HSM 100H, Osnabrück, Germany). The bark powder was then extracted with hot water (HW) by means of an acceler-ated solvent extraction device (Dionex ASE® 200, Sunnyvale, CA, USA) at specified temperatures, as reported previously by Bianchi et al. (2014). Unless reported otherwise, the extraction time was 10 min and the extraction temperature was 60°C. Some extractions were conducted with the addition of sulfites (Sodium sulfite, Sigma Aldrich, Switzerland) and urea (Sigma Aldrich, Switzerland) to HW as the extraction medium. The extract was finally freeze-dried and stored airtight in dark until analysis.
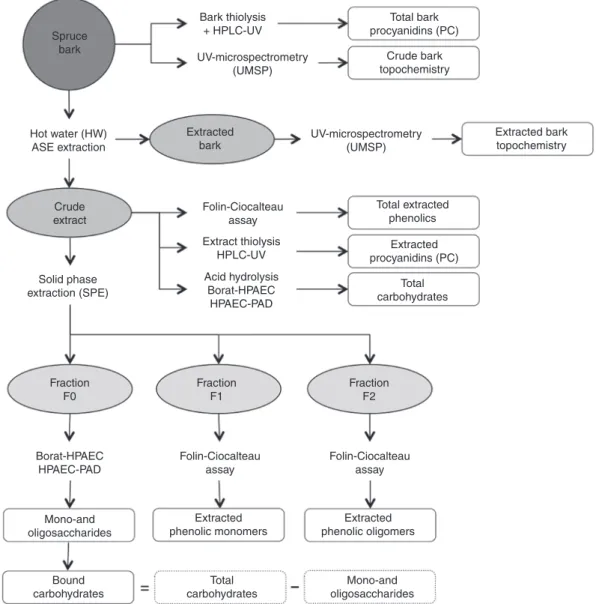
Analysis: The experimental design concerning the characterization of the spruce bark and the HW extracts is illustrated in Figure 2.
Scanning electron microscopy (SEM) samples were prepared from freeze-dried bark chips cutting the surface with a sliding microtome until cracks or damages were no longer visible. The sam-ples were subsequently sputtered under vacuum with gold- palladium (10–15 nm in thickness) and observed by a table-top Hitachi TM3030 (Krefeld, Germany) SEM microscope (15 kV).
UV microspectometry (UMSP) was performed on samples pre-pared and analyzed as described by Koch and Kleist (2001). Briefly, freeze dried bark chips were dehydrated with acetone and subse-quently impregnated with Spurr’s epoxy resin. Semi-thin transverse sections (1 μm) were carefully cut with a calibrated ultra-microtome equipped with a diamond knife and transferred to quartz microscope slides. The thickness of the sample was regularly proofed by light reflection of the sections. UV absorbance scans at 280 nm on rectan-gular fields of the bark sections were recorded with a geometric reso-lution of 0.25 μm × 0.25 μm by means of a Zeiss UMSP 80 instrument and APAMOS® (Carl Zeiss, Oberkochen, Germany) software. Three fields for each bark sample were analyzed. In addition, photometric
Bark thiolysis + HPLC-UV UV-microspectrometry (UMSP) UV-microspectrometry (UMSP) Extracted bark topochemistry Total extracted phenolics Extracted phenolic oligomers Extracted phenolic monomers Mono-and oligosaccharides Mono-and oligosaccharides Total carbohydrates Bound carbohydrates Total carbohydrates Fraction F1 Fraction F0 FractionF2 Extracted procyanidins (PC) Extract thiolysis HPLC-UV Acid hydrolysis Borat-HPAEC HPAEC-PAD Borat-HPAEC HPAEC-PAD Solid phase extraction (SPE) Crude extract Folin-Ciocalteau assay Hot water (HW) ASE extraction Folin-Ciocalteau
assay Folin-Ciocalteauassay Extracted
bark Spruce
bark Crude bark
topochemistry Total bark procyanidins (PC)
point measurements were performed on a spot size of 1 μm2 between 240 and 500 nm (LAMWIN® software, Zeiss, Oberkochen, Germany). For comparative studies, at least 10 spectra were taken from each individual cell tissue or lumen deposit.
An aliquote of the crude freeze-dried extracts was split in three fractions (F0 = carbohydrates and phenolic acids; F1 = phenolic mon-omers; F2 = phenolic oligomers) following the solid phase extraction (SPE) procedure proposed by Sun et al. (1998) with slight modifica-tion. Briefly, the SPE cartridges (Bond-Elute® 10 mg, Agilent, Santa Clara, CA, USA) were preconditioned in sequence with MeOH (Sigma Aldrich, Switzerland) and distilled water. Fifteen millilitre of an aqueous solution of the extract (1 g l-1) was then loaded in the SPE cartridge. Sequential elution with 15 ml of distilled water, 20 ml of ethylacetate (Sigma Aldrich, Switzerland) and 20 ml of MeOH, was then performed in order to gain the fractions F0, F1, and F2, respec-tively. To the F0 fraction, 1 ml of sodium azide solution (60 mg/l, Sigma Aldrich, Switzerland) was added to stop any biological activ-ity, and the volume was brought up to 30 ml. F1 and F2 fractions were vacuum dried at 40°C.
The total amount of phenolic compounds was determined by the Folin-Ciocalteu method (Singelton et al. 1999) on the whole extract (aqueous solutions 0.2 g l-1) and on the fractions F1 and F2 (after dispersion of the vacuum dried samples in 20 ml of water). Three measurements were performed for each sample. Calibration was performed with (-)-epicatechin (Sigma Aldrich, Switzerland).
Tannin extraction yield was estimated by the methylcellulose precipitation method (Sarneckis et al. 2006). Briefly, 2.5 ml of aque-ous extract (0.5 g l-1) was mixed in sequence with 1.5 ml of 0.4% w/w aqueous methylcellulose (Sigma Aldrich, Switzerland) and 1.5 ml of saturated ammonium sulfate solution (Sigma Aldrich, Switzerland), and incubated for 30 min at room temperature. After centrifuging, the absorbance at 280 nm of the supernatant was measured and compared with a control solution. Calibration was performed with (-)-epicatechin.
The amount of PC and PD in the extracts, as well as their mean degree of polymerization (DP) was estimated by high performance liquid chromatography (HPLC) before and after acid thiolysis. The thiolysis was performed with cysteamine HCl (Sigma Aldrich, Switzerland) as described by Jerez et al. (2007), but the reaction time was 60 min. Reversed phase HPLC was done on an Agilent 1100 sys-tem (Santa Clara, CA, USA) with a Cosmosil Protein-R ø4.6 × 250 mm column (Nacalai Tesque, Kyoto, Japan) equipped with a UV diode array set at 280 nm. Elution (1 ml min-1) was made with [A] 0.1% of trifluoracetic acid (TFA, Sigma Aldrich, Switzerland) inv water, and [B] 0.082% of TFA in acetonitrile:water (4:1 v/v), while the following gradient was applied: initial, 0% [B]; 0–5 min, from 0.0% to 7.5% [B]; 5–20 min, from 7.5% to 8.5% [B]; 20–30 min, from 8.5% to 13.5% [B]; 30–45 min, from 13.5% to 33.5% [B]. Identification and quantification of flavan-3-ols were performed by comparison with analytical stand-ards (Sigma Aldrich, Switzerland). No standstand-ards were available for the flavan-3-ol thioethers, thus they were identified by MS with the same HPLC setting as described above, but on a Agilent 1290 Infinity HPLC system equipped to this purpose with a mass detector (Agilent 6130 quadrupole MS, Santa Clara, CA, USA). The quantification of the flavan-3-ol thioethers was performed assuming the same UV molar absorption factor of the corresponding flavan-3-ols. The occurrence of some known phenolic monomers, such as stilbene glucosides or flavonoids, were checked by analysis of the spectrum characteristics and the molecular masses detected by HPLC-MS in correspondence of some UV absorption peaks.
The total amount of PC and PD in bark, which includes both the extractable and the non-extractable molecules, was evaluated by direct thiolysis of the bark, as proposed by Matthews et al. (1997). The fine milled bark (50 mg) was dispersed in the thiolysis media (9.30 ml MeOH, 50 mg cysteamine HCl, 0.20 ml 37% HCl) and kept at 65°C for 60 min in an ultrasound bath. The extract solution was then filtered through a PTFE filter (0.37 μm). A 2.9 ml aliquot of it was thereafter recovered and diluted with water to 20 ml. The solution was then analyzed by HPLC-UV as specified for the extracts.
Total extracted carbohydrates were assessed after acid hydrol-ysis of the extracts. The freeze-dried extracts (50 mg) were sus-pended in 5 ml of water and then 0.9 ml of H2SO4 1 M was added. The samples were hydrolyzed in an autoclave at 120°C for 40 min. After cooling, the samples were brought to 50 ml with water and filtered on a no. 4 sintered glass crucible. The hydrolyzate mono-meric carbohydrates glucose (Glc), xylose (Xyl), mannose (Man), galactose (Gal), arabinose (Ara) and rhamnose (Rha) were analyzed by Borat anion exchange chromatography (Borat-HPAEC) with post- derivatization and detection at 560 nm, as reported by Willför et al. (2009). Mannitol, 5-hydroxymethylfurfural (5-HMF), galacturonic acid (GalA) and glucuronic acid (GlcA) were detected by high perfor-mance anion exchange chromatography with pulsed amperometric detection (HPAEC-PAD), as described by Manns et al. (2014).
The free mono- and oligosaccharides (free carbohydrates) in the non-hydrolyzed water-eluted F0 fraction were quantified by the Borat-HPAEC method. Fructose (Fru), sucrose (Suc), stachyose (Sta) and raffinose (Raf) were also detected in this fraction by the HPAEC-PAD approach on a 4.0 mm Carbopac PA1 – 250 mm column (Thermo scientific, Germany). Isocratic elution (1.0 ml min-1 – 20 min) was performed with 75 mM NaOH. The compounds were detected by an ED50 electrochemical detector equipped with a disposable gold electrode and an Ag/AgCl reference electrode (Thermo scientific, Germany). The difference between total and free carbohydrates is termed “bound carbohydrates”, which can be most likely assigned to polysaccharides and/or glycoside residuals.
Results and discussion
Topochemical analysis
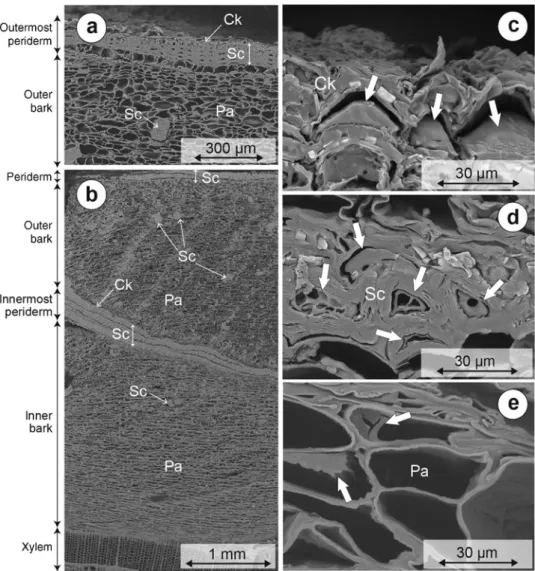
Parenchyma cells, most of them considerably collapsed,
represent the large majority of cells in inner and outer
bark tissues (Figure 3 with SEM images). In the outer
bark, several periderms bands are seen (Figure 3a, b). The
innermost band corresponds to the newer periderms and
it defines the boundary between inner and outer bark.
The more external bands correspond to older periderm,
as described in detail by Howard (1971). Each periderm
band consists of four to five thick walled sclereids and, in
the outer layer, of a few thin walled cork cells (phellem).
Isolated sclereids were also observed among parenchyma
cells, and in particular in the outer bark (Figure 3a, b).
Solid deposits of extractives are present in the large
major-ity of the lumens of sclereids (Figure 3d) and cork cells
(Figure 3c). They occur either as a thin layer attached to
the lumen walls or as a bulky mass that fills the lumens
almost completely. Deposits were also identified in the
lumen of axial parenchyma cells (Figure 3e) but with a
much lower frequency.
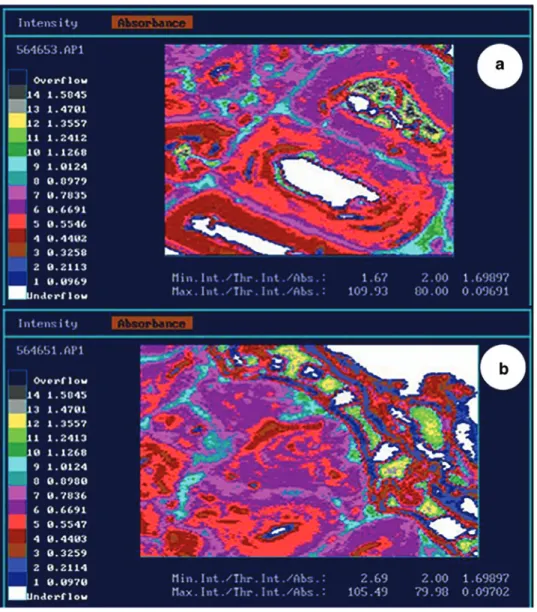
The distribution of the phenolic compounds was
topo-chemically investigated by mapping at λ = 280 nm (A
280nm)
in selected samples (Figure 4). The cell walls (S2 layers) of
the bark show distinct A
280nmbetween 0.32 and 0.78, which
are considerably higher than the values reported by Koch
and Kleist (2001) for spruce xylem cells (A
280nm= 0.10 to 0.41).
Point by point measurements of the S2 layer cell wall of
sclereids and parenchyma cells (Figure 5) show UV
absorb-ance spectra with a pronounced maximum at about 280 nm
and a feeble local minimum close to 260 nm, typical of a
guaiacyl lignin (Musha and Goring 1975). Accordingly, the
S2 layers of bark cell tissues are highly lignified.
The point by point spectra of the cork cell S2 layers
show a slight bathochromic shift of the maximum and
a shoulder at ca. 330 nm (Figure 5). This spectral type is
associated with the occurrence of conjugated double
bonds or carboxylic groups (Goldschmid 1975). It can be
suggested that condensed phenolic compounds,
differ-ent from lignin, incrust the walls of spruce cork cells as
described for beech bark (Prislan et al. 2012). The
possibil-ity that some monomers and smaller phenolic oligomers
could penetrate the cell walls, especially in older and dead
tissues, was discussed by Hillis (1985), though phenolic
deposits are generally localized in the cell lumen of bark
tissues.
Figure 3: SEM pictures of Norway spruce bark (samples collected at 10 m in height 210 days after tree felling). Parenchyma cells (Pa), scle-reids (Sc), cork cells (Ck), lumen deposits (thick white arrow). (a) Outermost periderm. (b) Inner and outer bark with two internal periderm bands. (c) Outermost cork cells with deposits in the lumen. (d) Particular of periderm sclereids with deposits in the lumen. (e) Outer bark parenchyma cells with deposits in the lumen.
The deposits in the cell lumen are clearly silhouetted
against the surrounding bark cell tissues with their
dis-tinctively higher absorbances (Figure 4). Their phenolic
nature is evident. In the most internal sclereids, the
spectra of the deposits (Figure 5) have a pronounced peak
at 285 nm and a shoulder around 320 nm, which again
is indicative to phenolic compounds with conjugated
double bonds. Broad peaks are typical for the spectra of
deposits in the outermost sclereids and cork cells, with
conspicuous UV absorbances up to 400 nm (Figure 5).
The interpretation is that the deposits are mostly
con-densed phenolics with conjugated double bonds, while
the degree of condensation is increasing towards the
most external periderm cell layers. These compounds
could be associated to condensed tannins like PC and PD.
Figure 4: UMSP of Norway spruce bark. The color pixels represent different UV absorption values of the individual cell wall layers and extractives measured at 280 nm with a geometrical resolution of 0.25 μm×0.25 μm. (a) Highly lignified sclereids with phenolic deposits in the cell lumen. (b) Cork cells with distinct deposits of phenolic extractives.Figure 5: Representative UV absorbance spectra of cell wall (S2 layer) and phenolic deposits in Norway spruce bark (sample col-lected at 10 m in height 210 days after tree felling). Each line repre-sents the mean of at least 10 spectra.
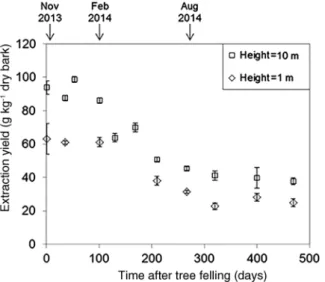
height have lower yields that that in proximity to the first
branches in 10 m height.
The total extracted phenolic compounds, evaluated by
the Folin-Ciocalteau assay, decreased with age in analogy
to the total extraction yields (Table 1), i.e. the portion
of total phenolics in the extracts is constant. The
decre-ment of phenolics and condensed tannins as a function
of natural weathering was already observed (Schofield
et al. 1988; Kelsey and Harmon 1989), and this effect was
mainly ascribed to their leaching. Matthews et al. (1997)
and Maie et al. (2003) proposed a reduction of the
phe-nolic yields through a progressive immobilization of the
tannin molecules via condensation reactions.
Fresh bark samples contained an almost equal amount
of phenolic monomers (F1 fraction) and phenolic
oligom-ers (F2 fraction), while older samples contain mostly
phenolic oligomers (Table 1). A faster depletion of the
phe-nolic monomers than oligomers is obvious. In agreement
with these results, HPLC-UV data of the extracts (data
not reported) show before thiolysis a progressive peak
intensity decrement with extended storage time
associ-ated with the decay of stilbene glucosides astringin and
isorhapontin and the flavanonol taxifolin. In particular,
the stilbene glucosides have a faster decay than taxifolin,
which actually remained the only compound detectable
by HPLC-UV at 469 days.
HPLC-UV after thiolysis on the collected samples
revealed that condensed tannins are represented by PC,
in agreement with previous works (Matthews et al. 1997;
Bianchi et al. 2014). A considerable yield decrement
of extracted PC with extended storage time (Table 1) is
detectable, which occur more rapidly than the phenolic
oligomers fraction (F2). A decrease of the DP of the
extracted PC was also observed for the older samples
The presence of phlobaphene structures should, in fact,
not be excluded.
Extract yield and composition along
storage time
Spruce bark samples exposed to natural weathering were
collected from 1 to 469 days after tree felling. The total
extraction yield shows a noticeable decrease as storage
time increased (Figure 6). The most relevant yield drop
is detectable during the warm season between 100 and
265 days of weathering. The bark samples collected in 1 m
Figure 6: Variation of the total extraction yield from Norway spruce bark with extended storage time (after felling of the tree) at 1 m and 10 m heigths. Each point represents the average of n = 5 extractions; bars indicate standard deviations.
Table 1: Extracted total phenolics and extracted, total, and non-extractable procyanidins from Norway spruce bark samples after different storage days (d) at 1 and 10 m heights.
Parameters
Total phenolics extracted Procyanidins Total gECE kg-1a Monom. (F1) gECE kg-1a Oligom. (F2) gECE kg-1a Extracted Total Residual g kg-1a DP g kg-1a DP g kg-1a
1 m 1 day 22.1±1.1 10.3±0.6 11.3±0.5 8.6±0.9 6.3±0.9 22.8±1.2 7.2±1.1 14.2±1.5 210 days 10.1±0.4 3.3±0.3 6.2±0.3 2.8±0.3 4.7±0.7 17.5±0.9 7.7±1.2 14.6±0.9 469 days 6.5±0.3 1.8±0.2 4.0±0.1 1.3±0.3 4.8±0.7 14.4±0.7 7.7±1.2 13.0±0.8 10 m 1 day 31.5±1.5 15.3±0.9 16.1±0.8 9.9±0.9 5.5±0.8 21.6±1.0 6.3±0.9 11.0±1.0 210 days 13.3±0.7 4.5±0.3 7.8±0.3 2.8±0.3 4.4±0.7 15.2±0.7 6.7±1.0 12.4±0.8 469 days 8.4±0.3 2.7±0.2 5.3±0.3 1.7±0.2 3.8±0.6 14.4±0.8 7.3±1.1 12.7±0.8 Extractions performed in water at 60°C. Mean±StD is presented. aDry bark.
(Table 1). Clearly, phenolic oligomers extracted from
spruce bark are not only composed of linear PC but also
of thiolysis-resistant compounds, the preponderance of
which is more pronounced at older samples. As suggested
by Matthews et al. (1997), such compounds could be most
likely associated to condensed tannins containing
stil-bene glucosides, but also lignans (Zhang and Gellerstedt
2008) or phlobatannins (Steenkampf et al. 1985) should
be considered.
A sizable occurrence of mono and oligosaccharides
(mainly glucose, fructose and sucrose) was observed only
in the fresh (1 day) samples (Table 2). After 210 days, these
compounds were detectable only in traces. This depletion
is most likely related to their leaching, but biological
deg-radation may have also contributed to this observation.
Bound carbohydrates also decreased with extended
storage time, although less severely than mono- and
oli-gosaccharides (Table 2). The main components of bound
Table 2: Composition of the carbohydrates in the bark extracts depending on the height and extraction time (at 60°C; mean and StD).Parameters
Carbohydrates (g kg-1 dry bark)
Glc Gal Fru Xyl Man Ara Rha GalA Suc Raf Sum
1 m 1 day Total 10.8±1.6 1.9±0.3 1.9±0.3 0.6±0.2 0.5±0.1 3.2±0.5 0.4±0.1 1.2±0.2 – – 20.5±3.0 Free 1.2±0.5 0.1±0.1 1.7±0.6 < 0.1 < 0.1 0.1±0.1 < 0.1 < 0.1 2.1±0.4 0.1±0.1 5.4±1.3 Bounda 8.4±1.6 1.8±0.3 < 0.1 0.6±0.2 0.5±0.1 3.1±0.5 0.4±0.1 1.2±0.2 – – 16.1±3.2 1 m 210 days Total 4.6±0.4 1.2±0.1 0.1±0.1 0.3±0.1 0.4±0.1 2.3±0.2 0.4±0.1 0.9±0.1 – – 10.3±0.8 Free 0.5±0.1 < 0.1 < 0.1 < 0.1 < 0.1 0.1±0.1 < 0.1 0.1±0.1 < 0.1 < 0.1 0.7±0.2 Bounda 4.1±0.4 1.2±0.1 < 0.1 0.3±0.1 0.4±0.1 2.2±0.2 0.4±0.1 0.8±0.1 – – 9.6±0.9 10 m 1 day Total 17.0±0.8 2.8±0.2 2.1±0.2 0.7±0.2 0.7±0.2 4.9±0.3 0.7±0.2 1.8±0.2 – – 30.8±1.5 Free 1.6±0.4 0.1±0.1 1.9±0.5 < 0.1 < 0.1 < 0.1 < 0.1 0.1±0.1 2.8±0.8 0.1±0.1 6.9±2.6 Bounda 13.8±0.9 2.7±±0.2 < 0.1 0.7±0.2 0.7±0.2 4.8±0.3 0.7±0.2 1.7±0.2 – – 25.1±2.8 10 m 210 days Total 6.5±0.2 1.9±0.1 0.1±0.1 0.6±0.1 0.9±0.1 3.1±0.1 0.6±0.1 1.3±0.2 – – 15.1±1.0 Free 0.5±0.1 < 0.1 0.1±0.1 < 0.1 < 0.1 0.1±0.1 < 0.1 < 0.1 0.1±0.1 < 0.1 0.7±0.2 Bounda 6.0±0.2 1.9±0.1 < 0.1 0.6±0.1 0.9±0.1 3.1±0.1 0.6±0.1 1.3±0.2 – – 14.4±1.0 30°C Total 3.8±0.3 1.4±0.1 0.5±0.1 0.4±0.1 0.3±0.1 1.6±0.2 0.3±0.1 – – 8.3±0.7 Free 0.6±0.1 < 0.1 0.6±0.1 < 0.1 < 0.1 0.2±0.1 < 0.1 0.5±0.1 < 0.1 2.6±0.2 Bounda 2.9±0.3 1.4±0.1 < 0.1 0.4±0.1 0.3±0.1 1.4±0.1 0.3±0.1 – – 6.7±0.6 45°C Total 0.9±0.2 0.4±0.1 < 0.1 0.1±0.1 0.1±0.1 0.4±0.1 0.1±0.1 – – 2.0±0.4 Free < 0.1 < 0.1 < 0.1 < 0.1 < 0.1 < 0.1 < 0.1 < 0.1 < 0.1 0.1±0.1 Bounda 0.8±0.2 0.4±0.1 < 0.1 0.1±0.1 0.1±0.1 0.5±0.1 0.1±0.1 – – 2.0±0.4 105°C Total 1.0±0.1 0.7±0.1 < 0.1 0.2±0.1 0.3±0.1 1.4±0.2 0.1±0.1 – – 3.7±0.5 Free < 0.1 < 0.1 < 0.1 < 0.1 < 0.1 0.2±0.1 < 0.1 < 0.1 < 0.1 0.3±0.1 Bounda 1.0±0.1 0.7±0.1 < 0.1 0.2±0.1 0.3±0.1 1.2±0.2 0.1±0.1 – – 3.4±0.4 150°C Total 2.7±0.4 4.9±0.7 < 0.1 2.6±0.3 2.1±0.3 9.4±1.2 0.7±0.1 – – 22.2±2.9 Free 0.1±0.1 0.3±0.1 < 0.1 0.1±0.1 < 0.1 2.4±0.3 0.2±0.1 < 0.1 < 0.1 3.2±0.4 Bounda 2.5±0.3 4.6±0.6 < 0.1 2.4±0.3 2.1±0.3 7.0±0.9 < 0.1 – – 19.1±2.5 The lower part of the table reports on data as a function of the extraction temperature. aBound carbohydrates: difference between total and free carbohydrates. In the case of Glc, Gal, and Fru, the subtracted amount includes both the free monosaccharides and their monosaccha-ride units in the free oligosacchamonosaccha-rides.
variations were detected. A point UV measurement
evi-denced just a minor decrease of the UV absorbance from
unextracted samples (Figure 7). The cell closer to the
extraction surface (cork cells and outermost sclereids)
showed the most relevant changes. Shen et al. (1986)
made similar observations for Larix gmelinii [Rupr.] bark
and found that the extraction efficacy sharply declined
carbohydrate are after hydrolysis glucose, galactose,
arabinose, and galacturonic acid. They could therefore
be mostly associated to typical SW pectin-like
polysac-charides like arabinans, arabinogalactans and glucans
(Timell 1961; Kemppainen et al. 2014). Samples collected
at 10 m height contain bound carbohydrates in
consider-ably higher concentrations than samples collected at the
1 m height. The quicker drop in glucose yield compared
to the other carbohydrate residuals is likely related to its
association not only to polysaccharides but also to
stil-bene glucosides, which were rapidly decreased during
aging.
Bark tissue variations along storage time
and after extraction
The variation in the bark tissue during weathering was
followed by UMSP and direct thiolysis. While the former
focuses on the absorbance at 280 nm (associated to the
total phenolics), the latter allows for estimating the total
amount of PC as the sum of extractables and
non-extract-ables (Matthews et al. 1997).
There are only small UV differences between 1 day old
and 210 days old samples. A
280nmat 1 m height decreased
from 0.65 to 0.61, while at 10 m the corresponding data
varied from 0.61 to 0.56. Point spectra did not reveal either
remarkable data variations with this regard (not shown).
Direct thiolysis revealed more total PC with higher mDPs
left in bark than those from extracted tannins (Table 1).
The amounts of total PC decreased as function of storage
time, which was also the case for extracted PC. The
dif-ference between total and extracted PC remained almost
constant during aging (Table 1). At 469 days, the amount
of total PC were nearly composed of non-extractable
com-pounds, thus the weathering degrades or removes mainly
the extractable materials. Benner et al. (1990) reported
on similar results. The formation of additional secondary
bonds between the molecules (condensation) as reported
by Matthews et al. (1997) and Maie et al. (2003) seems of
minor relevance. To collect more data with this regard, a
bark sample collected after 1 day and at 10 m in height,
was kept dry, at room temperature and protected from
light for 15 months, and thereafter extracted. The
extrac-tion yield was to 85 g kg
-1dry bark and the total phenolic
yield was 19.5 gECE kg
-1, i.e. these data are similar to
those of fresh samples (Figure 6 and Table 1). Expectedly,
without weathering and leaching there are no marked
changes observable.
In this line are also the UMSP analyses of bark chips
before and after extraction at 90°C, where no significant
Figure 7: UV absorbance spectra of phenolic deposits before and after extraction in water at 90°C. Measurement performed in bark cells at different depths from the external surface. Each line repre-sents the average absorbance of at least 10 individual point spectra.
moving back from the bark surface towards the inner
cells.
Analysis of the extraction process
parameters
The effects of extraction temperature (30–90°C),
extrac-tion time (2–60 min), addiextrac-tion of sulfites (0–5 g l
-1, as
sulfite ions), and addition of urea (0–5 g l
-1) were studied
by means of a face centered cubic statistical design fitted
with a full quadratic model (Myers et al. 2009). A total of
24 extractions plus five repetitions of the design central
point were performed. Precipitable tannins and total
car-bohydrate yields were chosen as responses. The choice of
the precipitable tannin method was necessary because
the Folin-Ciocalteau assay fails in presence of sulfites
(Singelton et al. 1999).
Temperature, time and their interaction resulted in
very significant factors (P < 0.001) for both precipitable
tannins and total carbohydrates. The addition of sulfites
was only marginally significant in the interactions with
temperature (P = 0.016) and time (P = 0.019). The benefits
of sulfite were actually offset by the relevant increase
of ashes in the extracts, as already pointed out by Jorge
et al. (1999). Addition of urea did not show any significant
effect, contrary to what has been reported for other SW
barks (Sealy-Fisher and Pizzi 1992).
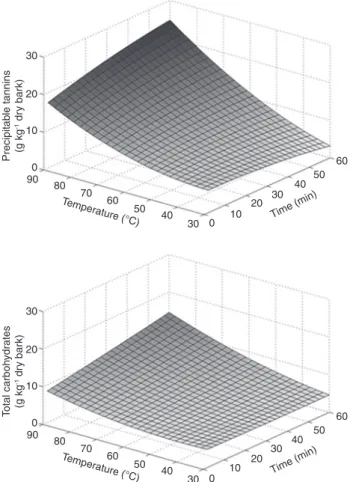
The fitting surfaces of precipitable tannins and total
carbohydrates as a function of time and temperature
are presented in Figure 8. As seen, tannins extraction is
highly dependent on temperature, in agreement with the
results of previous studies (Derkyi et al. 2011; Kemppainen
et al. 2014). Total carbohydrates are already removed in
a considerable amount at 30°C and their yields increased
only slightly with temperature. The extraction
tempera-ture seems to be a suitable parameter for the separation of
phenolics and carbohydrates in the bark extracts.
Sequential extractions at increasing
temperature
Norway spruce bark was successively extracted in steps of
15°C, from 30 to 150°C. The total yield at the first
extrac-tion step at 30°C was substantially higher than the
fol-lowing steps up to 105°C (Figure 9). Over 105°C, the total
yield again remarkably increased. The amount of total
phenolics as detected by Folin-Ciocalteau assay remained
almost constant along the extraction steps (Figure 9). In
the range between 30 and 105°C, the portion of phenolics
90 80 70 60 50 40 30 0 10 20 Time (min) 30 40 50 60 Temperature (°C) 0 10 20 Precipitab le tannins (g kg -1 dr y bar k) 30 90 80 70 60 50 40 30 0 10 20 Time (min) 30 40 50 60 Temperature (°C) 0 10 20 Total carboh ydrates (g kg -1 dr y bar k) 30
Figure 8: Yield fitting surfaces for precipitable tannins and total carbohydrates as a function of the extraction time and temperature (without addition of sulfites and urea).
Figure 9: Total extraction and total phenolic yields in sequential extractions of Norway spruce bark at increasing temperatures. Phe-nolics are expressed as grams of (-)-epicatechin equivalents (gECE) after Folin-Ciocalteau assay.
in the extracts was more relevant, while out of these
boundaries a more relevant extraction of carbohydrates
occurred. The analysis of the hydrolyzed extracts (Table 2)
shows that the total carbohydrate yield at 30 and 150°C
is significantly higher than in the steps at 45 and 105°C.
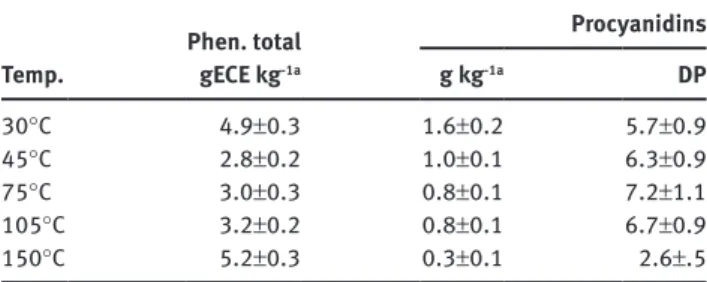
visible in Table 3, indicating that higher temperatures are
needed to extract PC with larger molecular mass. Over
105°C, the PC yield and their DP quickly dropped, while
the amount of total phenolics considerably increased. At
temperatures higher than 105°C, most of the phenolics in
the extracts might be composed of oligomers not
accessi-ble to acid-thiolysis. These compounds are either native
highly condensed polyphenolics or thermally modified
condensed tannins as reported by Sealy-Fisher and Pizzi
(1992).
Conclusions
The composition of the HW extracts from Norway spruce
bark varies considerably during prolonged bark
expo-sure to natural weathering. These changes were mainly
linked to the natural leaching of the most extractable
compounds like mono- and oligosaccharides, phenolic
monomers, and some condensed tannins. The physical
and chemical characteristics of the extracts vary as well.
A preliminary cold water extraction is able to remove the
compounds more responsible for variations observed
during bark aging. After HW treatments, the
concen-tration of tannins in the extracts could be higher, but
they occur always in combination with polysaccharides
(mostly pectins). Extraction temperatures over 100°C are
not recommended, due to the relevant amount of
poly-saccharides (from degradation of hemicelluloses) and
highly condensed phenolic oligomers in the product. A
shortcoming of the preliminary cold water extraction step
is the loss of a considerable portion of tannins, which has
to be carefully considered in the economic feasibility
analysis of the process. Topochemical analysis of the bark
tissues showed the considerable presence of
non-extract-able and non-leachnon-extract-able phenolic compounds,
highlight-ing the potential of the extracted bark as a substrate rich
in phenolic compounds, which are worth to be further
valorized.
Acknowledgments: The authors would like to thank the
Swiss National Research Program “Resource Wood”
(NRP66) for their financial support; the Burgergemeinde
Biel for providing the raw bark; Christina Hinterleitner
from the Bern University of Applied Science for her great
support in the development and implementation of the
analytical work; Nicole Erasmy from the University of
Hamburg, for her assistance in the carbohydrate analysis;
Daniela Paul from Thünen Institute for her help in UMSP
measurements.
The upsurge of carbohydrate yields over 100°C has been
already reported by Kemppainen et al. (2014) and Makino
et al. (2009).
The composition of the extracted carbohydrates in
the course of the extraction steps (Table 2) shows that the
free mono- and oligosaccharides (mostly glucose,
fruc-tose and sucrose) were almost completely extracted at
30°C. These components were detected only in traces in
the following steps. The prevalence of glucose, galactose
and arabinose monomeric residuals within the bound
carbohydrates of all samples (Table 2) are indicative for
the extraction of typical SW pectin-like polysaccharides
like arabinans, arabinogalactans and glucans (Timell
1961) in all steps. At 150°C, a more conspicuous amount
of xylose and mannose residuals can be interpreted as the
additional extraction of typical SW bark hemicelluloses
such as galactoglucomannans and
arabinomethylglucu-ronoxylans (Timell 1961; Dietrich et al. 1978; Le Normand
et al. 2012). At 150°C, the substantial amount of free
arab-inose is likely related to the degradation of some
polysac-charides during extraction.
The phenolic fraction also varied in composition
within the extraction steps. Stilbene glucosides and
taxi-folin were observed in HPLC-UV chromatograms of the
extracts (not shown) from 30 to 75°C, with decreasing
absorbance areas. The relatively higher concentration of
bound glucose in the extracts at 30 and 45°C (Table 2)
can be thus explained by the presence of stilbene
glu-cosides. It is clear that phenolic monomers and mono-
and oligosaccharides can be almost completely removed
with cold or warm water, while in the following steps at
higher temperature mostly tannin and polysaccharides
(mostly pectins) are extracted. PCs were identified after
thiolysis in all extraction steps. Their yield decreased
almost constantly as a function of extraction
tempera-ture (Table 3), in discordance to what was observed for
the total phenolics, i.e. in the extracts are more polymers
not related to PC. A slight increase of the DP up to 75°C is
Table 3: Total phenolics and procyanidins extracted from Norway spruce bark in sequential extraction at increasing temperatures.Temp. Phen. total gECE kg-1a
Procyanidins g kg-1a DP 30°C 4.9±0.3 1.6±0.2 5.7±0.9 45°C 2.8±0.2 1.0±0.1 6.3±0.9 75°C 3.0±0.3 0.8±0.1 7.2±1.1 105°C 3.2±0.2 0.8±0.1 6.7±0.9 150°C 5.2±0.3 0.3±0.1 2.6±.5 aDry bark.
References
Anttila, A.-K., Pirttilä, A.M., Häggman, H., Harju, A., Venäläinen, M., Haapala, A., Holmbom, B., Julkunen-Tiitto, R. (2013) Con-densed conifers tannins as antifungal agents in liquid culture. Holzforschung 67:825–832.
Benner, H., Hatcher, P.G., Hedges, J.I. (1990) Early diagenesis of mangrove leaves in a tropical estuary. Bulk chemical charac-terization using solidstate 13C NMR and elemental analysis. Geochim. Cosmochim. AC 54:2003–2013.
Bertaud, F., Tapin-Lingua, S., Pizzi, A., Navarrete, P., Petit-Conil, M. (2012) Development of green adhesives for fiberboard manu-facturing using tannins and lignin from pulp mill residues. Cell. Chem. Techn. 46:449–455.
Bianchi, S., Gloss, A., Kroslokova, I., Mayer, I., Pichelin, F. (2014) Analysis of the structure of condensed tannins in water extracts from bark tissues of Norway spruce (Picea abies [Karst.]) and silver fir (Abies alba [Mill.]) using MALDI-TOF mass spectrometry. Ind. Crop Prod. 61:430–437.
Derkyi, N.S.A., Adu-Amankwa, B., Sekyere, D., Darkwa, N.A. (2011) Optimum acetone and ethanol extraction of polyphenols from
Pinus caribea bark: maximizing tannin content using response
surface methodology. Chem. Prod. Process Modelling 6(1), Article 9.
DESTATIS (2014) Land- und Forstwirtschaft, Fisherei.
Forstwirtschaftliche Bodennutzung – Holzeinschlagsstatistik – Fachserie 3 Reihe 3.3.1. Statistisches Bundesamt, Wiesbaden, p. 8.
Dietrich, H.H., Garves, K., Behrensdorf, D., Sinner, M. (1978) Unter-suchung über die Kohlenhydrate der Rinden einheimischer Holzarten. Holzforschung 32:60–67.
Dix, B., Marutzky, R. (1983) Untersuchungen zur Gewinnung von Polyphenolen aus Nadelholzrinden. Holz Roh Werkst. 41:45–50.
EUROSTAT. Agriculture Forestry and Fishery Statistics. 2014 Edition. European Union, 2015, pp. 141–165.
Foo, L.Y., Karchesy, J.J. (1989) Chemical nature of phlobaphenes. In: Chemistry and Significance of Condensed Tannins. Eds. Hemigway, R.W., Karchesy, J.J. Plenum Press, New York. pp. 109–118.
Garcia, D.E., Glasser, W.G., Pizzi, T.A., Osorio-Madrazo, A., Laborie, M.-P.G. (2014) Synthesis and physicochemical proper-ties of hydroxypropryl tannins from maritime pine bark (Pinus
pinaster Ait.). Holzforschung 68:411–418.
Garnier, S., Pizzi, A., Vorster, O.C., Halasz, L. (2001) Comparative rheological characteristics of industrial polyflavonoid tannin extracts. J. Appl. Polym. 81:1634–1642.
Goldschmid, O. (1975) Ultraviolet spectra. In: Lignins, Occurrence, Formation, Structure and Reactions. Eds. Sarkanen, K.V., Ludwig, C.H. Wiley Interscience, New York. pp. 241–266. Haslam, E. (1989) Polyphenols – vegetable tannins. In: Plant
Polyphenols: Vegetable Tannins Revisited. University Press, Cambridge, UK. pp. 1–13.
Hillis, W.E. (1985) Occurrence of extractives in wood tissues. In: Biosynthesis and Biodegradation of Wood Components. Ed. Higuchi, T. Academy Press, New York. pp. 209–288.
Howard, E.T. (1971) Bark structure of the southern pines. Wood Sci. 3:134–148.
Jerez, M., Selga, A., Sineiro, J., Torres, J.L., Núñez, M.J. (2007) A comparison between bark extracts from Pinus pinaster and
Pinus radiata: antioxidant activity and procyanidin
composi-tion. Food Chem. 100:439–444.
Jorge, F.C., Brito, P., Pepino, L., Portugal, A., Gil, M.H., Irle, M.A., da Costa, R.P. (1999) Improved extraction of pine bark for wood adhesives. Proceedings of the 3rd European Panel Product Symposium, Llandudno, Wales. pp. 301–307.
Kelsey, R.G., Harmon, M.E. (1989) Distribution and variation of extractable total phenols and tannins in the logs of four conifers after 1 year on the ground. Can. J. Forest Res. 19:1030–1036. Kemppainen, K., Siika-aho, M., Pattathil, S., Giovando, S., Kruus, K.
(2014) Spruce bark as an industrial source of condensed tan-nins and non-cellulosic sugars. Ind. Crop Prod. 52:158–168. Koch, G., Kleist, G. (2001) Application of Scanning UV
microspec-trometry to localise lignin and phenolic extractives in plant cell walls. Holzforschung 55:563–567.
König, B., Roffael, E. (2002) Zur reaktivität von Tanninen in Abhäng-igkeit vom Kambialalter. Holz Roh Werkst. 60:258.
Lacoste, C., Čop, M., Kempainnen, K., Giovando, S., Pizzi, A., Laboire, M.P., Sernek, M., Celzard, A. (2015) Biobased foams from condensed tannin extracts from Norway spruce (Picea
abies) bark. Ind. Crop. Prod. 73:144–153.
Latva-Mäenpää, H., Laakso, T., Sarjala, T., Wähälä, K., Saranpää, P. (2014) Root neck of Norway spruce as source of bioactive lignans and stilbenes. Holzforschung 68:1–7.
Le Normand, M., Edlund, U., Holmbom, B., Ek, M. (2012) Hot-water extraction and characterization of spruce bark non-cellulosic polysaccharides. Nord. Pulp Paper Res. 27:18–23.
Liiri, O., Sairanen, H., Kilpeläinen, H., Kivistö, A. (1982) Bark extrac-tives from spruce as constituents of plywood bonding agents. Holz Roh Werkst. 40:51–60.
Maie, N., Behrens, A., Knicker, H., Knaber-Kögel, I. (2003) Changes in the structure and protein binding ability of condensed tan-nins during decomposition of fresh needles and leaves. Soil Biol. Biochem. 35:577–589.
Makino, R., Ohara, S., Hashida, K. (2009) Efficient extraction of polyphenolics from the bark of tropical tree species. J. Trop. For. Sci. 21:45–49.
Makino, R., Ohara, S., Hashida, K. (2011) Radical scavenging characteristics of condensed tannins from bark of various tree species compared with quebracho wood tannin. Holzforschung 65:651–657.
Manns, D., Deutschle, A.L., Saake, B., Meyer, A.S. (2014) Methodol-ogy for quantitative determination of the carbohydrate com-position of brown seaweeds (Laminariacee). RSC Advanced, 4:25736–25746.
Matthews, S.; Mila, I.; Scalbert, A.; Donnelly, D.M.X. (1997) Extract-able and non-extractExtract-able proanthocyanidins in barks. Phyto-chemistry 45:405–410.
Musha, Y., Goring, D.A.I. (1975) Distribution of syringyl and guaiacyl moieties in hardwoods as indicated by ultraviolet microscopy. Wood Sci. Technol. 9:45–58.
Myers, R.H., Montgomery, D.C., Anderson-Cook, C.M. Response surface methodology: Process and Product Optimization Using Designed Experiments. 3rd Edition. John Wiley & Sons, Hoboken, NJ, 2009.
Pizzi, A. (2008) Tannins: major sources, properties and applica-tions. In: Monomers, Polymers and Composites from
Renewa-ble Sources. Eds. Belgacem, M.N., Gandini, A. Elsevier, Oxford. pp. 179–199.
Porter, L.J. (1989) Condensed tannins. In: Natural Products of Woody Plants. Ed. Rowe, J.W. Springler-Verlag, Berlin, Germany. vol. 1. pp. 651–690.
Prislan, P., Koch, G., Schmitt, U., Gričar, J., Čufar, K. (2012) Cel-lular and topochemical characteristics of secondary changes in bark tissues of beech (Fagus sylvatica). Holzforschung 66:131–138.
Roffael, E., Dix, B., Okum, J. (2000) Use of spruce tannin as binder in particleboards and medium density fiberboards (MDF). Holz Roh Werkst. 58:301–305.
Sarneckis, C.J., Dambergs, R.G., Jones, P., Mercurio, M.,
Herderich, M.J., Smith, P.A. (2006) Quantification of condensed tannins by precipitation with methyl cellulose: development and validation of an optimised tool for grape and wine analy-sis. Aust. J. Grape Wine R. 12:39–49.
Schofield, J.A., Hagerman, A.E., Harold, A. (1988) Loss of tannins and other phenolics from willow leaf litter. J. Chem. Ecol. 24:1409–1421.
Sealy-Fisher, V.J., Pizzi, A. (1992) Increased pine tannins extraction and wood adhesives development by phlobaphenes minimiza-tion. Holz Roh Werkst. 50:212–220.
Seki, K., Saito, N., Aoyama, M. (1997) Removal of heavy metal ions from solutions by coniferous barks. Wood Sci. Technol. 31:441–447.
Shen, Z., Haslam, E., Falshaw, C.P., Begley, M.J. (1986) Procyani-dins and polyphenols of Larix gmelini bark. Phytochemistry 25:2696–2635.
Singelton, V.L., Orthofer, R., Lamuela-Raventos, R.M. (1999) Analysis of total phenols and other oxid ation substrates and antioxidants by means of folin-ciocalteau reagent. Method Enzymol. 299:152–178.
Steenkampf, J.A., Steynberg, J.P., Brandt, E.V., Ferreira, D. Roux, D.G. (1985) Phlobatannins, a novel class of ring- isomerized con-densed tannins. J. Chem. Soc., Chem. Comm. 1678.
Sun, B., Leandro, C., da Silva, J.M.R., Spranger, I. (1998) Separation of grape and wine proanthocyanidins according to their degree of polymerization. J. Agr. Food Chem. 46:1390–1396.
Telysheva, G., Dizhbite, T., Bikovens, O., Ponomarenko, J., Janceva, S., Krasilnikova, J. (2011) Structure and antioxidant activity of diarylheptanoids extracted from bark of grey alder (Alnus incana) and potential of biorefinery-based bark process-ing of European trees. Holzforschung 65:623–629.
Timell, T.E. (1961) Isolation of polysaccharides from the bark of gymnosperms. Sven. Papperstidn. 64:651–661.
Vázquez, G., González-Alvarez, J., Freire, S., López-Suevos, F., Antorrena, G. (2001) Characteristics of Pinus pinaster bark extracts obtained under various extraction conditions. Holz Roh Werkst. 59:451–456.
Weissman, G. (1981) Untersuchung der Rinderextrakte von Picea
abies Karst. Holz Roh Werkst. 39:457–461.
Weissman, G. (1983) Studies on pine bark extracts. Int. J. Adhes. Adhes. 3:31–35.
Weissman, G. (1984) Zusammensetzung der wässrigen Rindenex-trakte von Picea abies [Karst.] im Verlauf einer Vegetationperi-ode. Holzforschung 38:7–10.
Weissman, G. (1985) Untersuchung der Rinderextrakte von Lärchen. Holzforsch. Holzwert. 37:67–71.
Willför, S., Pranovich, A., Tamminen, T., Puls, J., Laine, C., Suurnäkki, A., Saake, B., Uotila, K., Simolin, H., Hemming, J., Holmbom, B. (2009) Carbohydrate analysis of plant materials with uronic acid-containing polysaccharides – A comparison between different hydrolysis and subsequent chromatographic analytical techniques. Ind. Crop Prod. 29:571–581.
Yazaki, Y., Collins, P.J. (1994) Wood adhesives based on tannin extracts from barks of some pine and spruce species. Holz Roh Werkst. 52:307–310.
Zhang, L., Gellerstedt, G. (2008) 2D heteronuclear (1H-13C) single quantum correlation (HSQC) NMR analysis of norway spruce bark components. In: Characterization of Lignocellulosic Materials. Ed. Hu, T.Q. Blackwell Publishing Ltd., Oxford, UK. pp. 3–12.