HAL Id: cea-02438370
https://hal-cea.archives-ouvertes.fr/cea-02438370
Submitted on 20 Feb 2020HAL is a multi-disciplinary open access archive for the deposit and dissemination of sci-entific research documents, whether they are pub-lished or not. The documents may come from teaching and research institutions in France or abroad, or from public or private research centers.
L’archive ouverte pluridisciplinaire HAL, est destinée au dépôt et à la diffusion de documents scientifiques de niveau recherche, publiés ou non, émanant des établissements d’enseignement et de recherche français ou étrangers, des laboratoires publics ou privés.
The Effects of Uncertainty of Input Parameters on
Nuclear Fuel Cycle Scenario Studies
M. Tiphine, B. Vezzoni, F. Alvarez-Velarde, B. Carlier, D. Wojtaszek, G.
Glinatsis, A. Brolly, B. Dixon, R. Eschbach, C. Coquelet-Pascal, et al.
To cite this version:
M. Tiphine, B. Vezzoni, F. Alvarez-Velarde, B. Carlier, D. Wojtaszek, et al.. The Effects of Uncertainty of Input Parameters on Nuclear Fuel Cycle Scenario Studies. 14th Information Exchange Meeting on Actinide and Fission Product Partitioning and Transmutation (IEMPT - 2016), Oct 2016, San Diego, United States. �cea-02438370�
The Effects of the Uncertainty of Input Parameters on Nuclear Fuel Cycle Scenario
Studies
M. Tiphine*1, B. Vezzoni2, F. Alvarez-Velarde3, B. Carlier4, D. Wojtaszek5, G. Glinatsis6, A. Brolly7, B.
Dixon8, R. Eschbach1, C. Coquelet-Pascal1, D. Freynet1, G. Edwards5, B. Hyland5, S. Häkkinen9, T.
Viitanen9, F. Gabrielli2, K. Ono10 and S. Cornet11
1CEA/DEN/DER/SPRC/LECy, France; 2KIT, Germany; 3CIEMAT, Spain; 4AREVA, France; 5CNL, Canada; 6ENEA, Italy; 7Hungarian Academy of Sciences, Hungary; 8INL, USA; 9VTT, Finland; 10JAEA, Japan;
11OECD/NEA
Abstract
Nuclear systems, composed of reactors and fuel cycle facilities, are complex and in constant evolution. Fuel cycle scenario studies aim at evaluating the consequences of decisions taken in the near term on the eventual outcomes of a chosen fuel cycle.
Scenario studies require a large amount of data and hypotheses, such as the energy demand and its evolution or the performances and characteristics of existing and future technologies. Each hypothesis, represented by a parameter, is a potential source of uncertainty that can impact the scenario outcomes. The Nuclear Energy Agency’s Expert Group on Advanced Fuel Cycle Scenarios (NEA/AFCS) recently completed an activity that used sensitivity studies to evaluate the impact of uncertainty of the primary scenario input parameters on scenario results.
At the beginning of the study, a base case scenario was specified and evaluated. It considers a PWR UOX reactor fleet using low enriched uranium oxide fuel and its gradual replacement by a sodium fast reactor (SFR) fleet using uranium/plutonium mixed oxide fuel. Each member of the group evaluated this scenario with its own scenario code (COSI, COSAC, FAMILY, SITON, TR_EVOL or VISION). It is noteworthy that the different codes show a good consistency in the results and that the differences have been investigated and documented in order to ensure a strong basis for comparison in the sensitivity study.
Then, 17 key input parameters and their range of variation as well as 22 scenario outputs were identified and sensitivity analyses were conducted. The key parameters were chosen amongst the general assumptions on the scenario (energy demand, introduction date of fast reactor…), reactors and facilities characteristics (burn-ups, losses at reprocessing…) and some minor actinides recycling parameters. As far as possible, each parameter was varied independently from the others. This sensitivity study shows the relative impact of each parameter on each output metric.
In order to compare the large amount of results, two methods of summarization were adopted, as described in the paper. These comparisons have shown that some parameters, such as the energetic production or the introduction date of fast reactors, have a strong impact on the results whereas others, like the UOX fabrication time, have almost no impact on the studied scenario.
Introduction
Under the auspices of the NEA Nuclear Science Committee (NSC), the Working Party on the Scientific Issues of the Fuel Cycle (WPFC) has been established to coordinate scientific activities regarding various existing and advanced nuclear fuel cycles, including advanced reactor systems, associated chemistry and flowsheets, development and performance of fuels and materials, accelerators and spallation targets. Various Expert Groups were established to cover the abovementioned topics. The Expert Group on Advanced Fuel Cycle Scenarios (EGAFCS) was created in 2010, replacing the Expert Group on Fuel Cycle Transition Scenarios Studies, to study R&D needs associated with the transition from current or future advanced nuclear fuel cycles. The objectives of the expert Group are to assemble, organise and understand the scientific issues of advanced fuel cycles, and to provide a framework for assessing specific national needs related to the implementation of advanced fuel cycles.
After conducting a benchmark study to compare existing codes in terms of capabilities, modelling and results [1], the expert group performed a benchmark study to identify and communicate the impact of uncertainties in fuel cycle analyses using systems codes [2]. The purpose of this study was to assess and quantify the importance of input parameters in scenario analysis. The benchmark was conducted in different phases: definition of a base case scenario, system codes normalisation, parameters identification, parametric studies, and uncertainties representation.
Description of the study
Fuel cycle scenario analysis is a common method for identifying and communicating potential nuclear energy futures, especially when assessing the impact of new technologies. System codes are used to assess the behaviour of different nuclear energy systems and to examine scenarios involving transition of infrastructure (reactors, fuel cycle facilities, etc.) to accommodate growth and adopt new fuel cycle management approaches (e.g. recycling).
By their nature, scenario analyses involve assumptions about the future, and the systems codes used in scenario analyses are imperfect representations of the real world. Uncertainties inherent in scenario specifications and system codes impact the accuracy of analyses. There are several sources of uncertainty in fuel cycle analyses using system codes, including scenario assumptions, facility operational values, reactor core physics calculations, etc. and their impacts vary based on the fuel cycle and the performance metrics of interest. The purpose of this study is to systematically identify these sources of uncertainty and use sensitivity studies to assess their impacts on system level results.
Scenario codes
The study involved the use of multiple system codes, some of them used by more than one organisation. The different codes used to obtain those results are the following:
- COSI, used by CEA, ENEA and KIT [3]; - COSAC, used by AREVA [4];
- SITON, used by EK [5];
- TR_EVOL, used by CIEMAT [6]; - VISION, used by CNL and INL [7].
All of the participants modelled the base case scenario and adjusted their models to produce similar behaviour. The analyses of the base case scenario by multiple organisations uncovered any remaining ambiguities in the scenario specification and helped clarifying the scenario documentation in order to ensure consistent interpretation. The remaining discrepancies revealed the impact of differences in code architectures. When these differences occurred, their drivers were identified and discussed. Finally, the base case results for each code provided a basis for identification of the effects of uncertainty of key parameters.
Description of the base case scenario
This study was conducted in several phases. First, a base case scenario was identified and carefully defined. The Expert Group has learned from past efforts that a clear and concise scenario definition is necessary to reduce the potential for multiple interpretations of the specification. The resulting base case scenario is 200 years in duration, begins with a fleet of thermal reactors (PWRs) in equilibrium using low enriched uranium oxide fuel (UOX) and transitions to a fleet of sodium fast reactors (SFRs) using a uranium/plutonium mixed oxide fuel near mid-scenario. The SFR fleet reaches its equilibrium before the end of the scenario. The electricity production is maintained constant at 430 TWhe/y throughout (see Figure 1).
Figure 1: Base case scenario - installed capacity
In the base case scenario, the reactors lifetime is supposed infinite. The enrichment tail of 235U is
0.25%. Fuel fabrication starts two years before the first load in each reactor and SFR fuel is made with a mix of depleted uranium and plutonium (Pu). The minimum spent fuel cooling time before reprocessing is of 5 years for PWR fuels and 2 years for SFR fuels. Time for reprocessing is assumed to be null.
PWR UOX spent fuel reprocessing starts in year 35 and is fixed at 850tHM/y. SFR spent fuel is reprocessed when available and according to the need in Pu for fresh fuel fabrication.
The Expert Group selected 22 of the most important scenario outputs as indicators for the study. Standard outputs include reactor numbers and types, mass flows of fuel and waste materials, and inventories of materials in storage and disposal.
Identification of the key parameters
The most important component of this study was the identification of the key parameters to be evaluated. The Expert Group drew from its collective expertise to develop the set of 17 parameters that most often are sources of uncertainty during the construction of scenario specifications. The second step in this process was to identify a variation range for each key primary parameter to be used as a basis for the sensitivity analysis. Again, experience was used, with each parameter varied over ranges typically used in past analyses (see Table 1).
Table 1: Identified key parameters and their range of variation
Parameters Units PWR UOX SFR
Fissile BU GWd/tHM 40, 50, 60 100, 136
Fresh fuel 235U enrichment % 4.95 (adjusted with BU) -
Equivalent Pu content % - 13.8 (adjusted with BU)
Cycle length EFPD 410 (adjusted with BU) 340 (adjusted with BU)
Breeding gain - 0.75, 0.9, 1, 1.1, 1.25
Reactor lifetime y Infinite, 60, 40 Infinite, 60, 40
Total nuclear energy demand TWh/y 430 430 (steady), ,
Minimum cooling time y 2, 5, 8 2, 5, 8
Fabrication time y 1, 2, 3 1, 2, 3
Introduction date of FR y - Year 70, 80, 90, 130
Rate of introduction y - Over 20, 30, 40 years
First year of reprocessing y 25, 35, 45 85, 95, 105
Annual reprocessing capacity tHM 700, 850, 1000 400, 600, 800
Losses (U and Pu) % 0.05, 0.1, 0.2
Reprocessing priority - FIFO to FILO
Enrichment tail % 0.15, 0.25, 0.35
60 - Reference value of the parameter
Output from the base case scenario
The outputs from the base case scenario obtained by all participants were compared in order to identify the discrepancies between the different codes. It is noteworthy that the different codes show a good consistency in the results. As 22 outputs were studied, those for which a very good agreement between the different codes was observed are not detailed in this article. The remaining differences are detailed hereafter.
For the front-end cycle, we observed a really good agreement between the different codes for the evaluation of the natural uranium consumption, the enrichment need, the UOX fabrication need and the Pu flow for FR fuel fabrication.
Slight discrepancies were observed on the estimation of the FR fuel fabrication need (see Figure 2).
They are due to inconsistencies in the initial data as this estimation was made from the energy production for some codes (e.g. COSI6) or from the installed nuclear power for others (e.g. FAMILY).
Figure 2: Base case scenario - FR fissile fuel fabrication need
For the back-end cycle and the inventories, more discrepancies were observed on the estimation of outputs. One source of discrepancies is the modelization of the reprocessing. Indeed, in the scenario specifications, the UOX spent fuel reprocessing starts in year 35 and is fixed at 850tHM/y in order to produce enough plutonium for FR deployment. However, with the code COSAC, available spent fuel is reprocessed only when Pu is required and in function of the need in Pu, without the possibility to anticipate it. That creates discrepancies on the need in PWR UOX spent fuel reprocessing (Figure 3),
and thus on the PWR UOX spent fuel and the interim reprocessed uranium storages (Figure 4). This
issue is not encountered for the FR spent fuel reprocessing, as it follows the need in Pu for all codes. Figure 3: Base case scenario - PWR UOX spent fuel flow at reprocessing
Another source of discrepancies is a slight difference in the breeding gain of the fast reactors considered by each organization. As SFR spent fuel is reprocessed according to the need in Pu, the amount and fissile content of Pu in spent SFR fuel directly impact their flow at reprocessing. Thus, differences on the breeding gain impact the need in SFR spent fuel reprocessing (Figure 5), and so
the SFR spent fuel storage (Figure 6) and the Pu interim storage (Figure 6).
Figure 5: Base case scenario - SFR spent fuel flow at reprocessing
Figure 6: Base case scenario - SFR spent fuel (left) and interim Pu (right) storages
The discrepancies observed on the total inventory of Pu in cycle and on the minor actinides inventory in waste are the consequences of the differences described previously (Figure 7).
Figure 7: Base case scenario - Pu inventory in cycle (left) and MA inventory in waste (right)
Overall, the study of the base case scenario by all the benchmark participants lead to consistent results between the different codes and provided a strong basis for the sensitivity study.
Sensitivity analysis
The primary activity in this study was to conduct sensitivity analyses on the key parameters in order to identify the effects and to quantify the potential impacts of sensibilities of the outputs to the inputs. To the extent possible, each parameter was varied independently, without change in any other part of the specification. During the sensitivity analyses, some scenarios “broke” and had insufficient fuel material for the SFR fleet. This was noted in the analysis and then an effort was made to “fix” the scenario. One option was to modify additional parameters to address an imbalance in the scenario. The other option was to add an external source of fuel material and to note the amount of extra material required to complete the scenario.
The sensitivity of the 22 outputs to the 17 identified parameters has been evaluated.With each fuel cycle metric being evaluated for each year of the scenario, we had to consider ways of comparing and displaying the results. Two methods were used and are detailed in this paper: the tornado diagrams and the sensitivity table.
To quantify the impact of the variation of an input parameter on the calculation, output indicators had to be defined. Three types of output indicators were retained:
- All the output parameters related to an annual flow (e.g. natural uranium consumption, enriched uranium needs, fuel fabrication and spent fuel reprocessing, …) were associated to output indicators defined as the cumulated value of the concerned output parameter;
- All the output parameters related to an inventory in an interim storage (e.g. spent fuel storage, reprocessed uranium storage, depleted uranium storage, …) were associated to output indicators defined as the maximum value of the concerned output parameter;
- All the output parameters related to a global inventory inside the cycle or the waste (e.g. plutonium inventory in the cycle, minor actinide inventory in the waste, …) were associated to output indicators defined as the final value of the concerned output parameter.
Tornado diagrams
The tornado diagram shows the correlation of a single output parameter to changes in the input parameters, one bar per input, where the direction of the bars on the diagram shows whether the correlation is positive or negative. The length of the bars shows the magnitude of the coupling between the parameters. There are two values of q for each input parameter: one for the case in which the given parameter is at its low value, and one for the case in which the parameter is at its high value.
The sensitivity value (see equation (1)) is used to quantify the change in an output indicator as a function of the change in the input parameter value, thus giving an estimation of the relative impact of each parameter on each output indicator. Note that the sensitivity cases that require changing more than one input parameter are excluded from this analysis.
)
(
)
(
s ref ref s ref refp
p
R
R
R
p
q−
−
= (1) refp
input parameter’s reference value,p
sinput parameter’s value in the sensitivity case refR
/R
s output indicator’s corresponding top
ref /p
sThe results of the sensitivity study, represented with Tornado diagrams, are detailed hereafter.
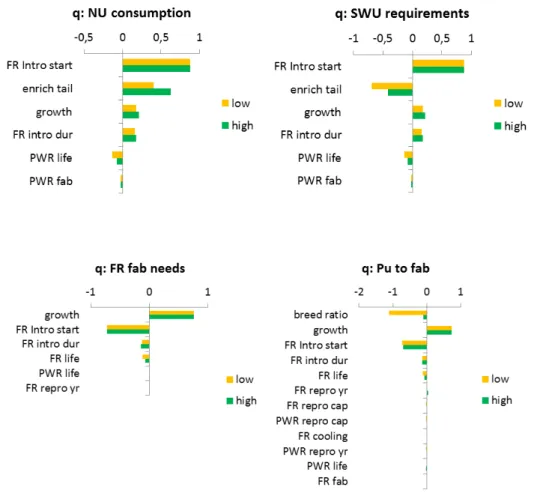
Front-end cycle
Figure 8: Sensitivity of front-end cycle results to each parameter
Overall, the beginning date of the SFR introduction has a strong impact on the front-end cycle results. Indeed, it is directly correlated to the period of operation of PWR and SFR. A later introduction of SFR results in a longer operation time of PWR and so on higher natural uranium (Unat) consumption and separative work unit (SWU) requirements. On the other hand, it reduces the SFR fleet operation time, resulting in reduced SFR fuel fabrication need and Pu flow to fabrication. For the same reasons but to a lesser extent, the duration of SFR introduction (their commissioning rate) impacts the results in the same way as their introduction date.
Obviously, the UOX enrichment tail impacts the SWU requirements. Due to the additional effort (SWUs) required to extract additional fissile material from lower assay tails, the relationships for tail enrichment are non-linear.
Due to the fabrication of final cores (resp. start-up), the PWR (resp. SFR) lifetime is negatively correlated to the PWR (resp. SFR) fuel fabrication need. This impact is slightly non-linear, as it is driven by the fraction of start-up cores over reactor life.
SFR fuel fabrication and Pu flow to fabrication are primarily impacted by the energy growth rate, which determines the total number of SFR required.
Finally, the SFR breeding ratio has a large, non-linear impact on the Pu flow through fuel fabrication. This is primarily due to SFRs with a negative breeding gain requiring an additional external Pu feed and impacting the fissile content and the quantity of the Pu.
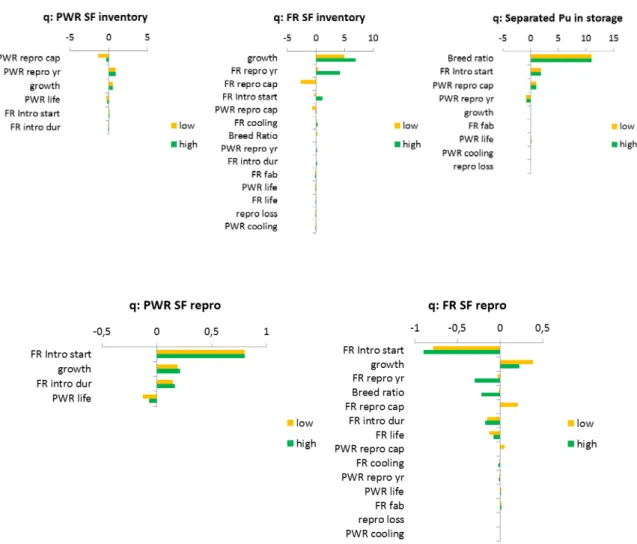
Back-end cycle
Spent fuel storages are sensitive to the reprocessing parameter as a later start of reprocessing results in an accumulation of spent fuel, but a higher reprocessing rate leads to a faster depletion of the storage. PWR UOX spent fuel reprocessing parameters also impact the amount of interim Pu stored. It is not the case for SFR spent fuel as it is reprocessed according to the need in Pu.
The energy growth rate has a large impact on SFR spent fuel reprocessing as it determines the number of commissioned SFRs. This property is non-linear as with a higher growth rate there is relatively more SFR in cooling inventory that is not yet available for reprocessing.
As the SFR spent fuel flow at reprocessing is adapted according to the Pu need for fresh fuel fabrication, it depends on the amount of Pu available in the spent fuel and so is impacted by the breeding ratio. The breeding ratio also directly impacts the separated Pu inventory as a higher breeding ratio increases the available Pu without significantly changing the Pu needed.
As the SFR introduction date is directly linked to the operational time of reactors and to the amount of available PWR and SFR spent fuel, it highly impacts the PWR and SFR spent fuel flow at reprocessing. Separated Pu being used for SFR fuel fabrication, a later SFR introduction leads to an accumulation of separated Pu.
Finally, the reactors lifetimes are negatively correlated to the spent fuel reprocessing as an decreased lifetime increases the number of final (PWR) or start-up (SFR) cores, leading to an increased amount of available spent fuel.
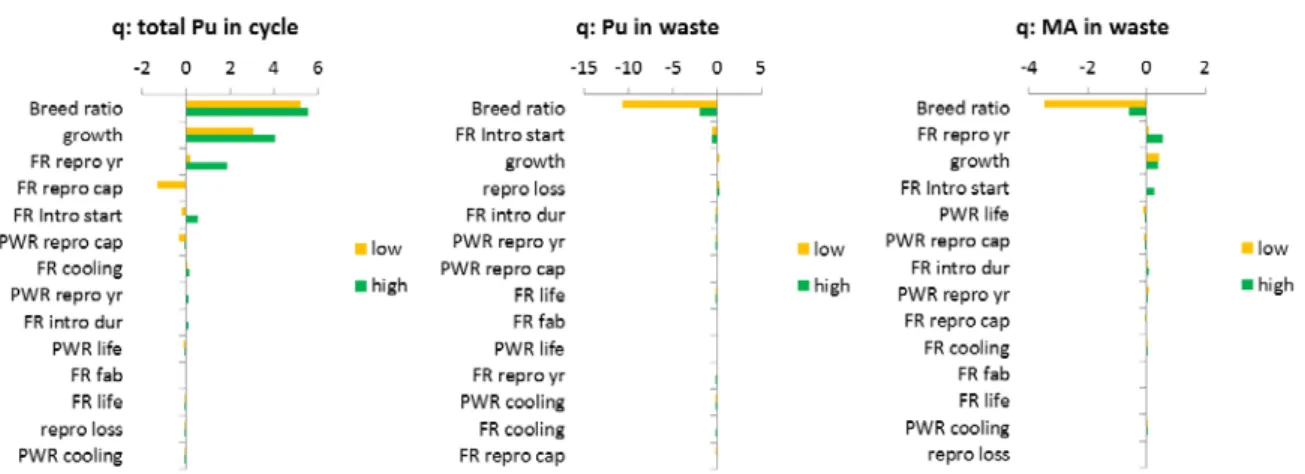
Inventories
Figure 10: Sensitivity of front-end cycle results to each parameter
Total Pu in cycle is increased by having more separated Pu in storage, which in turn is impacted by breeding ratio, SFR introduction, etc. A larger growth rate increases the total fleet size and total material inventory of the fleet, including the Pu in cycle. As the energy growth is exponential, the impact is non-linear and is bigger on the higher side of the sensitivity analysis. The SFR reprocessing parameters also impact the Pu in cycle in a non-linear way as, when a decreased SFR reprocessing results in broken scenarios and in the use of an external source of Pu, it increases the total Pu in the fuel cycle.
The final two tornado diagrams show the impact of input parameters on the total Pu and MA in waste. In both cases, the breeding ratio is the most significant input parameter. As explained previously, the breeding ratio is negatively correlated to the SFR spent fuel flux at reprocessing, which directly impacts the flux of materials being sent to the waste.
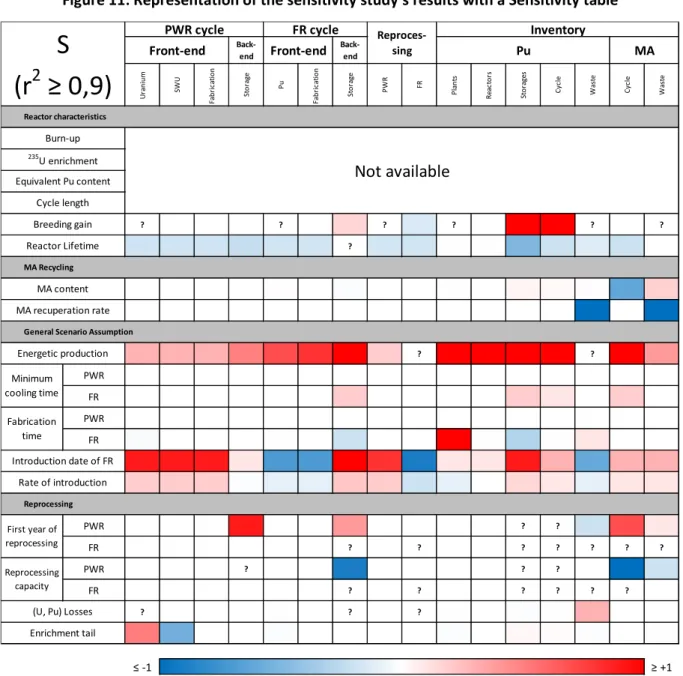
Sensitivity table
The sensitivity table provides a way to display the sensitivity analyses results, with all inputs and outputs together on a single table. The correlation of each input (table row) to each output (table column) is shown through colour shading of each cell in the table.
A sensitivity indicator (S, see equation (2)) aims at quantifying the variation of an output indicator to the variation of an input parameter, provided the linearity of the output indicator as a function of the input parameter. p R S ref ref
R
p
∂ ∂ = . (2) refp input parameter’s reference value,∂pits variation
ref
R /
∂
R
output indicator’s corresponding to pref / pref +∂pThe linearity is checked by calculating the coefficient of determination (r2). The sensitivity indicator is
retained as a valid parameter when r2 is greater than 0.9. It must be noticed that each sensitivity
indicator is calculated from a small amount of points (three points for most sensitivity indicators), so that the results should be considered as tendencies rather than absolute results.
Compared with the Tornado Diagram that displays two values of sensitivity (qmin and qmax), the sensitivity indicator is more global as it is based on a least squares linear regression upon the three available points (reference, upper sensitive case and lower sensitive case).
On the sensitivity table (Figure 11), a red sensitivity coefficient corresponds to a positive correlation
and a blue coefficient to a negative one. A darker colour (red or blue) indicates a higher sensitivity of the output to the parameter. In cases where the relationship is non-linear or otherwise hard to quantify into a single value, the shading is replaced with a “?”.
The sensitivity table provides a big picture view of the analysis results. The most important input parameters from a sensitivity perspective can easily be identified by noting the rows with the strongest shading. In accordance with the Tornado diagrams, these are the overall growth rate (energetic production) and the introduction date of the FRs, followed by the rate of FR introduction and the reactor lifetime. Explanations for these impacts have been given in the description of Tornado diagrams.
The change in reactor lifetime impacts material flows without changing the rest of the system. Additional input parameters with strong impacts on the scenario results are in the areas of breeding gain and reprocessing, where rows have some strongly shaded cells, but also have a number of “?” cells, indicating possible non-linear responses.
Figure 11: Representation of the sensitivity study’s results with a Sensitivity table
The sensitivity table also reveals more localized high impacts where one or two cells are strongly shaded relative to the rest of a row. For example, the enrichment tails only impacts Unat consumption and SWU requirements, but does not impact the rest of the fuel cycle.
Shifting to the columns, only a few outputs show significant sensitivity to a majority of the inputs, and none are sensitive to all inputs. We can note that outputs that are the most impacted are the storages and inventories.
Concluding remarks
This study aimed at assessing and quantifying the importance of input parameters in scenario analysis. The expert group identified 17 input parameters and evaluated the sensitivity of 22 of the most important scenario outputs to those parameters.
Back-end Back-end
Ur ani um SW U Fab ric at io n Sto ra ge Pu Fab ric at io n Sto ra ge PW R FR Pl an ts Re ac to rs St or ag es Cy cl e W as te Cy cl e W as te ? ? 0.2 ? -0.1 ? 9.1 5.4 ? ? -0.2 -0.2 -0.2 -0.2 -0.2 -0.2 ? -0.2 -0.2 0.0 0.0 -0.5 -0.2 -0.1 -0.2 0.0 0.0 0.0 0.0 0.0 0.0 0.0 0.0 -0.6 0.2 -2.0 -93.5 0.3 0.3 0.3 0.5 0.7 0.8 7.0 0.2 ? 1.0 1.0 8.0 4.0 ? 10.0 0.4 PWR 0.0 FR 0.2 0.0 0.2 0.1 0.2 PWR FR 0.0 0.0 -0.2 0.0 1.0 0.0 -0.3 0.0 0.1 0.0 0.9 0.9 0.9 0.1 -0.7 -0.7 1.0 0.8 -0.9 0.1 0.1 0.9 0.3 -0.6 0.3 0.3 0.2 0.2 0.2 0.0 -0.1 -0.1 0.2 0.2 -0.2 -0.1 0.0 0.2 0.1 -0.1 0.1 0.1 PWR 0.9 0.4 ? ? -0.2 0.7 0.1 FR ? ? ? ? ? ? ? PWR ? -0.9 ? ? -1.0 -0.2 FR ? ? ? ? ? ? ? 0.0 ? ? 0.0 0.0 0.0 0.3 0.0 0.5 -0.6 0.0 0.0 0.0 0.0 0.0 0.0 0.0 ≤ -1 ≥ +1 First year of reprocessing Reprocessing capacity (U, Pu) Losses Enrichment tail Introduction date of FR Rate of introduction Reprocessing Energetic production Minimum cooling time Fabrication time MA content MA recuperation rate
General Scenario Assumption Breeding gain Reactor Lifetime MA Recycling MA Reactor characteristics Burn-up Not available 235U enrichment Equivalent Pu content Cycle length
PWR cycle FR cycle
Reproces-sing Inventory Front-end Front-end
S
(r
2
≥ 0,9)
PuDifferent scenario codes were used for this study. Where prior benchmarking by this group and others has mainly focused on the common code capabilities, this study used some capabilities only found in some codes. This allowed to include a broader range of cases and to provide fuller information on the sensitivity of the scenario outputs to its inputs.
While the content of this study is most directly applicable to fuel cycle systems analysts, it should also be of value to researchers and developers working on the different parts of the nuclear energy system by providing a systems perspective for their work.
References
[1] OECD/NEA (2012), “Benchmark Study on Nuclear Fuel Cycle Transition Scenarios Analysis Codes”, NEA/NSC/WPFC/DOC(2012)16, Paris, France.
[2] Reference to the report when we’ll have one.
[3] C. Coquelet-Pascal, M. Tiphine, G. Krivtchik, D. Freynet, C. Cany, R. Eschbach, C. Chabert (2015), “COSI6: a tool for nuclear transition scenarios studies and application to SFR deployment scenarios with minor actinide transmutation”, Nucl. Technol., 192.
[4] B. Carlier (2013), “COSAC: a computational code dedicated to fuel cycle back-end simulations in AREVA”, AREVA document # PTDN-2013-037.
[5] A. Brolly, et al.(2014), “Development and application of SITON, a new fuel cycle simulation code”, Proc. of the 13th IEMPT, Korea.
[6] F. Álvarez-Velarde, et al. (2010), “TR_EVOL, upgrading of EVOLCODE2 for transition scenario studies”, First Workshop on Technology and Components of the ADS (TCADS-1). OECD/NEA, Karlsruhe, Germany.
[7] J. J. Jacobson, et al. (2010), “Verifiable Fuel Cycle Simulation Model (VISION): A Tool for Analysing Nuclear Fuel Cycle Futures, Nucl. Technol., 172 (2), pp. 157-178.