Educational Campaigns Reach
Students?
Evidence from two cities in Russia and
Ukraine
Elena Denisova-Schmidt, Martin Huber, Elvira Leontyeva
Elena Denisova-Schmidt Candidate of Sciences in Pedago-gy, Dr. Phil., Lecturer, University of St. Gallen (Switzerland); Research Fellow, Center for International Higher Edu-cation (CIHE), Boston College (USA). E-mail: elena.denisova-schmidt@un-isg.ch Address: University of St. Gal-len (HSG), Gatterstr., 3, 9010 St. GalGal-len, Switzerland.
Martin Huber
PhD, Professor, University of Fribourg (Switzerland). E-mail: martin.huber@ unifr.ch Address: University of Fribourg, Bd. De Pérolles 90, 1700 Fribourg, Swit-zerland.
Elvira Leontyeva
E-mail: elvira.leontyeva@gmail.com Address: 136, Tikhookeanskaya str., Khabarovsk, 680035, Russian Feder-ation.
Abstract. The authors investigate the effect of anti-corruption educational terials — an informational folder with ma-terials designed by Transparency
In-ternational — on the willingness of stu-dents to participate in an anti-corruption campaign and their general judgment about corruption in two cities in Rus-sia and Ukraine by conducting experi-ments. During a survey of 350 students in Khabarovsk, Russia, and 600 students in Lviv, Ukraine, young people were ran-domly exposed to either a folder with in-formation about the negative effects of corruption in general and in the high-er education system in particular (treat-ment group), or a folder with information irrelevant to corruption (control group). The effects were statistically significant
in the total sample in Khabarovsk and only in some social groups in Lviv. The results might be interesting not only for scholars, but also for policy makers and practitioners.
Keywords: Anti-Corruption Campaigns, Corruption, Academic Integrity, Exper-iments, University, Students, Russia, Ukraine.
DOI: 10.17323/1814-9545-2016-1-61-83
Received in November 2015
This paper compares the effectiveness of anti-corruption interventions at universities in Khabarovsk, Russia, with the results at universities in Lviv, Ukraine, which were published in an earlier study by Deniso-va-Schmidt, Huber, and Prytula [2015]. Experiments on corruption are new trends in the study of this phenomenon. One of the reasons be-hind this development is that these experiments offer more
ing causal explanations of the results compared to other techniques (see, for example, discussions in [Serra, Wantchekon, 2012; Findley, Nielson, Sharman, 2013; Holmes, 2015]).
Russia and Ukraine represent very interesting cases for studying this question. They both possess very good and longstanding higher education systems and they both are among the most corrupt coun-tries in the world.1 Both countries have undergone several significant changes in the recent past, including the transition period following the breakup of the USSR, the Bologna process, and the standardi-zation of the university admissions procedure (cf. [Denisova-Schmidt, Leontyeva, Prytula 2014a, 2014b]). Moreover, both countries have im-plemented some important anti-corruption initiatives and laws in the area of higher education. For example, the replacement of entrance examinations with new unified exams — the Edinyi Gosudarstvennyi
Ek-samen (EGE) (Engl.: Unified State Exam) and Vneshnee nezavisimoe otsenivanie (VNT) (Engl.: External Independent Assessment) — which
has reduced bribery at the admissions level [Denisova-Schmidt, Leon-tyeva 2014; Klein 2014].
Using materials developed by Transparency International, we test-ed the effects of anti-corruption campaigns among students at select-ed universities in two regional centers — Khabarovsk and Lviv — in the first half of 2015. In particular, we examined the willingness of students to participate in an anti-corruption campaign by distributing flyers to other students on campus. As a social group, students are one of the major forces in fighting against corruption [Altbach, Klemencic 2014; Klemencic 2014]. Taking into account the role of students in society, the aim of our study is to measure the effectiveness of an anti-corruption intervention among students in Russia and Ukraine and their attitude towards this phenomenon by conducting an experiment.
When working on corruption in higher education, Russian scholars usually distinguish between “corruption” (often only monetary tion) and “cheating” [Golunov, 2014]. In our paper we define corrup-tion in broader terms as “the abuse of entrusted power for private gain” (Transparency International) as well a the lack of academic integrity, including the use of cheat sheets, copying from others during exams, plagiarism, “academic collusion” [Titaev, 2012], and other forms (see, for example, [Denisova-Schmidt, 2013, 2015; Galitskii, Levin, 2008; Le-ontyeva, 2010a; LeLe-ontyeva, 2010b; Rimskii, 2010, 2011a, 2011b; Titaev, 2005; Osipian, 2012a, 2012b]; for more information, see the discussion on defining corruption in [Denisova-Schmidt, Huber, Leontyeva, 2015]). The remainder of this paper is organized as follows: Chapter 2 out-lines the research design, Chapter 3 describes the methods applied and the results received, and Chapter 4 finishes with a conclusion. 1 Transparency International ranked Russia 136th and Ukraine 142nd in its 2014
Corruption Perception Index of 175 countries. The original text was
provided by the author to the Editorial of the journal Educational Studies. Moscow. This study was conducted with financial support provided by the Center for Governance and Culture in Europe at the University of St. Gallen and the Department of Economics at the University of Fribourg. The sponsors influenced neither the research design nor the interpretation of the results. The preliminary findings were discussed at a colloquium of the Department of Politics and the Economics Research Center for East European Studies at the University of Bremen, led by Heiko Pleines, on 14 November 2014, and at the conference “Rethinking Students: Ideas and New Research Approaches”, held at Higher School of Economics in Moscow from 15-17 October, 2015. We would also like to thank Alena V. Ledeneva and Yaroslav Prytula for their valuable feedback.
Students were drawn from universities in Khabarovsk, Russia, and Lviv, Ukraine. Khabarovsk is a major city located in the Russian Far East with a population of more than 600,000. Lviv is a major city in the western part of Ukraine with a population of more than 700,000. Khabarovsk hosts 23 universities, while Lviv is home to 26. Our sam-ple includes only respondents studying at state universities in four main subject areas representing a majority of all students: social, nat-ural, and technical sciences, and the humanities (Table 1). We con-sidered students studying at public universities on-site with at least three to five prior semesters (2-oi kurs or 3-ii kurs). The represent-ative study was conducted in early 2015 and had 950 student-par-ticipants in the survey: 350 respondents from Russia and 600 from Ukraine. Both genders were represented as follows: 54.3% (n=190) female students and 45.7% (n=160) male students from Khabarovsk, and 42.2% (n=253) female students and 57.8% (n=347) male stu-dents from Lviv (Table 1). The participating stustu-dents were all approxi-mately the same age (19–20 years). Students were approached by the interviewer. The face-to-face interviews were conducted on the uni-versity campuses. The study was conducted completely in the native language of all the persons involved — Russian or Ukrainian, respec-tively. No language-based misunderstandings are expected. At a par-ticular point in the interview, students were randomly provided with ei-ther a folder with information about the negative effects of corruption in general and in the higher education system in particular (treatment group)2, or a folder with information irrelevant to corruption (control group). Randomization was made on a timing rule: The interviewer looked at his or her watch and if it showed an even-numbered min-ute, the student was put into the treatment group and provided with anti-corruption materials, otherwise the respondent was assigned to 2 The anti-corruption folder was based on materials designed by
Transparen-cy International (see Appendix for further details).
2. Research design Table 1. Student Profile
Khabarovsk Lviv Female students 54.3 (n = 190) 42.2 (n = 253) Male students 45.7 (n = 160) 57.8 (n = 347) Social sciences 35.4 (n = 124) 34.7 (n = 208) Technical sciences 48.0 (n = 168) 42.2 (n = 253) Natural sciences 2.6 (n = 9) 10.3 (n = 62) Humanities 14 (n = 49) 12.7 (n = 76)
the control group and received corruption-irrelevant information (see more in [Denisova-Schmidt, Huber, Prytula, 2015]).
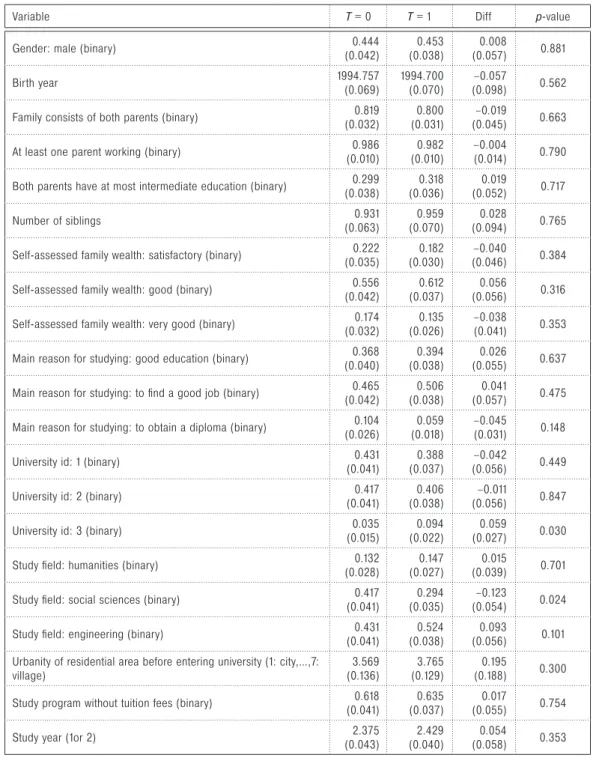
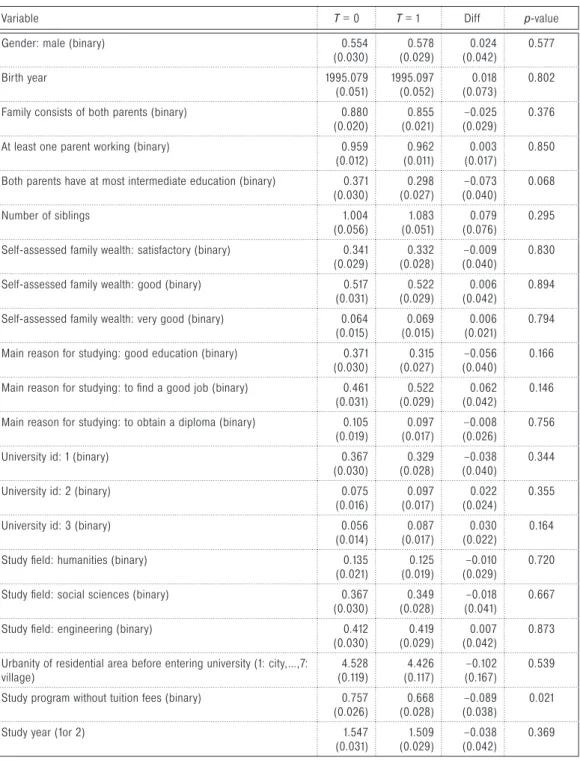
Table 2 and Table 3 report the means of selected person-al characteristics of the respondents across treatment states for both Khabarovsk and Lviv: 314 individuals (90% of the sample) in Khabarovsk were without missing information in any of the covariates and 556 individuals (93% of the sample) in Lviv were without missing information in any of the covariates. The data provided a profile of the students who participated in the survey — their backgrounds (gender, family, income, place of birth, and residence), their motives for obtain-ing a higher education (to get a good education, to get a good job in the future, to obtain a diploma), their field of study, including the year and program involved (state stipend or self-payer), and the mean dif-ferences and p-values of two sample t-tests. The statistical insignif-icance of most of these differences confirms that the randomization of the treatment was correct and that the minor item nonresponse is-sue did not influence the randomization. Alone, the mean differenc-es in being inscribed in one of the universitidifferenc-es and in the field of so-cial science in Khabarovsk, as well as in the “study program without tuition fees” group in Lviv are significant at the 5% level, while none of the remaining variables are significantly different across treatment states at the 10% level.
As in [Denisova-Schmidt, Huber, Prytula 2015], we evaluated the im-pact of the intervention based on three econometric methods. First, we considered the mean differences in the outcome variables across treatment states. If the treated and control groups are comparable in any characteristics that potentially affect the outcomes as intended by the randomization of the treatment, then taking mean differenc-es is an unbiased differenc-estimate of the intervention’s causal effect. Even in experiments, some (hopefully minor) differences in characteris-tics across treatment groups may occur, in particular when the sam-ple size is small. We therefore also considered two methods that ac-count for differences in any of the observed characteristics displayed in Table 2 and Table 3.
The first estimator is an OLS regression of the outcome of the treatment and the observed characteristics,3 which linearly controls for differences in the latter variables. However, the potential draw-backs of OLS are its linearity assumption, which may be violated in 3 Depending on the outcome variable considered, different observed char-acteristics were significant in different regressions. Among those variables that are more frequently significant than other ones is the choice of univer-sity and/or field of study, gender, family background (e. g. parent education and wealth), study year, reasons for studying, and paying a fee. However, there is no characteristic that was significant in all of the regressions.
3. Methods and results
Table 2. Mean covariate values by treatment status (Khabarovsk)
Variable T = 0 T = 1 Diff p-value
Gender: male (binary) (0.042)0.444 (0.038)0.453 (0.057)0.008 0.881
Birth year 1994.757(0.069) 1994.700(0.070) (0.098)–0.057 0.562 Family consists of both parents (binary) (0.032)0.819 (0.031)0.800 (0.045)–0.019 0.663
At least one parent working (binary) (0.010)0.986 (0.010)0.982 –0.004(0.014) 0.790 Both parents have at most intermediate education (binary) (0.038)0.299 (0.036)0.318 (0.052)0.019 0.717
Number of siblings (0.063)0.931 (0.070)0.959 (0.094)0.028 0.765 Self-assessed family wealth: satisfactory (binary) (0.035)0.222 (0.030)0.182 (0.046)–0.040 0.384
Self-assessed family wealth: good (binary) (0.042)0.556 (0.037)0.612 (0.056)0.056 0.316 Self-assessed family wealth: very good (binary) (0.032)0.174 (0.026)0.135 –0.038(0.041) 0.353
Main reason for studying: good education (binary) (0.040)0.368 (0.038)0.394 (0.055)0.026 0.637 Main reason for studying: to find a good job (binary) (0.042)0.465 (0.038)0.506 (0.057)0.041 0.475
Main reason for studying: to obtain a diploma (binary) (0.026)0.104 (0.018)0.059 –0.045(0.031) 0.148 University id: 1 (binary) (0.041)0.431 (0.037)0.388 (0.056)–0.042 0.449
University id: 2 (binary) (0.041)0.417 (0.038)0.406 (0.056)–0.011 0.847 University id: 3 (binary) (0.015)0.035 (0.022)0.094 (0.027)0.059 0.030
Study field: humanities (binary) (0.028)0.132 (0.027)0.147 (0.039)0.015 0.701 Study field: social sciences (binary) (0.041)0.417 (0.035)0.294 (0.054)–0.123 0.024
Study field: engineering (binary) (0.041)0.431 (0.038)0.524 (0.056)0.093 0.101 Urbanity of residential area before entering university (1: city,…,7:
village) (0.136)3.569 (0.129)3.765 (0.188)0.195 0.300
Study program without tuition fees (binary) (0.041)0.618 (0.037)0.635 (0.055)0.017 0.754 Study year (1or 2) (0.043)2.375 (0.040)2.429 (0.058)0.054 0.353
Note: The reference category for “self-assessed family wealth” is “basic”; the reference category for “university id” is “4”;
the reference category for “study field” is “natural sciences”. P-values are based on t-tests which allow for unequal variances across treatment groups.
Table 3. Mean covariate values by treatment status (Lviv)
Variable T = 0 T = 1 Diff p-value
Gender: male (binary) 0.554
(0.030) (0.029)0.578 (0.042)0.024 0.577
Birth year 1995.079
(0.051) 1995.097(0.052) (0.073)0.018 0.802 Family consists of both parents (binary) 0.880
(0.020) (0.021)0.855 (0.029)–0.025 0.376
At least one parent working (binary) 0.959
(0.012) (0.011)0.962 (0.017)0.003 0.850 Both parents have at most intermediate education (binary) 0.371
(0.030) (0.027)0.298 (0.040)–0.073 0.068
Number of siblings 1.004
(0.056) (0.051)1.083 (0.076)0.079 0.295 Self-assessed family wealth: satisfactory (binary) 0.341
(0.029) (0.028)0.332 (0.040)–0.009 0.830 Self-assessed family wealth: good (binary) 0.517
(0.031) (0.029)0.522 (0.042)0.006 0.894 Self-assessed family wealth: very good (binary) 0.064
(0.015) (0.015)0.069 (0.021)0.006 0.794 Main reason for studying: good education (binary) 0.371
(0.030) (0.027)0.315 (0.040)–0.056 0.166 Main reason for studying: to find a good job (binary) 0.461
(0.031) (0.029)0.522 (0.042)0.062 0.146 Main reason for studying: to obtain a diploma (binary) 0.105
(0.019) (0.017)0.097 (0.026)–0.008 0.756
University id: 1 (binary) 0.367
(0.030) (0.028)0.329 (0.040)–0.038 0.344
University id: 2 (binary) 0.075
(0.016) (0.017)0.097 (0.024)0.022 0.355
University id: 3 (binary) 0.056
(0.014) (0.017)0.087 (0.022)0.030 0.164
Study field: humanities (binary) 0.135
(0.021) (0.019)0.125 (0.029)–0.010 0.720 Study field: social sciences (binary) 0.367
(0.030) (0.028)0.349 (0.041)–0.018 0.667
Study field: engineering (binary) 0.412
(0.030) (0.029)0.419 (0.042)0.007 0.873 Urbanity of residential area before entering university (1: city,…,7:
village) (0.119)4.528 (0.117)4.426 (0.167)–0.102 0.539
Study program without tuition fees (binary) 0.757
(0.026) (0.028)0.668 (0.038)–0.089 0.021
Study year (1or 2) 1.547
(0.031) (0.029)1.509 (0.042)–0.038 0.369
Note: The reference category for “self-assessed family wealth” is “basic”; the reference category for “university id” is “4”; the
reference category for “study field” is “natural sciences”. P-values are based on t-tests which allow for unequal variances across treatment groups.
reality, and the omission of interactions between the treatment and the characteristics.4 For this reason, we also considered the so-called inverse probability tilting (IPT) method as proposed by Graham et al (2012).5 This semi-parametric method reweights observations by the inverse of the treatment propensity score (the conditional probabili-ty to receive the treatment given the observed characteristics) before taking mean differences, and does not restrict the outcome model to be linear. An attractive feature of IPT (compared to alternative pro-pensity score weighting approaches) is that it exactly balances the means (or even further moments) of the covariates of interest in such a way that the covariate means are identical in the treated and con-trol groups.
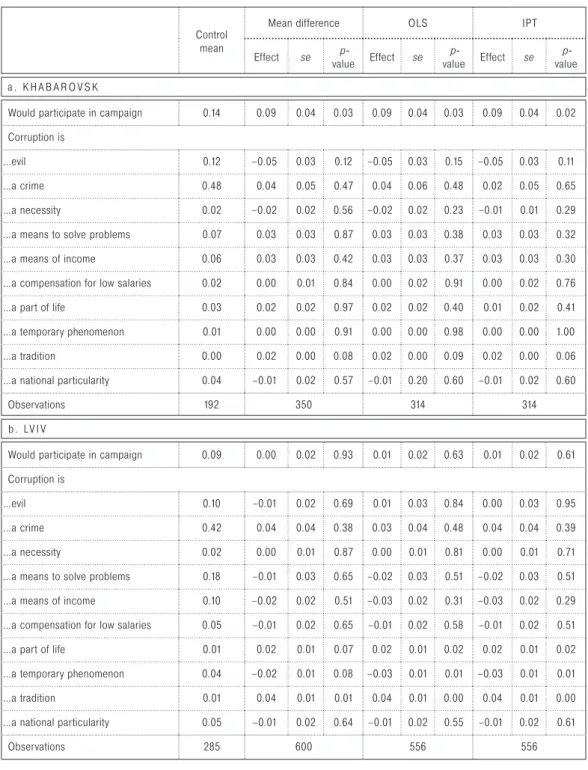
Tables 5a and 5b demonstrate the results for the total sample. The second column shows the various mean outcomes among controls, while the third shows the mean differences between treated and con-trol groups. The fourth and fifth columns contain the heteroscedastic-ity robust standard errors and p-values. The OLS and IPT estimates can be found in columns 6–8 and 9–11, respectively.
The outcomes of interest we evaluated were the effect of the an-ti-corruption folders against the corruption-irrelevant folders on the willingness of students to participate in an anti-corruption campaign by distributing flyers to other students on campus (binary indicator). For a positive response to the proposition (willingness=1), students left their mobile numbers and/or e-mail addresses so that they might be contacted again. Moreover, we looked at the impact of folders on 4 For instance, if the true probability model is actually nonlinear, incorrectly imposing the linearity assumption in OLS regression may entail predictions that lie outside the theoretically possible probabilities between 0 (or 0%) and 1 (or 100%).
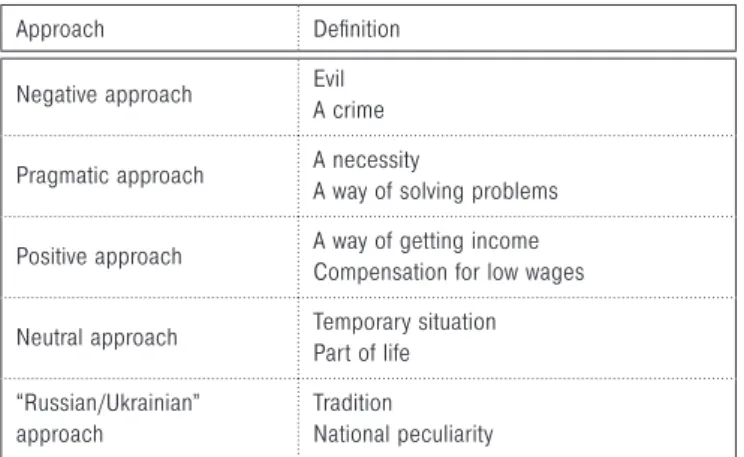
5 To this end, we use the stata command “ipTATE” provided by the authors. Table 4. What is corruption to you?
Approach Definition
Negative approach EvilA crime
Pragmatic approach A necessity
A way of solving problems Positive approach A way of getting incomeCompensation for low wages
Neutral approach Temporary situation Part of life “Russian/Ukrainian”
approach
Tradition National peculiarity
student assessments of corruption in general. Students were asked to define “corruption” by choosing “in the first place” and “in the sec-ond place” (Table 4).
Each option may be represented by a dummy variable, with all of the dummy variables adding up to 1 if any of the possible definitions were picked (only answers highlighted as “in the first place” were con-sidered). By the way the question was asked, the treatment’s short run impact on the relative importance of the various options might be assessed, rather than the absolute (i. e. cardinal) change in impor-tance. 48 observations in Khabarovsk (13.7%) and 9 observations in Lviv (1.5%) did not pick any option, resulting in their dummy variables remaining at zero.
All of these methods — mean difference, OLS and IPT — suggest that the willingness to participate in anti-corruption activities (“would participate in a campaign”) is significantly affected by the intervention in the total sample in Khabarovsk (the increase is by around 9 points), while none of the methods suggests a willingness to participate in Lviv.6
The intervention did not have any significant effects on defini-tions of corruption in either city, however, nor did it have an effect on the “negative” (corruption is “evil” and “a crime”), “positive” (corrup-tion is “a way of getting income” and “compensa(corrup-tion for low wages”), and “pragmatic” (corruption is “a necessity” and “an everyday occur-rence”) approaches. The intervention increased the view that corrup-tion is a “part of the system” in both societies: “corrupcorrup-tion is a tradicorrup-tion” increased by 2 points in Khabarovsk and by 4 points in Lviv. Moreover, students in Lviv see corruption as “a part of life” (increase by 2 points) and do not consider corruption as a “temporary phenomenon” (de-crease by 2–3 points).
Our data show significant differences between both cities in terms of the willingness to participate in the campaign (“would participate in campaign”) — where Russian students show more enthusiasm — and in terms of the definition of corruption (“corruption is a crime”, “corrup-tion is a means to solve problems”), both of which are more present among students in Khabarovsk. This might be explained by a range of factors, including differences in the socio-economic composition of the students as well as the timing: the study was conducted dur-ing a difficult time for Ukraine, as the country faced political and eco-nomic challenges, and the respondents seemed to be worn out from political and social activism. While unsuccessful European integra-tion and the war in Donbass were on the agenda in Ukrainian mass media, one of the main topics in Russian media was the fight against corruption: several high-ranking officials were accused of extortion and bribes, including several cases in the Russian Far East, including 6 We should acknowledge that the treatment is rather small in scale, and that we cover only short-term effects in our study. More research is needed on this topic.
Table 5. Effects in the total sample
Control mean
Mean difference OLS IPT
Effect se valuep- Effect se valuep- Effect se valuep-
а . K H A B A R O V S K
Would participate in campaign 0.14 0.09 0.04 0.03 0.09 0.04 0.03 0.09 0.04 0.02 Corruption is
…evil 0.12 –0.05 0.03 0.12 –0.05 0.03 0.15 –0.05 0.03 0.11 …a crime 0.48 0.04 0.05 0.47 0.04 0.06 0.48 0.02 0.05 0.65 …a necessity 0.02 –0.02 0.02 0.56 –0.02 0.02 0.23 –0.01 0.01 0.29 …a means to solve problems 0.07 0.03 0.03 0.87 0.03 0.03 0.38 0.03 0.03 0.32 …a means of income 0.06 0.03 0.03 0.42 0.03 0.03 0.37 0.03 0.03 0.30 …a compensation for low salaries 0.02 0.00 0.01 0.84 0.00 0.02 0.91 0.00 0.02 0.76 …a part of life 0.03 0.02 0.02 0.97 0.02 0.02 0.40 0.01 0.02 0.41 …a temporary phenomenon 0.01 0.00 0.00 0.91 0.00 0.00 0.98 0.00 0.00 1.00 …a tradition 0.00 0.02 0.00 0.08 0.02 0.00 0.09 0.02 0.00 0.06 …a national particularity 0.04 –0.01 0.02 0.57 –0.01 0.20 0.60 –0.01 0.02 0.60
Observations 192 350 314 314
b. LV I V
Would participate in campaign 0.09 0.00 0.02 0.93 0.01 0.02 0.63 0.01 0.02 0.61 Corruption is
…evil 0.10 –0.01 0.02 0.69 0.01 0.03 0.84 0.00 0.03 0.95 …a crime 0.42 0.04 0.04 0.38 0.03 0.04 0.48 0.04 0.04 0.39 …a necessity 0.02 0.00 0.01 0.87 0.00 0.01 0.81 0.00 0.01 0.71 …a means to solve problems 0.18 –0.01 0.03 0.65 –0.02 0.03 0.51 –0.02 0.03 0.51 …a means of income 0.10 –0.02 0.02 0.51 –0.03 0.02 0.31 –0.03 0.02 0.29 …a compensation for low salaries 0.05 –0.01 0.02 0.65 –0.01 0.02 0.58 –0.01 0.02 0.51 …a part of life 0.01 0.02 0.01 0.07 0.02 0.01 0.02 0.02 0.01 0.02 …a temporary phenomenon 0.04 –0.02 0.01 0.08 –0.03 0.01 0.01 –0.03 0.01 0.01 …a tradition 0.01 0.04 0.01 0.01 0.04 0.01 0.00 0.04 0.01 0.00 …a national particularity 0.05 –0.01 0.02 0.64 –0.01 0.02 0.55 –0.01 0.02 0.61
Observations 285 600 556 556
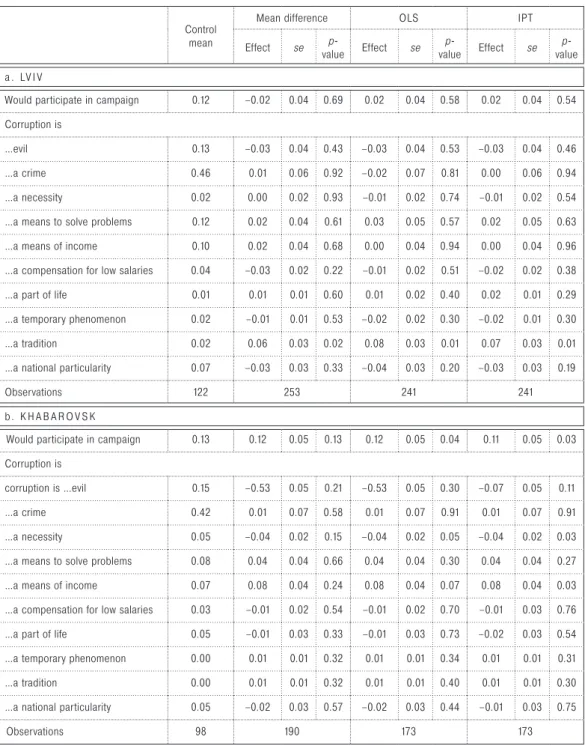
Table 6. Effects among female students
Control mean
Mean difference OLS IPT
Effect se valuep- Effect se valuep- Effect se valuep-
а . LV I V
Would participate in campaign 0.12 –0.02 0.04 0.69 0.02 0.04 0.58 0.02 0.04 0.54 Corruption is
…evil 0.13 –0.03 0.04 0.43 –0.03 0.04 0.53 –0.03 0.04 0.46 …a crime 0.46 0.01 0.06 0.92 –0.02 0.07 0.81 0.00 0.06 0.94 …a necessity 0.02 0.00 0.02 0.93 –0.01 0.02 0.74 –0.01 0.02 0.54 …a means to solve problems 0.12 0.02 0.04 0.61 0.03 0.05 0.57 0.02 0.05 0.63 …a means of income 0.10 0.02 0.04 0.68 0.00 0.04 0.94 0.00 0.04 0.96 …a compensation for low salaries 0.04 –0.03 0.02 0.22 –0.01 0.02 0.51 –0.02 0.02 0.38 …a part of life 0.01 0.01 0.01 0.60 0.01 0.02 0.40 0.02 0.01 0.29 …a temporary phenomenon 0.02 –0.01 0.01 0.53 –0.02 0.02 0.30 –0.02 0.01 0.30 …a tradition 0.02 0.06 0.03 0.02 0.08 0.03 0.01 0.07 0.03 0.01 …a national particularity 0.07 –0.03 0.03 0.33 –0.04 0.03 0.20 –0.03 0.03 0.19
Observations 122 253 241 241
b. K H A B A R O V S K
Would participate in campaign 0.13 0.12 0.05 0.13 0.12 0.05 0.04 0.11 0.05 0.03 Corruption is
corruption is …evil 0.15 –0.53 0.05 0.21 –0.53 0.05 0.30 –0.07 0.05 0.11 …a crime 0.42 0.01 0.07 0.58 0.01 0.07 0.91 0.01 0.07 0.91 …a necessity 0.05 –0.04 0.02 0.15 –0.04 0.02 0.05 –0.04 0.02 0.03 …a means to solve problems 0.08 0.04 0.04 0.66 0.04 0.04 0.30 0.04 0.04 0.27 …a means of income 0.07 0.08 0.04 0.24 0.08 0.04 0.07 0.08 0.04 0.03 …a compensation for low salaries 0.03 –0.01 0.02 0.54 –0.01 0.02 0.70 –0.01 0.03 0.76 …a part of life 0.05 –0.01 0.03 0.33 –0.01 0.03 0.73 –0.02 0.03 0.54 …a temporary phenomenon 0.00 0.01 0.01 0.32 0.01 0.01 0.34 0.01 0.01 0.31 …a tradition 0.00 0.01 0.01 0.32 0.01 0.01 0.40 0.01 0.01 0.30 …a national particularity 0.05 –0.02 0.03 0.57 –0.02 0.03 0.44 –0.01 0.03 0.75
Observations 98 190 173 173
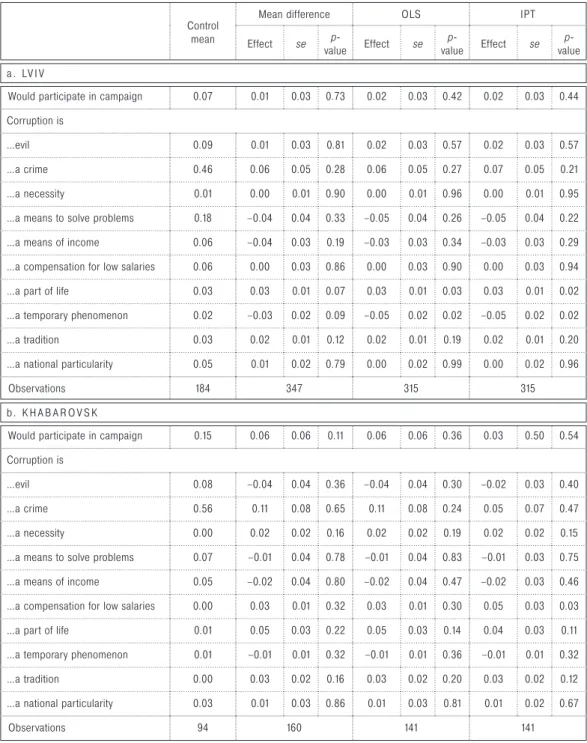
Table 7. Effects among male students
Control mean
Mean difference OLS IPT
Effect se valuep- Effect se valuep- Effect se valuep-
а . LV I V
Would participate in campaign 0.07 0.01 0.03 0.73 0.02 0.03 0.42 0.02 0.03 0.44 Corruption is
…evil 0.09 0.01 0.03 0.81 0.02 0.03 0.57 0.02 0.03 0.57 …a crime 0.46 0.06 0.05 0.28 0.06 0.05 0.27 0.07 0.05 0.21 …a necessity 0.01 0.00 0.01 0.90 0.00 0.01 0.96 0.00 0.01 0.95 …a means to solve problems 0.18 –0.04 0.04 0.33 –0.05 0.04 0.26 –0.05 0.04 0.22 …a means of income 0.06 –0.04 0.03 0.19 –0.03 0.03 0.34 –0.03 0.03 0.29 …a compensation for low salaries 0.06 0.00 0.03 0.86 0.00 0.03 0.90 0.00 0.03 0.94 …a part of life 0.03 0.03 0.01 0.07 0.03 0.01 0.03 0.03 0.01 0.02 …a temporary phenomenon 0.02 –0.03 0.02 0.09 –0.05 0.02 0.02 –0.05 0.02 0.02 …a tradition 0.03 0.02 0.01 0.12 0.02 0.01 0.19 0.02 0.01 0.20 …a national particularity 0.05 0.01 0.02 0.79 0.00 0.02 0.99 0.00 0.02 0.96
Observations 184 347 315 315
b. K H A B A R O V S K
Would participate in campaign 0.15 0.06 0.06 0.11 0.06 0.06 0.36 0.03 0.50 0.54 Corruption is
…evil 0.08 –0.04 0.04 0.36 –0.04 0.04 0.30 –0.02 0.03 0.40 …a crime 0.56 0.11 0.08 0.65 0.11 0.08 0.24 0.05 0.07 0.47 …a necessity 0.00 0.02 0.02 0.16 0.02 0.02 0.19 0.02 0.02 0.15 …a means to solve problems 0.07 –0.01 0.04 0.78 –0.01 0.04 0.83 –0.01 0.03 0.75 …a means of income 0.05 –0.02 0.04 0.80 –0.02 0.04 0.47 –0.02 0.03 0.46 …a compensation for low salaries 0.00 0.03 0.01 0.32 0.03 0.01 0.30 0.05 0.03 0.03 …a part of life 0.01 0.05 0.03 0.22 0.05 0.03 0.14 0.04 0.03 0.11 …a temporary phenomenon 0.01 –0.01 0.01 0.32 –0.01 0.01 0.36 –0.01 0.01 0.32 …a tradition 0.00 0.03 0.02 0.16 0.03 0.02 0.20 0.03 0.02 0.12 …a national particularity 0.03 0.01 0.03 0.86 0.01 0.03 0.81 0.01 0.02 0.67
Observations 94 160 141 141
Alexander Choroshavin7, the governor of Sakhalin, and Viktor Chu-dov8, the head of the regional parliament in Khabarovsk. This might have made an impact on the respondents in Khabarovsk: the results of combating corruption were visible. Students in Lviv, on the contra-ry, might be disappointed from the recent and ongoing reforms aiming to combat corruption in the country (see, for example, discussions in [Grødeland, 2010; The Economist, 2015]) and could be rather skepti-cal about a small anti-corruption campaign organized at the universi-ty by distributing flyers. Moreover, we simply asked our respondents about their willingness to participate in the campaign; we did not ac-tually organize and run it. Students in Khabarovsk might demonstrate more willingness to participate just by saying it and not by following through (social desirability).
Inspired by the findings of gender-specific aspects of corruption (see, for example, [Chaudhuri, 2012]) — specifically “good girl, bad boy” [Jetter, Walker, 2015] — we decided to look at this parameter as well (Table 6a and 6b and Table 7a and 7b). Indeed, some control means differ importantly across genders: “corruption is evil”, “cor-ruption is a crime” and cor“cor-ruption is “a necessity” in Khabarovsk as well as “would participate in a campaign” and “corruption is a means for solving problems” in Lviv. Moreover, in Khabarovsk the interven-tion has a considerably larger effect on willingness to participate in a campaign among females than among males, while no important gen-der differences in the effect on potential participation are found in Lviv. Furthermore, females in Khabarovsk receiving the intervention less of-ten state that corruption is a “necessity” and more ofof-ten consider it as a “source of income”, while no such effects are found for males. In Lviv, the treatment induces males to more often consider corruption as a “part of life” and less often as a “temporary phenomenon”, while females more frequently see it as a “tradition”.
In addition to the quantitative part, our survey included one open question: we asked students about their personal experiences with bribery in their university studies. Our data represent not only the presence and the frequency of this issue, but also the reasons be-hind it. While the respondents in Khabarovsk were sparing in their explanations, just saying “for an exam” (za eksamen), “for a better mark” (za luchshuiu ocenku) or “due to pressure from a faculty mem-ber (na sessii prepodavatel’ vymogal vsiatku), students in Lviv helped to create a detailed picture. The reasons for bribing might be clustered as follows: 1) missing classes — which are obligatory at Ukrainian and Russian universities (“there were many missed classes” — bulo
bag-ato enok); 2)“unnecessary” subjects like sports (“for sport” — za fiz-kul’turu); 3) merely pursuing a formal degree without regard for how
7 http://www.sakhalin.info/horoshavin/100693
it is obtained (“do not want to study, but need a degree” — ne
kho-chu vchitis, a diplom treba’); 4) willingness to get a state scholarship
(“needed a few points to get a scholarship” — treba bulo do stipendii
paru baliv); or 5) no time for studying (“was not ready for an exam” — ne buv gotovii do eksamenu). According to our data, students appear
to be the main initiators of bribes. Lecturers might initiate a bribe, but this is rare. In both cities, bribes were initiated either by hinting (“direct and indirect hint made by a lecturer” — UKR: priamii ta nepriamii
na-tiak vikladacha) or by force (“paid for subject by compulsion of a
lec-turer” — RU:‘proplachival predmet po prinuzhdeniiu prepodavatelia, “a lecturer demanded a bribe” — UKR: vimagav chabaria vikladach).
While monetary corruption is more evident and easy to determi-nate, non-monetary corruption is more widespread. Table 8 illustrates the frequency of academic dishonesty among students in both cit-ies. NB: this is not seen as a comparative analysis.
Our experiments show that the effectiveness of anti-corruption ed-ucational campaigns is unclear. Moreover, such campaigns might even “promote” corruption. The latter was more evident in Lviv:
stu-4. Conclusion Table 8. How often do you use the following practices?
Areas Actions Not never responses*
Khabarovsk (n = 350)
Lviv (n = 600) Taking exams Using a cheat sheet during
exams 92.2 94.5
Copying somebody’s work
during examinations or tests 90.8 95.1
Writing papers Downloading a course paper (or other written work) from the Internet
57.9 64.2
Buying a course paper (or other written work) from special companies or classmates
32.2 40.4
Writing a paper on one’s own, but copying and pasting some chapters from the Internet
92.8 92.8
Communicating with the professor
Deceiving a professor while explaining problems associated with studies
42.5 68.2
Asking a professor for an
individual approach 26.1 37.5
dents who were not previously engaged in monetary corruption in their dealings with the faculty learned about the pervasiveness of corrupt behavior through the anti-corruption folder and their acceptance of corruption increased significantly9. However, students who were pre-viously engaged in monetary corruption in their dealings with the fac-ulty were more ready to participate in anti-corruption campaigns. The intervention influenced students who stated that they purchase term papers (or other papers) from special agencies or written by other students: the number of students who believed that “corruption is a crime” and “corruption is evil” increased, while the number who be-lieved that “corruption is a means to solve problems” decreased. Stu-dents without such experiences were more likely to believe that “cor-ruption is a means to solve problems” than “cor“cor-ruption is evil” after the intervention (see more in Denisova-Schmidt, Huber, and Prytula, 2015). Anti-corruption campaigns were more effective in Khabarovsk. Interestingly, students in Russia show an ambivalent attitude towards corruption: in comparison to students in Lviv, they more often define corruption as “a crime”, but at the same time as “a means to solve problems”. The study outcomes show slight gender differences: wom-en in Lviv are more willing than mwom-en to fight corruption, while womwom-en in Khabarovsk have a more negative attitude towards corruption.
The results of our study might be interesting not only for schol-ars, but also for policy makers in Russia and Ukraine and for such or-ganizations as Transparency International. In our experiments, we used only printed materials. The younger generation we investigat-ed is growing up in different circumstances, however, in which digi-tal media play an important role. Would the results be different if we used only computer-based materials, such as short videos, Power-Point presentations, or postings in social media accounts? This needs to be investigated further.
All of the involved actors should not only invest in anti-corruption education, but also tackle the systematic problems that have caused endemic corruption at universities, such as the number of obligatory classes students need to take (“unnecessary” classes), and respond to the current challenge that many other academic systems are faced with — the massification of higher education. In both countries, this has reached a crucial number: 80% of the 18–21 age cohorts now en-roll in tertiary education. Not all of them are ready to study at such a high level and universities are increasingly dealing with “un-teachable” students (Denisova-Schmidt and Leontyeva, 2015) who are looking for formal degrees rather than education. It is difficult to blame young people for this; they do not have other alternatives because the sys-tem of vocational training is insufficient and almost destroyed.
9 Similar results were found in Costa Rica [Gingerich, Oliveros, Corbacho, Ruiz-Vega, 2015].
Interestingly, the new Ukrainian law on higher education address-es the quaddress-estion of “unnecaddress-essary” classaddress-es and freaddress-es universitiaddress-es from obligating students to participate in such disciplines as sports or pol-itics. Universities have not rushed to implement this point, however. In this case, these subjects would be offered on an elective basis, with the students deciding whether or not to study them. Both the lectur-ers and the students do not seem to be ready for this change.
This problem is not limited to Russia and Ukraine anymore; corrup-tion can be “exported”. In 2009, a large number of students from the University of St. Gallen in Switzerland took an exchange semester at a few Russian and Ukrainian universities. When they came back with their results, the department responsible for accepting their work was very surprised to learn that all of the students received a high num-ber of credits (in some cases up to 60 or 80 credits for one semes-ter), and all of them received only excellent marks. The class descrip-tions of the seminars they attended in Russia and Ukraine were almost identical to the class descriptions of the courses at the University of St. Gallen. This department became very suspicions and decided not to accept the results of this exchange, placing those Russian and Ukrain-ian universities on a black list. Students at the University of St. Gallen may still go to those universities, but their credits will be not accepted. This might not be helpful for Russia, with its current ambitious plans for establishing world-class universities, or for Ukraine, cur-rently recovering after its second Revolution, which was instigated by corruption, among other factors.
1. Altbach P. G., Klemencic M. (2014) Student Activism Remains a Potent Force Worldwide. International Higher Education, vol. 76, no 5, pp. 2–3. 2. Chaudhuri A. (2012) Gender and Corruption: A Survey of the
Experimen-tal Evidence. New Advances in ExperimenExperimen-tal Research on Corruption (eds D. Serra, L. Wantchekon), Bingly: Emerald, pp. 13–49.
3. Denisova-Schmidt E. (2013) Justification of Academic Corruption at
Rus-sian Universities: A Student Perspective. Edmond J. Safra Working Papers No 30. Available at: http://dx.doi.org/10.2139/ssrn.2353513 (accessed 11
January 2016).
4. Denisova-Schmidt E. (2015) Academic Dishonesty or Corrupt Values: The
Case of Russia. Available at:
http://anticorrp.eu/publications/academ-ic-dishonesty-or-corrupt-values-the-case-of-russia/ (accessed 11 Janu-ary 2016).
5. Denisova-Schmidt E., Leontyeva E., Prytula Y. (2014a) Corruption at
Uni-versities is a Common Disease for Russia and Ukraine. Available at: http://
ethics.harvard.edu/blog/corruption-universities-common-disease-rus-sia-and-ukraine (accessed 11 January 2016).
6. Denisova-Schmidt E., Leontyeva E., Prytula Y. (2014b) Vozmozhnosti srav-nitelnogo podkhoda v issledovaniyakh rossiyskoy i ukrainskoy sistem vyss-hego obrazovaniya: genezis, struktura, korruptsiya [Russian and Ukrainian Higher Education Systems: Possibilities for Comparative Studies on their Genesis, Structure and Corruption]. Vestnik TOGU, no. 3, pp. 263–266.
7. Denisova-Schmidt E., Leontyeva E. (2014) The Unified State Exam in Rus-sia: Problems and Perspectives. International Higher Education, vol. 76, no 5, pp. 22–23.
8. Denisova-Schmidt E., Leontyeva E. (2015) Categoriia «neobuchaemykh» studentov kak sozialnaya baza universiteta: primer dalnevostochnykh vu-zov [‘Un-Teachable’ Students as the Social Basis of Universities: Examples from the Russian Far East]. Sotsiologicheskie issledovaniya, no 9, pp. 90– 97.
9. Denisova-Schmidt E., Huber M., Prytula Y. (2016) An Experimental Evalua-tion of an Anti-CorrupEvalua-tion IntervenEvalua-tion among Ukrainian University Students.
Eurasian Geography and Economics (forthcoming).
10. Denisova-Schmidt E., Huber M., Leontyeva E. (2016) On the Development of Students’ Attitudes towards Corruption and Cheating in Russian Univer-sities. European Journal of Higher Education (forthcoming).
11. Findley M., Nielson D., Sharman J. (2014) Global Shell Games. Cambridge: Cambridge University Press.
12. Galitsky E. B., Levin M. I. (2008) Vsyatkoobuchenie i ego sotsialnye posled-stviya [Bribe-Learning and its Social Consequences]. Voprosy
obrazovani-ya/Educational Studies. Moscow, no 3, pp. 105–117.
13. Gingerich D. W., Oliveros V., Corbacho A., Ruiz-Vega M. (2015) Corruption
as a Self-Fulfilling Prophecy: Evidence from a Survey Experiment in Costa Rica. IDB Working Paper No 546.
14. Graham B. S., Pinto de Xavier C. C., Egel D. (2012) Inverse Probability Tilt-ing for Moment Condition Models with MissTilt-ing Data. Review of Economic
Studies, vol. 79, no 3, pp. 1053–1079.
15. Golunov S. (2014) The Elephant in the Room. Corruption and Cheating in
Russian Universities. Stuttgart: IbidemVerlag.
16. Grødeland Å. B. (2010) Elite Perceptions of Anti-Corruption Efforts in Ukraine. Global Crime, vol. 11, no 2, pp. 237–260.
17. Holmes L. (2015) Corruption: A Very Short Introduction. Oxford: Oxford University Press.
18. Jetter M., Walker J. K. (2015) Good Girl, Bad Boy: Corrupt Behavior in
Pro-fessional Tennis. IZA Discussion Paper No 8824. Bonn: Institute for the
Study of Labor.
19. Klein E. (2014) Ukraine’s Testing Innovation. International Higher Education, vol. 75, spring iss., pp. 24–25.
20. Klemenčič M. (2014) Student Power in a Global Perspective and Contem-porary Trends in Student Organizing. Studies in Higher Education, vol. 39, no 3, pp. 396–411.
21. Leontyeva E. (2010a) Institualizatsiya neformalnykh praktik v sfere vysshego
obrazovaniya [The Institutionalization of Informal Practices in Higher
Educa-tion] (PhD Thesis). Khabarovsk: Pacific National University.
22. Leontyeva E. (2010b) Standarty i realnost: mozhno li v rossiyskikh vuzakh uchitsya po pravilam? [Standards and Reality: Is it Possible to Study in Rus-sian Universities if you Follow the Rules?]. Voprosy
obrazovaniya/Educa-tional Studies. Moscow, no 1, pp. 208–224.
23. Osipian A. (2012a) Economics of Corruption in Doctoral Education: The Dis-sertations Market. Economics of Education Review, vol. 31, no 1, pp. 76–83. 24. Osipian A. (2012b) Education Corruption, Reform, and Growth: Case of
Post-Soviet Russia. Journal of Eurasian Studies, vol. 3, no 1, pp. 20–29. 25. Rimskiy V. L. (2010) Sposobstvuet li sistema vysshego obrazovaniya
ras-prostraneniyu korruptsii v Rossii? [Is System of Higher Education Contrib-utes to Spreading of Corruption in Russia?]. Terra Economicus, vol. 8, no 3, pp. 91–102.
26. Rimskiy V. (2011a) EGE sposobstvuet rostu korruptsii v sisteme obrazovani-ya [EGE Contributes to the Increase of Corruption in the Education system].
Pedagogicheskie izmereniya, no 2, pp. 36–48.
27. Rimskiy V. (2011b) Edinye gosudarstvennye eksameny priveli k novym for-mam korruptsii v sisteme vysshego obrazovaniya [United State Exems Con-tributed to New Forms of Corruption in the Higher Education System).
Ped-agogicheskie izmereniya, no 3, pp. 49–77.
28. Serra D., Wantchekon L. (2012) New Advances in Experimental Research
on Corruption. Bingly: Emerald.
29. The Economist (2015) Look West, Maidan. The Revolution in Ukraine is
Be-ing Smothered by Corruption and Special Interests. Available at: http://
www.economist.com/news/leaders/21666610-revolution-ukraine-be-ing-smothered-corruption-and-special-interests-look-west (accessed 11 January 2016).
30. Titaev K. D. (2005) Pochem eksamen dlya naroda? Etyud o korruptsii v vy-sshem obrazovanii [How Much Does the Exam Cost for People? The Es-say about the Corruption in Higher Education]. Economic Sociology, no 2, pp. 69–82.
31. Titaev K. D. (2012) Akademicheskiy sgovor. Otchego rossiyskie vuzy stano-vyatsya «zaborostroitelnymi institutami» [Academic Collusion. Why Russian Universities are Becoming ‘Fence-Building Institutions’]. Otechestvennye
zapiski, no. 2. Available at:
Folder 1 was a color-printed booklet. It was made using materials de-veloped by Transparency International10 and included the following information:
• the position of Russia and Ukraine in the Corruption Perception In-dex. In its 2014 index of 175 countries, Transparency International ranked Russia in 136th place and Ukraine in 142nd place;11 • the definition of corruption as the abuse of entrusted power for
collective and private gain in monetary and non-monetary forms;12 • some forms of corruption, such as bribery, collusion, conflict of in-terest, fraud and nepotism (see picture 1), plus some areas of cor-ruption, like politics, the courts, business, the healthcare system, police, and education (Corruption in the UK: Overview and Policy Recommendations, 2011; Corruption: A Beginner’s Guide, 2012); • examples of corruption in higher education both without student
involvement (manipulation of finances, university properties, ac-creditation) and with student involvement (copying, plagiarism, cheating the faculty, bribes for grades and other preferential treat-ment) and their negative consequences (Global Corruption Re-port: Education, 2013).
The folder ends with the call for participation in anti-corruption cam-paigns organized in Khabarovsk or Lviv, respectively.
10 See the campaign “Unmask the corrupt”: http://www.transparency.org/un-mask_the_corrupt/en/ (accessed on August 15, 2015)
11 http://www.transparency.org/cpi2014/results (accessed on August 15, 2015)
12 http://www.transparency.org.ru/dokumenty/missiia (accessed on August 15, 2015)
Appendix: Folder 1 (treatment group)
Source: Graphic by the authors
based on Transparency
Inter-national: “Corruption: A Begin-ner’s Guide,” December 2012:
http://www.transparency.org.uk/ our-work/publications/10-publi- cations/454-corruption-a-begin-ners-guide-what-is-corruption. (accessed on August 15, 2015) Picture 1. Some forms of corruption: bribery, collusion, conflict of interest, fraud and nepotism.
CORRUPTION IS... Nepotism Fraud Bribes Conflict of Interests Collusion