Get rights and content
Learning and Instruction
Volume 22, Issue 1, February 2012, Pages 16-26
Science text comprehension: Drawing, main idea selection,
and summarizing as learning strategies
Claudia Leopold , Detlev Leutner
Instructional Psychology Department, Faculty of Educational Sciences, Duisburg-Essen University, Schuetzenbahn 70, D-45127 Essen, Germany
Received 21 December 2010, Revised 27 May 2011, Accepted 29 May 2011, Available online 25 June 2011.
Show less
https://doi.org/10.1016/j.learninstruc.2011.05.005
Abstract
The purpose of two experiments was to contrast instructions to generate drawings with two text-focused strategies—main idea selection (Exp. 1) and summarization (Exp. 2)— and to examine whether these strategies could help students learn from a chemistry science text. Both experiments followed a 2 × 2 design, with drawing strategy
instructions (yes vs. no) and main idea/summarization strategy instructions (yes vs. no) as experimental factors. The main dependent variable was science text comprehension, measured by a multiple-select test and a transfer test. Participants were 90 (Exp. 1) and 71 (Exp. 2) students (grade 10). The results of both experiments showed positive effects of the drawing strategy instructions and negative effects of the text-focused strategy instructions without interactions. These results are consistent with the mental model approach to comprehension, showing advantages of drawing activity in fostering science text comprehension.
Highlights
Previous Next
► Drawing improves understanding compared to main idea selection and summarizing. ► Students’ spatial representations mediated the effect of the drawing strategy. ►
Learning strategies affect comprehension and representation of the learning content.
Keywords
Learning strategies
;Drawing activity
;Visualization
;Summarization
;Text
comprehension
1. Introduction
Learning-strategy and self-regulation approaches emphasize the importance of the learner actively processing the learning materials (Pressley and Harris, 2006, Weinstein and Mayer, 1986, Winne and Hadwin, 1998, Zimmerman and Schunk, 2001). One important way learners guide and direct their own learning is by means of learning strategies. In particular, cognitive strategies are thought to affect comprehension by activating and focusing learners’ information processing (Mayer, 1996). Besides that, cognitive strategies also affect the mental representation students construct when processing the learning material. Suppose a student is reading a scientific text and uses strategies that are directed toward reproducing the text rather than toward
understanding what the text is about. Conversely, suppose there is another student who uses strategies aimed at comprehending rather than at reproducing the text. It is very likely that the mental representation constructed while processing the text will differ between the two students depending on the particular strategies used (e.g., Marton and Säljö, 1997, Mayer and Cook, 1981).
In learning-strategy research, little attention has been paid to relating particular
cognitive strategies to specific levels of cognitive representations constructed by learners (Leopold, 2009). We view this relation as important because these representations
constitute the products of learning, and students access these representations when answering questions on to-be-learned content. Consequently, the level of the mental representation is related to the level of understanding achieved (e.g., Ozuro, Dempsey, & McNamara, 2009).
In text-comprehension research, the level of the mental representation constructed by learners is a central topic. There is wide agreement that understanding a text involves constructing multilevel representations of the information conveyed by the text (van Dijk et al., 1983, Graesser et al., 1997, Johnson-Laird, 1983, Kintsch, 1998). A surface
representation preserves the exact wording and syntax of text clauses and describes comprehension at the sentence level. A propositional representation preserves the meaning of the text, but not the exact wording and syntax. However, the meaning is represented by abstract symbols that are associated with the content described only by means of a convention (Glenberg, Gutierrez, Levin, Japuntich, & Kaschak, 2004). Therefore, the propositional representation is considered a descriptive representation and is associated with explicit text memory (Schnotz & Bannert, 2003). By contrast, a mental model represents “what the text is about” (Glenberg, Meyer, & Lindem, 1987, p. 70), that is, the situation described by the text. Johnson-Laird (1983) pointed out that mental models possess inherent structural features that are associated with the contents they represent by structural or functional analogy and allow us to manipulate the model and read off relational information. Therefore, mental models provide a basis for
drawing inferences and for developing a deeper understanding of text content.
There is substantial evidence that processes of meaning construction and representation are flexible and vary depending on the learners’ goals and strategies (van den Broek et al., 2001, Graesser et al., 1994, Magliano et al., 1999). When processing a text with a particular strategy, the learner’s attention may be focused on particular levels of cognitive representations. Analogous to a mental camera, the learner may zoom in on text-based features or on the situation described by the text, thereby fostering the
construction of a more shallow text-based representation or of a mental model (Graesser et al., 1994, Magliano et al., 1999, Perrig and Kintsch, 1985, Schmalhofer and Glavanov, 1986). McNamara, Ozuru, Best, and O’Reilly (2007) considered these aspects in their framework and made a distinction between text-focused strategies that help the reader to process the information explicitly stated in the text and strategies to help the reader go beyond the text.
In view of the potential of mental models to promote comprehension, our first goal was to focus on strategy instructions that promote the construction of mental models. Thereby, we focused on expository texts that describe complex spatial relationships between objects and elements. Consider, for example, the passage from a chemistry text on the structure of water molecules and a sample drawing by a student in Fig. 1.
Download : Download full-size image
To develop an understanding of the text’s content, the reader is required to form a mental representation of the objects and relations that are described by the text. In the above example, this would imply a representation of the spatial structure of the water molecule, which enables the learner to generate inferences on where neighboring molecules can attach themselves, which—in turn—constrains the process of mental model construction. One advantage of these visual-spatial representations is that they make spatial relationships explicit; thereby, they help the learner to recognize key features and support inference generation (Larkin & Simon, 1987).
We propose that visualization strategies are particularly useful in fostering these kinds of mental models because they help students to represent features and relations structurally analogous to those of the reference objects (e.g., the angle between the two hydrogen atoms). Therefore, we refer to these strategies as model-focused strategies. Readers who use strategies for visualizing or manipulating the referential content of an expository science text are expected to comprehend the text better than those who do not invest effort in visualization.
Empirical results provide support for this prediction, although effects vary depending on the strategy used and instructional support provided. Glenberg et al. (2004, Exp. 3) found that training in manipulating toy objects and images had a positive effect in first-and second-grade students. Students were first trained in manipulating toy objects to simulate the actions described by a text. Afterwards, they were given practice in
imagining these actions without actually moving the objects. Both direct and imagined manipulation improved memory and comprehension of the text material compared to a re-reading control group. Lesgold, McCormick, and Golinkoff (1975) reported a related effect for a manipulation based on drawing activity and imagery training when reading a prose story. Compared to manipulation training with real objects, the illustration
imagery training allows for more flexible use in school settings because students need only paper and pencil to represent the relevant objects. However, the training comprised multiple strategies (e.g., drawing activity, imagining, selecting, and recalling important information), and therefore it was impossible to determine which of the strategies contributed to the improvement of comprehension.
Van Meter (2001) investigated whether drawing activity would improve learning from a biology science text. Fifth- and sixth-grade students read a text about the nervous system and received either pure drawing instructions, drawing instructions with various kinds of additional support, or pictures with no drawing instructions. The results showed that drawing activity was as beneficial as learning with experimenter-presented pictures. However, drawing students outperformed the pictures-only group when they were provided with illustrations after the drawing process along with prompted questions. Unfortunately, no text-only group (with no provided illustrations) was utilized to provide a baseline for the effectiveness of pure drawing activity. However, the results of
learned better from a text about the chemistry of the washing process when they were asked to draw and were given drawing prompts compared to a text-only control group that received neither prompts nor drawing instructions.
With college-aged readers, Hall, Bailey, and Tillman (1997) showed, in line with Van Meter (2001), that a drawing group and a pictures-only group performed equally well. Furthermore, their results showed, in line with Schwamborn et al. (2010), that the
drawing group obtained higher scores than a control group that studied the text without pictures and without drawing instructions. Related results showing the benefits of drawing instructions were reported by Alesandrini (1981) and Dean and Kulhavy (1981). However, in some studies, no benefits of drawing instructions were found (Leutner et al., 2009, Snowman and Cunningham, 1975). Leutner et al. (2009), for example, asked students to read a science text on water molecules and to draw sketches for each
paragraph; however, the drawing group did not perform better than a control group did. One reason for these results may be the type of test used for assessing comprehension. In the Leutner et al. study, the students were asked to take a multiple-choice test on text-related inferences. Possibly, they relied primarily on factual knowledge in answering these questions. Snowman and Cunningham (1975) used a multiple-choice test that required recall of factual information and found no benefits of drawing activity, either. Likewise, Van Meter, Aleksic, Schwartz, and Garner (2006) found no effects of drawing activity on a multiple-choice recognition test; however, the benefits of drawing were revealed on a problem-solving test. Van Meter and Garner (2005) pointed out that benefits of drawing activity are more likely to be revealed on assessments that test a deeper understanding of to-be-learned content. Thus, when investigating effects of drawing activity, it seems to be important to use tests that are sensitive to higher levels of comprehension (e.g., Hall et al., 1997, Schwamborn et al., 2010, Van Meter, 2001). In most of the studies showing benefits of drawing activity, a drawing condition was compared with a control group that received no further strategy instructions on how to study the text. Therefore, it cannot be ruled out that the positive effect of drawing is attributable to the students investing more effort in processing the learning materials than the control group did. It does not necessarily imply an advantage of constructing a structurally analogous representation of the objects referred to, as indicated by the mental model approach (Johnson-Laird, 1983). In view of these considerations, our second goal is to compare the effectiveness of a drawing strategy not only with a control condition but also with a strategy that leads learners to invest effort in activities other than the construction of visual-spatial representations.
A possible strategy meeting these requirements is to draw the learner’s attention to text-based processing, such as paraphrasing (Alesandrini, 1981, Kulhavy et al., 1985) or
summarizing (Foos, 1995, Johnson-Glenberg, 2000). Students are then required to invest effort in processing the text material but are not required to construct a visual-spatial
representation of the content to be learned. Rather, their attention is drawn to text-based processing. Larkin and Simon (1987) pointed out that text-based processing is sequential in nature. One characteristic feature of these processes is that readers linearly process and search the data structure (i.e., the text). Thereby, it is more difficult to
recognize important components that are topologically related and to draw inferences on the basis of these components. By contrast, the process of drawing makes topological relations among components explicit and thereby helps the learner to identify relations among the components of a displayed object (Larkin & Simon, 1987). In support of this
Alesandrini (1981) found that drawing was more beneficial than the instruction to paraphrase the explicit information stated in the text.
We expected strategies that foster text-based processing and strategies that foster model-based processing to differentially affect the comprehension of texts that describe spatial relationships between objects and elements. By comprehension, we mean higher level comprehension that is based on representations of the objects and relations described in the text in terms of a mental model. When the learner’s attention is focused on text-based processing—for example, when identifying main ideas or summarizing a text—he or she is more likely to process the explicitly presented text information in order to create a representation of words and relationships between words. According to
McNamara et al. (2007), we call these strategies text-focused strategies.
By contrast, when the learner is asked to visualize text information—when drawing a sketch that represents the most important ideas and relations—he or she primarily concentrates on the information explicitly stated in the text, but is also requested to transform the verbal input into a nonverbal representation of the objects referred to (Johnson-Glenberg, 2000, Van Meter and Garner, 2005). Because this nonverbal representation indicates structural relationships, it should allow inferences based on perceptual cues, such as spatial relations and connections, which are difficult to infer from verbal representations alone (see Larkin & Simon, 1987). This is consistent with the findings that the benefits of a drawing activity generally occur on tests measuring a deep level of understanding (Van Meter & Garner, 2005). Therefore, we refer to drawing strategies as model-focused strategies.
We expect students who were asked to engage in a drawing activity to comprehend the text better than students who either learned with no specific strategy or were asked to engage in text-focused processing. Moreover, in the studies cited above, model-focused and text-focused strategies were not systematically combined. Students were instructed to use either a drawing strategy or a text-focused strategy (e.g., Alesandrini, 1981,
Kulhavy et al., 1985). However, there may be possible interactions among these strategies when applied simultaneously and when the strategies are related to one another.
Therefore, we included a condition in which students were requested to use both strategies for processing a science text.
2. Experiment 1
The purpose of Experiment 1 was to test whether a drawing strategy and/or a verbal selection strategy helps students when reading a science text on chemistry. Students were asked either to draw pictures for each paragraph of a science text or to select and write down main ideas of each paragraph. The combined strategy included both instructions. Students were required to draw a picture and write down important concepts next to the corresponding components in the picture. We expected students who learn with the drawing strategy to perform better in comprehension and transfer questions than students who learn with the main idea selection strategy or with no-specific strategy (Hypothesis 1). We also expected students who learn with the drawing strategy to better visualize spatial relations of text-related concepts than students who learn with the main idea selection strategy or with no-specific strategy (Hypothesis 2).
2.1. Method
2.1.1. Participants and design
Ninety German students from grade 10 from two high-track secondary schools
participated in the experiment. Two classrooms participated per school. Within classes, students were randomly assigned to the experimental groups. The mean age of the students was 16.2 years (SD = 0.51), and the percentage of female students was 46.7%. All students attended regular chemistry lessons at school and were familiar with basic chemical concepts. One of the science teachers introduced the experimenters who explained to students that participation in the study was voluntary. Students were informed that they would receive individual feedback on their results if they wished. To this end, students were asked to memorize an individual password.
The experiment was based on a 2 × 2-factorial between-subjects design, with the experimental factors being “drawing strategy instructions” (yes vs. no) and “main idea selection strategy instructions” (yes vs. no). The drawing strategy was aimed at fostering the construction of pictorial representations. The main idea selection strategy was aimed at fostering verbal representations. In the both-strategies group, the drawing strategy and the main idea selection strategy were combined. A no-strategy group
(neither drawing nor main idea selection strategy instructions) was included to provide a baseline for comparison. Twenty-two students served in the no-strategy group, 22 served in the drawing group, 23 served in the main idea group, and 23 in the both-strategies group. The data of two students had to be excluded because they did not complete all the materials appropriately.
2.1.2. Materials
The learning and testing materials consisted of (a) a science text along with three versions of a booklet provided for self-generated drawings and main ideas, (b) two
multiple-select comprehension tests for assessing prior knowledge and comprehension after studying the science text, (c) a transfer test with open questions for measuring deep understanding and application of text content, (d) a visualization test for assessing spatial representations of text content, (e) a self-report questionnaire, and (f )
standardized tests for measuring verbal ability and spatial ability as control variables. The science text about water molecules (1558 words) consisted of seven central topics that comprised (a) the chemical structure of water molecules, (b) the dipole-character of water molecules, (c) hydrogen bonds, (d) the structure of salt crystals, (e) the hydration process, (f ) surface tension, (g) the density anomaly of water. A modified version of the text was used by Leopold et al., 2007, Leopold, 2009 and Leutner et al. (2009). These studies demonstrated that 35 min were sufficient for reading the text attentively (including drawing or marking main ideas). In the science text each paragraph was marked with successive numbers. The booklets for the drawing-, main idea-, and both-strategies groups contained (successive) vertically aligned rectangular frames, providing spaces for self-generated pictures and/or text. Each frame was headed with the
corresponding number of the paragraph in order to be able to assign the student-generated production to the corresponding paragraph. The front page of the booklet contained a sample paragraph and the appropriate drawing and/or main ideas, according to the experimental condition that was employed. The no-strategy group received the text without a booklet.
A multiple-select posttest was constructed for assessing comprehension of the science text content (Cronbach’s alpha = .76). There were 17 questions covering the seven topics with four possible responses to each question. For each question, one, two, three, or even all four options could be correct. Students were told that one, two, three, or four options could be correct and were asked to select the options they believed to be correct. To prevent the students from gaining points by guessing, the numbers of correct and incorrect responses were balanced across the whole test. Scores were calculated by awarding 1 point for each accurate response (i.e., selecting a correct option; not selecting an incorrect option) across the 68 response options. Thus, scores on this test could range from 0 to 68. An example question was: “What is the chemical basis of a hydrogen bond?” with answer choices given as: “(a) the polar nature of water molecules, (b)
attraction forces between electrons, (c) attraction forces between ions, or (d) the polar covalent bond of the water molecule” (options a and d are correct). These kinds of questions required students to link information between different sentences or
paragraphs from the text; that is, the correct answers could not be directly obtained, but rather had to be inferred from the text. However, all the questions were still closely related to the text; that is, these questions were designed to assess students’
understanding of text-related concepts, but did not require students to transfer their knowledge to new problems.
measuring comprehension of text-related concepts (e.g., “Why is the water molecule called a dipole molecule?”; “What is meant by hydration of ions?”). The format of the test was similar to the posttest mentioned above. There were four possible responses to each question, resulting in a maximal number of 40 points. As for the posttest, the numbers of correct and incorrect responses were balanced across the whole test. The transfer test consisted of five open-ended questions, following Mayer’s (2009)
example, to assess a deep understanding of the learning content (Cronbach’s alpha = .73). Learners were asked to explain and solve problems that were not explicitly given in the text. They were thus asked to apply what they had learned to a new situation. An
example is the question: “Seawater in polar areas could be colder than 0 °C without freezing. How would you explain this fact?” For scoring the answers, a checklist was constructed with three key ideas or statements for each question. Each answer to a question was thus awarded a maximum of 3 points. These key ideas for the above example were: (a) seawater consists of sodium and chloride ions dissolved in water (= saltwater), (b) water molecules are attracted by sodium and chloride ions and surround them (hydrate-sheath, hydration), (c) (because of the hydration/hydrate-sheath), water molecules are hindered from attaching to one another, that is, from forming hydrogen bonds (forming six-sided rings) as they would otherwise do. Students’ answers were scored by two raters with an acceptable inter-rater agreement of kappa = .90. A point was given when the student’s answer expressed the meaning of the key idea, irrespective of the wording. Disagreements were settled by consensus.
The visualization test was constructed to assess whether students mentally generated visual-spatial representations of to-be-learned content. On the visualization test, students were asked to draw pictures representing key concepts of the text and their spatial relations, for example, the hydrogen bonds of water molecules, hydrated sodium, and chloride ions, etc. (Cronbach’s alpha = .73). Students were handed a sheet of paper with nine key concepts and extra space provided for the drawing of each concept. Drawing accuracy was analyzed with respect to nine expert reference visualizations (e.g.,
Hall et al., 1997, Van Meter, 2001). Expert visualizations were independently constructed by a science teacher and the first author. The experts discussed and resolved any
differences in their visualizations to produce one reference visualization for each of the nine key concepts. These expert visualizations served as references when scoring
students’ drawings. Students’ drawings were also scored according to a checklist that specified two or three features that must be depicted in order to score the particular student’s picture as accurate (2 points), partly accurate (1 point), or not acceptable (0 points). These features of the checklist referred to whether relevant components (objects or structures) were depicted and to what extent these components were accurately related to each other in terms of space (see Leopold, 2009). We awarded a drawing 2 points when all of the two or three features of the particular checklist were depicted and 1 point when at least one feature of a 2-point checklist or two features of a 3-point
checklist were depicted. As each drawing was scored with maximal 2 points, the scores could range from 0 to 18. Students’ sketches were scored by two raters with an
acceptable inter-rater agreement of kappa = .93. Disagreements were settled by consensus.
A self-report scale was developed for checking whether students processed the text thoroughly. After reading the science text, students were asked to rate, on a 4-point scale ranging from completely agreeing to completely disagreeing, whether they invested effort in comprehending the text (5 items: Cronbach’s alpha = .64). The questionnaire was headed with the question: “How did you proceed in studying the text?” Sample items were: “I tried to (do my very best to) understand the text,” “I stopped reading the text carefully” (reversed), “When reading I was satisfied to get a rough idea of what the text was about” (reversed).
Verbal ability was measured with the word fluency scale of a standard intelligence test (Heller & Perleth, 2000) and used as a control variable. In addition to verbal ability, spatial ability was measured using the paper-folding test (Ekstrom, French, Harman, & Dermen, 1976) because the effectiveness of mental imagery (Denis, 2008) and external pictures (Höffler, 2010) has been found to vary with respect to students’ spatial abilities.
2.1.3. Procedure
The experiment was conducted in classrooms at the school. First, students were
randomly assigned to the four treatment groups. They were asked to take the pretest for assessing their prior knowledge about water molecules and chemical bonds (5 min). Thereafter, the students received the science text along with a booklet that was prepared according to the particular experimental treatment condition. On the first page of the booklet, students were given an example showing how to process the text. The example contained a paragraph on blood circulation and—depending on the experimental condition—a related sketch, main ideas, or a related sketch with main ideas. The experimenter guided the students through the example and encouraged them not to hesitate to ask her/him when there was anything they did not understand. Students could go back and look at the instructional sheet whenever they wished.
The no-strategy group received the science text without a booklet. Students in the
strategy conditions were given two-step instructions. Students in the main idea selection group were instructed to comprehend the text by first reading a text paragraph and second, by writing down the most important concepts of the paragraph. They were informed that selecting important concepts representing the main ideas of the text would help them to better understand the text. Students were asked to write down their concepts in the spaces provided in the booklet, indicated by the corresponding number of the paragraph. Students in the drawing-strategy group were instructed to
representing the main ideas of the paragraph. They were informed that their drawings would help them to better understand the text. Students were asked to draw their sketches in the spaces provided in the booklet. Students in the both-strategies group were instructed to comprehend the text by first reading a text paragraph and second, by drawing a sketch to represent the important information in the paragraph and writing down the important concepts of the paragraph in the drawing. Students in the no-strategy group were instructed only to read the text for comprehension. All students were aware that they would be tested on their understanding. They were given 35 min to study the science text on water molecules, and thereafter, the text and the booklets were collected. Students were then given the self-report questionnaire to be completed at their own pace. Afterwards, they took the verbal (7 min) and spatial (3 min) ability tests. Students were then given 10 min to answer the multiple-select comprehension posttest, 15 min to answer the transfer test, and finally, 10 min to answer the visualization test.
2.2. Results
2.2.1. Preliminary analyses
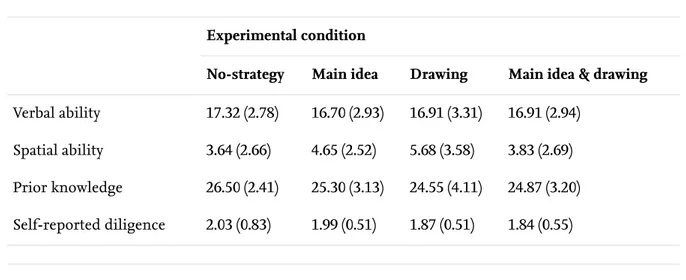
Before testing the hypotheses, we analyzed whether the four experimental groups differed in verbal ability, spatial ability, and prior knowledge. No between-groups differences were found for verbal ability, F(3, 86) < 1, spatial ability, F(3, 86) = 2.31, p = .082, and prior knowledge, F(3, 86) = 1.52, p = .216. Furthermore, we examined whether students were diligent in processing the text as indicated in their self-reports, and found no differences between the experimental groups, F(3, 86) < 1 (see Table 1 for means and standard deviations). To make sure the students followed the particular instructions, we analyzed the artifacts the students generated when studying the text. We counted the number of topics for which students generated drawings and main ideas. A point was awarded when the drawing or the main ideas referred to the content of the respective topic, regardless of their quality. With regard to the drawings, 21 of 22 students in the drawing group visualized at least six topics, and one student five topics. In the both-strategies group, 21 of 23 students visualized at least six topics, one student five topics, and one student four topics. All students in the main idea selection group generated main ideas for at least six topics, and 19 of 23 students in the both-strategies group generated main ideas for at least six topics, three students for five topics, and one student for four topics. To check whether students had sufficient time to complete drawing and main idea selection we also computed how many students did not
complete the drawing or the main ideas for the last topic. There were two of 22 students in the drawing group and two of 23 students in the both-strategies group who did not generate the drawing for the last topic. There was one of 22 students in the drawing group and there was one of 23 students in the both-strategies group who did not generate the main ideas for the last topic. These results indicate that students had enough time to follow the instructions.
Table 1. Means (standard deviations) of control variables in Experiment 1. Verbal ability 17.32 (2.78) 16.70 (2.93) 16.91 (3.31) 16.91 (2.94) Spatial ability 3.64 (2.66) 4.65 (2.52) 5.68 (3.58) 3.83 (2.69) Prior knowledge 26.50 (2.41) 25.30 (3.13) 24.55 (4.11) 24.87 (3.20) Self-reported diligence 2.03 (0.83) 1.99 (0.51) 1.87 (0.51) 1.84 (0.55)
2.2.2. Text comprehension
To test the hypothesis that learning by visualizing text content is superior to learning by verbalizing text content or having no specific strategy instructions, we computed
2 × 2-factorial ANCOVAs with the multiple-select scores and transfer scores as dependent variables, respectively. Prior knowledge was used as a covariate.
Concerning the multiple-select posttest, students who learned with the drawing strategy performed better than students who did not learn with the drawing strategy, F(1,
85) = 6.47, p = .013, MSE = 41.87, η = .07. Conversely, students who learned with the main idea selection strategy performed worse than students who did not learn with the main idea selection strategy, F(1, 85) = 4.02, p = .048, η = .05 (see Fig. 2). Students recognized more correct inferences when they were asked to generate pictures (M = 45.58, SD = 6.57) than when they were not asked to generate pictures (M = 43.02, SD = 7.56). Students recognized fewer correct inferences when they were asked to select the main ideas (M = 42.80, SD = 6.66) than when they were not asked to select the main ideas (M = 45.86, SD = 7.41). The statistical interaction of drawing strategy and main idea selection
strategy was not statistically significant, F(1, 85) < 1. The covariate significantly
contributed to the comprehension score, F(1, 85) = 13.19, p < .001, η = .13, and did not interact with the independent variables. As it could not be ruled out that these effects were moderated by spatial ability (see the small but nonsignificant between-groups difference in spatial ability), we conducted an analysis of covariance with prior
knowledge and spatial ability as covariates. Results showed that the main effect of the drawing strategy remained significant, F(1, 84) = 5.77, p = .019, and the effect of the main idea strategy decreased marginally, F(1, 84) = 3.55, p = .063.
Experimental condition
No-strategy Main idea Drawing Main idea & drawing
2
2
Download : Download full-size image
Fig. 2. Mean multiple-select and transfer test performance, adjusted for prior knowledge, as a function of the drawing and main idea selection instruction.
Planned linear contrasts (Jaccard, 1998) revealed that the difference between the drawing group and the no-strategy group was not statistically significant, t(85) = 1.37, p = .175; however, the drawing group exceeded the main idea selection group, t(85) = 3.21, p = .002. The no-strategy group and the main idea selection group did not differ significantly from each other, t(85) = 1.83, p = .071. The drawing group did not exceed the both-strategies group (drawing + main idea selection), t(85) < 1 (see Table 2 for means and adjusted means).
Table 2. Means (standard deviations) and adjusted means of multiple-select transfer, and visualization test performance in Experiment 1.
Multiple-select test 45.32 (7.84) 40.83 (6.74) 46.41 (7.09) 44.78 (6.09) Multiple-select test 44.35 40.82 47.02 45.13 Transfer test 3.32 (3.40) 1.70 (1.49) 4.32 (2.80) 2.22 (1.28) Transfer test 2.97 1.69 4.54 2.34 Visualization test 4.59 (4.14) 3.09 (2.79) 8.18 (5.22) 7.35 (2.66) a Experimental condition
No-strategy Main idea Drawing Main idea & drawing
a
Adjusted for prior knowledge.
Concerning the transfer test, results were generally comparable to the multiple-select test results, but were more conspicuous. We found a positive main effect of the drawing strategy, F(1, 85) = 5.55, p = .021, MSE = 4.86, η = .06, and a negative main effect of the main idea selection strategy, F(1, 85) = 13.90, p < .001, η = .14 (see Fig. 2). Students generated more transfer solutions when they were instructed to generate pictures (M = 3.24, SD = 2.39) than when they were not instructed to generate pictures (M = 2.49, SD = 2.70); students generated fewer transfer solutions when they were instructed to select main ideas (M = 1.96, SD = 1.40) than when they were not instructed to select main ideas (M = 3.82, SD = 3.12). The statistical interaction of drawing and main idea selection was not statistically significant, F(1, 85) < 1. The covariate significantly contributed to the transfer score, F(1, 85) = 14.81, p < .001, η = .15, and did not interact with the
independent variables. An analysis of covariance with prior knowledge and spatial ability as covariates did not alter these effects. Planned linear contrasts revealed that the
drawing group outperformed the no-strategy group, t(85) = 2.36, p = .020, the main idea selection group, t(85) = 4.34, p < .001, and the both-strategies group, t(85) = 3.35, p = .001. The difference between the no-strategy group and the main idea selection group was marginally significant, t(85) = 1.95, p = .055. There is thus evidence that visualizing the to-be-learned content resulted in deeper learning than verbalizing, whereas verbalizing may actually have hindered deeper understanding of text content (see Table 2 for means and adjusted means).
2.2.3. Visualization test
Concerning the visualization test in which students were asked to depict important text concepts, the drawing strategy did—as expected—improve performance (M = 7.76, SD = 4.09; M = 3.82, SD = 3.56), F(1, 86) = 38.72, p < .001, MSE = 11.70, η = .31, whereas the main idea selection strategy did not affect visualization test scores (M
= 5.22, SD = 3.45; M = 6.39, SD = 4.99), F(1, 86) = 1.88, p = .174. The statistical interaction of drawing and main idea selection was not statistically significant, F(1, 86) < 1. Planned linear contrasts revealed that the drawing group outperformed both the no-strategy group, t(86) = 3.11, p = .003, and the main idea selection group, t(86) = 4.47, p < .001. The no-strategy group and the main idea group did not differ from each other, t(86) = 1.32, p = .191; neither did the drawing group and the both-strategies group, t(86) < 1.
2.2.4. Mediator analysis
The present results suggest that the positive effect of drawing activity on learning performance was caused by the drawing strategy fostering students’ spatial
representations of the learning content (assessed by the visualization test). Hence, students’ spatial representations may have mediated the positive effects of the drawing
2 2 2 drawing no drawing 2 main
strategy on transfer test performance. To test this hypothesis, we conducted an analysis of covariance with drawing strategy and main idea selection strategy as factorial
independent variables and prior knowledge and visualization test performance as
covariates. The dependent variable was transfer test performance. If the quality of spatial representations of learning content is a mediator, the effect of the drawing strategy instructions should be substantially reduced, whereas the mediator should remain significant (Baron & Kenny, 1986). As expected, the effect of drawing strategy no longer reached statistical significance, F(1, 84) < 1, whereas the impact of visualization test performance was clearly significant, F(1, 84) = 31.15, p < .001, η = .27. However, the effect of the main idea selection strategy was not influenced by visualization test performance, F(1, 84) = 11.97, p = .001, η = .13. Thus, there is evidence that students’ spatial
representations of learning content mediated the influence of the visualization strategy on learning performance.
2.3. Discussion
The positive effect of drawing activity on text comprehension is consistent with the prediction that drawing activity rather than main idea selection or no specific strategy instructions encourages students to construct mental models of to-be-learned content and consequently facilitates deeper understanding (Van Meter & Garner, 2005). This interpretation is supported by the findings that students’ spatial representations of to-be-learned content mediated the impact of the drawing strategy but not the impact of main idea selection strategy on transfer performance. These results indicate that asking students to generate drawings with features structurally analogous to the ones of the objects described in the text helped students to construct coherent mental
representations of these objects and their relations. In addition, the finding that the drawing group surpassed the no-strategy group on the transfer test but not on the multiple-select test is consistent with evidence from other studies showing that the benefits of drawing activity were greater the more the assessments were sensitive to higher levels of comprehension (Hall et al., 1997, Van Meter, 2001, Van Meter et al., 2006).
Obviously, the text-focused strategy negatively affected comprehension, with this effect being more pronounced on the transfer test than on the multiple-select test. One
explanation that may account for the negative effect of the main idea selection strategy is that the strategy drew students’ attentions more toward processing the text itself than toward the content described by the text (McNamara et al., 2007). By contrast, the no-strategy group was not biased in focusing on either the propositional structure or the structure of the molecules described in the text.
However, there are alternative explanations that may also account for the results. The text-focused strategy investigated in the present experiment encouraged students to select relevant concepts of the text. This strategy may have prompted students to
2
concentrate only on isolated concepts and not to pay attention to relations and
associations between them, thereby promoting superficial processing rather than deeper processing. To address this issue, we conducted a second experiment and modified the text-focused strategy used in Experiment 1 by asking students to write short summaries of each paragraph.
3. Experiment 2
The purpose of Experiment 2 was to examine whether the pattern of results obtained in Experiment 1 could be replicated with a different text-focused strategy. The verbal selection strategy of Experiment 1 was replaced by a verbal summarization strategy that was assumed to foster the construction of a coherent verbal representation to a greater extent than main idea selection. When summarizing, students are required not only to select but also to connect relevant information, thereby providing a structure for organizing the text (Kintsch et al., 2007, Mannes and Kintsch, 1987). We expected students who learn with the drawing strategy to perform better in comprehension and transfer questions than students who learn with the summarization strategy or with no-specific strategy (Hypothesis 1). We also expected students who learn with the drawing strategy to better visualize spatial relations of text-related concepts than students who learn with the summarization strategy or with no-specific strategy (Hypothesis 2).
3.1. Method
3.1.1. Participants and design
Seventy-one German students in grade 10 from two high-track secondary schools participated in the experiment. The mean age was 16.1 years (SD = 0.92), and the percentage of female students was 42.9%. All students attended regular chemistry lessons at school. The experiment was based on a 2 × 2-factorial between-subjects design, with the experimental factors “drawing strategy instructions” (yes vs. no) and “summarizing strategy instructions” (yes vs. no). The experimental design was the same as in Experiment 1 except that the main idea selection strategy was replaced by the summarizing strategy. Within classes, students were randomly assigned to one of the four experimental groups. Sixteen students served in the no-strategy group, 17 students in the summary group, 20 students in the drawing group, and 18 students in the both-strategies group.
3.1.2. Materials
The science text, the tests, the self-report scale, and the covariates were the same as used in Experiment 1. The booklets for the drawing, summary and both-strategies groups were identical to the materials used in Experiment 1, except that the verbalization instructions in the booklet required students to write short summaries of each
paragraph.
3.1.3. Procedure
The procedure was similar to that used in Experiment 1. Students in the summary group were instructed to comprehend the text by reading a text paragraph and writing down a short summary of the paragraph. They were informed that their summary
should represent the most important content and should be clear and simple in order to help them to better understand the text. Students were asked to write down their
summaries in the spaces provided in the booklet. Students in the both-strategies group were instructed to comprehend the text by reading a text paragraph, drawing a sketch to represent the content of the paragraph, and writing summary sentences on the drawing. They were informed that their drawings and summaries should represent the most important information and should be clear and simple in order to help them to better understand the text.
3.2. Results
3.2.1. Preliminary analyses
Before testing the hypotheses, we examined whether the four experimental groups differed in verbal ability, spatial ability, and prior knowledge. No between-groups differences were found for verbal ability, F(3, 67) < 1, and spatial ability, F(3, 67) = 1.62, p = .193. There seemed to be a (nonsignificant) tendency of lower prior knowledge in the both-strategies group, F(3, 67) = 2.71, p = .052. Furthermore, we examined whether
students were diligent in processing the text as indicated in their self-reports, and found no differences between the experimental groups, F(3, 67) < 1 (see Table 3 for means and standard deviations). To examine whether the students followed the instructions, we analyzed the artifacts the students generated when studying the text. With regard to the drawings, 19 of 20 students in the drawing group visualized at least six topics. In the both-strategies group, 8 of 18 students visualized at least six topics and 15 of 18 students at least five topics. With regard to the summaries, 16 of 17 students of the summary group generated summaries for at least six topics, and 10 of 18 students of the both-strategies group for at least six topics and 16 of 18 for at least five topics. Thus, the results indicate that students followed the instructions and generated drawings and/or summaries for the respective topics. However, on average students in the both-strategies group generated one drawing less than the drawing group did.
Verbal ability 17.31 (2.68) 16.71 (3.41) 16.70 (3.61) 15.72 (3.41)
Spatial ability 5.69 (3.88) 4.47 (2.98) 4.10 (3.78) 3.28 (1.90)
Prior knowledge 28.06 (3.47) 26.41 (3.24) 28.00 (2.92) 25.50 (3.29)
Self-reported diligence 1.73 (0.47) 1.64 (0.43) 1.58 (0.41) 1.80 (0.46)
3.2.2. Text comprehension
Two 2 × 2-factorial ANCOVAs were computed to examine the impact of the drawing and the summarization instructions on learning outcomes. As in Experiment 1, prior
knowledge was used as a covariate.
Concerning the multiple-select test, the drawing strategy did not affect text
comprehension, F(1, 66) < 1. However, as in Experiment 1, students who learned with the focused strategy performed worse than students who did not learn with the text-focused strategy, F(1, 66) = 4.30, p = .042, MSE = 28.85, η = .06 (see Fig. 3). The statistical interaction of drawing strategy and summarization strategy was not statistically
significant, F(1, 66) < 1. The covariate significantly contributed to the comprehension score, F(1, 66) = 12.77, p = .001, η = .16, and did not interact with the independent variables. Planned linear contrasts revealed that the differences between the drawing group and the no-strategy group, t(66) < 1, and between the drawing group and the summary group, t(66) = 1.34, p = .092 (one-tailed), were not statistically significant. The no-strategy group and the summary group did not significantly differ from each other, t(66) < 1 (see Table 4 for means and adjusted means).
Download : Download full-size image
Experimental condition
No-strategy Summary Drawing Summary & drawing
2
Fig. 3. Mean multiple-select and transfer test performance, adjusted for prior knowledge, as a function of the drawing and summarization instruction.
Table 4. Means (standard deviations) and adjusted means of dependent variables in Experiment 2. Multiple-select test 49.56 (5.74) 47.12 (6.51) 50.35 (5.14) 45.06 (5.03) Multiple-select test 48.99 47.43 49.81 45.86 Transfer test 3.56 (2.83) 2.53 (2.45) 5.65 (3.25) 2.56 (2.33) Transfer test 3.19 2.74 5.30 3.09 Visualization test 6.56 (4.21) 4.24 (3.68) 9.35 (4.17) 5.56 (3.45) a
Adjusted for prior knowledge.
Concerning the transfer test, we found a positive main effect of the drawing strategy, F(1, 66) = 4.83, p = .031, MSE = 6.39, η = .07, and a negative main effect of the summary
strategy, F(1, 66) = 4.67, p = .034, η = .07 (see Fig. 3). Students generated more transfer problem solutions when they were asked to draw pictures (M = 4.18, SD = 3.22) than when they were not asked to generate pictures (M = 3.03, SD = 2.65). Conversely, students generated fewer transfer problem solutions when they were asked to summarize text paragraphs (M = 2.54, SD = 2.36) than when they were not asked to summarize (M = 4.72, SD = 3.20). The interaction of drawing and summary strategy was not statistically
significant, F(1, 66) = 2.13, p = .149. The covariate significantly contributed to the transfer score, F(1, 66) = 21.33, p < .001, η = .24, and did not interact with the independent
variables. Planned linear contrasts revealed that the drawing group—as in Experiment 1—outperformed the no-strategy group, t(66) = 2.49, p = .015, the summary group, t(66) = 3.07, p = .003, and the both-strategies group, t(66) = 2.69, p = .009. The difference between the no-strategy group and the summary group was not significant, t(66) < 1. In accordance with Experiment 1, there was evidence that the instructions to visualize the to-be-learned content resulted in deeper learning than no specific strategy instructions or instructions to verbalize the text content (see Table 4 for means and adjusted means).
Experimental condition
No-strategy Summary Drawing Summary & drawing
a
a
2 2
3.2.3. Visualization test
Concerning the visualization test in which students were asked to depict important text concepts, the drawing strategy, as expected, did improve performance (M = 7.55, SD = 4.25; M = 5.36, SD = 4.06), F(1, 67) = 5.58, p = .021, MSE = 15.16, η = .08, whereas the summarization strategy was detrimental (M = 4.91, SD = 3.58; M
= 8.11, SD = 4.36), F(1, 67) = 11.31, p = .002, η = .14. The interaction of drawing and summarization strategy was not statistically significant, F(1, 67) < 1. Linear contrasts revealed that the drawing group outperformed the no-strategy group, t(67) = 2.13, p = .036, the summary group, t(67) = 3.98, p < .001, and the both-strategies group,
t(67) = 3.00, p = .004. The no-strategy group and the summary group did not differ from each other, t(67) = 1.72, p = .091.
3.2.4. Mediator analysis
As in Experiment 1, we tested whether the students’ spatial representations, assessed by the visualization test, mediated the positive effects of the drawing strategy on transfer test performance. An analysis of covariance was computed with drawing strategy and summarization strategy as factorial independent variables and prior knowledge and visualization test performance as covariates. The dependent variable was transfer test performance. If the quality of spatial representations is a mediator, the effect of the drawing strategy instructions on transfer test performance should be substantially reduced whereas the mediator should remain significant (Baron & Kenny, 1986). As expected, with the prior knowledge and visualization test scores as covariates, the effect of drawing strategy no longer reached statistical significance, F(1, 65) < 1, whereas the impact of visualization test performance was significant, F(1, 65) = 36.09, p < .001, η = .36. Interestingly, the detrimental effect of the summarization strategy was substantially reduced as well, F(1, 65) = 1.06, p = .307. These results suggest that students’ spatial representations of learning content mediated the positive influence of the drawing strategy and the detrimental effect of the summarization strategy on learning performance.
3.3. Discussion
The results are consistent with the prediction that drawing activity rather than summarization activity helped students to create a deep understanding of the text’s content. The drawing strategy supported the performance in answering transfer
questions, whereas the detrimental effect of the summarization strategy was significant on multiple-select and transfer performance. One explanation for these results is that transfer questions may have required learners to a greater extent to access their internal spatial representations of the learning content. Results of the mediator analysis support the idea that the drawing effect can be attributed to the students’ spatial representations of the content to be learned. Please note that the detrimental effect of the
summarization strategy was also mediated by students’ spatial representations of
to-be-drawing
no drawing 2
summary no
summary 2
learned content, indicating that the summarization strategy may actually have hindered students from forming spatial representations of to-be-learned content. However, we suggest that this effect—with regard to the both-strategies condition—is to be
interpreted with caution because this group was asked to perform both strategies and may have needed slightly more time for completing both strategies.
In line with Experiment 1, the results suggest that asking students to generate pictures versus summaries helps learners to construct coherent mental models of the objects referred to in the text.
4. General discussion
The present experiments extend the findings from earlier research on the differential effectiveness of text-focused (main idea selection, summarization) and model-focused (drawing) strategies in science text learning (e.g., Alesandrini, 1981, McNamara et al., 2007). In the two experiments reported in the present paper, drawing activity increased students’ comprehension, as reflected by their ability to transfer the acquired knowledge to new situations. By contrast, both text-focused strategies—main idea selection
(Experiment 1) and summarization (Experiment 2)—consistently decreased transfer performance relative to the groups who did not receive the text-focused strategy
instructions. The results of both experiments thus confirm the hypothesis that students better understand a scientific text when asked to visualize to-be-learned content instead of engaging in text-focused processing or receiving no specific instructions on how to study the text (Hypothesis 1). The positive effect of generating drawings compared to the no-strategy condition was consistent with earlier research on the benefits of the drawing strategy (Hall et al., 1997, Schwamborn et al., 2010, Van Meter and Garner, 2005).
Moreover, our results indicate that generating drawings improved understanding also in comparison with both text-focused strategies examined (Alesandrini, 1981). The present study thus extends previous work by demonstrating the effectiveness of the drawing strategy in comparison to both no specific strategy instructions on the one hand and main idea and summarization instructions on the other hand.
With regard to the representational level affected by the particular strategy, the drawing strategy appears to be a useful strategy in fostering mental model building with respect to the representation of spatial relations. In line with that, the drawing instructions improved students’ spatial representations of to-be-learned content assessed by the visualization test (Hypothesis 2). A related effect of drawing activity on the quality of students’ spatial representations of to-be-learned content was reported by Schwamborn et al. (2010).
By contrast, the text-focused strategies either did not significantly affect (main idea selection in Experiment 1) or actually negatively affected (summarization in Experiment 2) these spatial representations. Accordingly, mediator analyses revealed that the effect of
the drawing strategy (but not that of the main idea selection strategy) on transfer scores was mediated by the quality of students’ spatial representations in Experiment 1,
whereas both effects were mediated by students’ spatial representations in Experiment 2. Obviously, strategic processing affects not only comprehension in general but also the representation of the learning content.
These results suggest that students in the main idea and summarization conditions did not invest sufficient effort in constructing spatial representations of contents that were to be learned. One explanation could be that these strategies focused students’
attentions on text-based processing, thereby leaving fewer resources for processes aimed at the construction of mental models. A reason as to why this was particularly evident for the summarizing condition may be that students engaged themselves more
intensively in text-focused processing when writing summaries than when writing down main ideas.
Consistent with this interpretation is the finding that adding the main idea selection or summarization strategy to the drawing strategy in the both-strategies conditions
resulted in a decrease of transfer scores compared to the pure drawing strategy use. Although the drawing strategy may direct students’ processing on mental model
construction when used concurrently with the particular focused strategy, the text-focused strategy may switch attention toward the propositional text base in terms of text-based-level processing, and therefore, it may actually hinder deeper understanding. Thus, the benefits that could be achieved by using the model-focused strategy are to some extent undone by the text-focused strategy, which draws students’ attentions more toward shallow text-based-level processing. One may argue that the results can be attributed to the students’ lack of time to apply both strategies, whereas the drawing group accomplished only one strategy. However, the argument does not seem to account for the present results because a negative effect, even for the pure text-focused strategy (compared to the drawing strategy), was observed.
In summary, our results support the idea that processes of meaning construction and representation vary depending on the learners’ strategies (Graesser et al., 1994,
McNamara et al., 2007). The drawing strategy in particular helped learners to construct a representation that goes beyond the text, whereas the main idea and summarization strategy may have drawn learners’ attentions toward the information explicitly stated in the text (McNamara et al., 2007). Students in the no-strategy group were not biased by focusing specifically on either the propositional structure of the text or on mental model construction.
Our results are generally in line with theories of multimedia learning (Mayer, 2009,
Schnotz and Bannert, 2003). Students are expected to benefit from pictures
accompanying a text because text- and picture-related representations are seen as qualitatively different and as complementing each other. Although in the context of
multimedia learning, strategic processes were primarily examined with text and presented pictures, they may be particularly fostered when pictures are constructed by the readers themselves. When students are asked to draw the spatial structures described in the text, this strategy introduces a visual-spatial component in addition to the verbal code from the text, and comprehension may benefit from a representation based on “dual codes” (Paivio, 1986).
Some limitations of the experiments should be addressed. Both experiments were focused on fostering science text comprehension. Therefore, the text was explanative in nature and focused on complex spatial relations between functional components. Results are thus limited to these contents and kinds of texts; therefore, we cannot rule out that patterns of results may change with other text genres such as descriptive texts. Furthermore, it should be noted that in the present study, text comprehension in terms of higher level comprehension was measured. Verbal selection and summarization may thus prove to be beneficial with respect to fostering retention and recall, which were not investigated in this study (Foos, 1995, Wittrock and Alesandrini, 1990). Including a measure that focuses on text-based processing in future studies will help to make an important contribution to this research in terms of more differential effects of model-focused and text-model-focused strategies.
It should also be considered that students were asked to study the science text within a limited period of 35 min during their regular school lessons. With regard to Experiment 2, extending this time limit should be considered in order to provide the students with more time to perform the strategies in the both-strategies condition. However, we do not expect the pattern of results to change substantially as the pure summary condition performed worse than the drawing condition, even though students had enough time to apply the strategies. Finally, a homogeneous sample of students with a limited age range participated in the study. Further research is required to replicate the pattern of results with respect to other age groups.
In sum, our results suggest not only that researchers should consider more specifically how learning strategies affect processes of coherence building, but also that they should consider the type of text, in particular the structure of the content examined. When texts are used that describe spatial relationships between objects, selection of main ideas and summarization may direct attention to the text itself and thus may not prove as
beneficial. Although we focused on these kinds of texts, there is evidence that readers use spatial representations in order to visualize relations other than spatial
relationships. They relate, for example, temporal sequences of events spatially on a left-to-right axis (Schaeken, Johnson-Laird, & d’Ydewalle, 1996). Thus, the benefits of
visualizations may not be limited to spatial relationships. On the practical side, the results demonstrate the specific value of drawing activities for visualizing to-be-learned content and for improving science text comprehension.
Alesandrini, 1981
Baron and Kenny, 1986
Dean and Kulhavy, 1981
Denis, 2008
Ekstrom et al., 1976
Foos, 1995
Acknowledgments
The present publication is based on research projects funded by the German Research Foundation (DFG; LE 645/9-1 as part of FOR 511). We thank Stephan Dutke for helpful comments on earlier versions of this manuscript.
Recommended articles Citing articles (76)
References
K.L. Alesandrini
Pictorial-verbal and analytic-holistic learning strategies in science learning Journal of Educational Psychology, 73 (1981), pp. 358-368,
10.1037/0022-0663.73.3.358
View Record in Scopus Google Scholar
R.M. Baron, D.A. Kenny
The moderator-mediator variable distinction in social psychological research: conceptual, strategic and statistical considerations
Journal of Personality and Social Psychology, 51 (1986), pp. 1173-1182,
10.1037/0022-3514.51.6.1173
View Record in Scopus Google Scholar
R.S. Dean, R.W. Kulhavy
Influence of spatial organization in prose learning
Journal of Educational Psychology, 73 (1981), pp. 57-64, 10.1037/0022-0663.73.1.57 View Record in Scopus Google Scholar
M. Denis
Assessing the symbolic distance effect in mental images constructed from verbal descriptions: a study of individual differences in the mental comparison of distances
Acta Psychologica, 127 (2008), pp. 197-210, 10.1016/j.actpsy.2007.05.006
Article Download PDF View Record in Scopus Google Scholar
R.B. Ekstrom, J.W. French, H.H. Harman, D. Dermen Manual for kit of factor-referenced cognitive tests
Educational Testing Service, Princeton, NJ (1976)
Google Scholar
P.W. Foos
The effect of variations in text summarization opportunities on test performance Journal of Experimental Education, 63 (1995), pp. 89-95,
Glenberg et al., 2004 Glenberg et al., 1987 Graesser et al., 1997 Graesser et al., 1994 Höffler, 2010 Hall et al., 1997
Heller and Perleth, 2000
CrossRef View Record in Scopus Google Scholar
A.M. Glenberg, T. Gutierrez, J.R. Levin, S. Japuntich, M.P. Kaschak Activity and imagined activity can enhance young children’s reading
comprehension
Journal of Educational Psychology, 96 (2004), pp. 424-436,
10.1037/0022-0663.96.3.424
View Record in Scopus Google Scholar
A.M. Glenberg, M. Meyer, K. Lindem
Mental models contribute to foregrounding during text comprehension Journal of Memory and Language, 26 (1987), pp. 69-83,
10.1016/0749-596X(87)90063-5
Article Download PDF View Record in Scopus Google Scholar
A.C. Graesser, K.K. Millis, R.A. Zwaan Discourse comprehension
Annual Review of Psychology, 48 (1997), pp. 163-189,
10.1146/annurev.psych.48.1.163
View Record in Scopus Google Scholar
A.C. Graesser, M. Singer, T. Trabasso
Constructing inferences during narrative text comprehension
Psychological Review, 101 (1994), pp. 371-395, 10.1037/0033-295X.101.3.371 CrossRef View Record in Scopus Google Scholar
T.N. Höffler
Spatial ability: its influence on learning with visualizations – a meta-analytic review
Educational Psychology Review, 22 (2010), pp. 245-269, 10.1007/s10648-010-9126-7 CrossRef View Record in Scopus Google Scholar
V.C. Hall, J. Bailey, C. Tillman
Can student-generated illustrations be worth ten thousand words? Journal of Educational Psychology, 89 (1997), pp. 667-681,
10.1037/0022-0663.89.4.677
CrossRef View Record in Scopus Google Scholar
K.A. Heller, C. Perleth
Kognitiver Fähigkeitstest für 4.-12. Klassen, Revision [Cognitive ability test for grades 4–12, revised version]
Hogrefe, Göttingen, Germany (2000)
Jaccard, 1998 Johnson-Glenberg, 2000 Johnson-Laird, 1983 Kintsch, 1998 Kintsch et al., 2007 Kulhavy et al., 1985
Larkin and Simon, 1987
Leopold, 2009
J. Jaccard
Interaction effects in factorial analysis of variance Sage, Thousand Oaks, CA (1998)
Google Scholar
M.S. Johnson-Glenberg
Training reading comprehension in adequate decoders/poor comprehenders: verbal versus visual strategies
Journal of Educational Psychology, 92 (2000), pp. 772-782,
10.1037/0022-0663.92.4.772
View Record in Scopus Google Scholar
P.N. Johnson-Laird Mental models
Harvard University Press, Cambridge, MA (1983)
Google Scholar
W. Kintsch
Comprehension: A paradigm for cognition
Cambridge University Press, Cambridge, England (1998)
Google Scholar
E. Kintsch, D. Caccamise, M. Franzke, N. Johnson, S. Dooley Summary street: Computer-guided summary writing
T.K. Landauer, D.S. McNamara, S. Dennis, W. Kintsch (Eds.), Handbook of latent semantic analysis, Erlbaum, Mahwah, NJ (2007), pp. 263-277
View Record in Scopus Google Scholar
R.W. Kulhavy, J.B. Lee, L.C. Caterino Conjoint retention of maps and related discourse
Contemporary Educational Psychology, 10 (1985), pp. 28-37,
10.1016/0361-476X(85)90003-7
Article Download PDF View Record in Scopus Google Scholar
J.H. Larkin, H.A. Simon
Why a diagram is (sometimes) worth ten thousand words Cognitive Science, 11 (1987), pp. 65-99
View Record in Scopus Google Scholar
C. Leopold
Lernstrategien und Textverstehen [Learning strategies for text comprehension] Waxmann, Münster (2009)
Leopold et al., 2007
Lesgold et al., 1975
Leutner et al., 2009
Magliano et al., 1999
Mannes and Kintsch, 1987
Marton and Säljö, 1997
Mayer, 1996
Mayer, 2009
C. Leopold, V. den Elzen-Rump, D. Leutner Self-regulated learning from science texts
M. Prenzel (Ed.), Studies on the educational quality of schools: The final report on the DFG Priority Program, Waxmann, Münster (2007), pp. 221-238
Google Scholar
A. Lesgold, C. McCormick, R. Golinkoff Imagery training and children’s prose learning
Journal of Educational Psychology, 67 (1975), pp. 663-667,
10.1037/0022-0663.67.5.663
View Record in Scopus Google Scholar
D. Leutner, C. Leopold, E. Sumfleth
Cognitive load and science text comprehension: effects of drawing and mentally imagining text content
Computers in Human Behavior, 25 (2009), pp. 284-289, 10.1016/j.chb.2008.12.010
Article Download PDF View Record in Scopus Google Scholar
J.P. Magliano, T. Trabasso, A.C. Graesser Strategic processing during comprehension
Journal of Educational Psychology, 91 (1999), pp. 615-625,
10.1037/0022-0663.91.4.615
View Record in Scopus Google Scholar
S.M. Mannes, W. Kintsch Knowledge organization and text organization
Cognition and Instruction, 4 (1987), pp. 91-115, 10.1207/s1532690xci0402_2 CrossRef View Record in Scopus Google Scholar
F. Marton, R. Säljö Approaches to learning
F. Marton, D. Hounsell, N. Entwistle (Eds.), The experience of learning, Scottish Academic Press, Edinburgh (1997), pp. 39-58
View Record in Scopus Google Scholar
R.E. Mayer
Learning strategies for making sense out of expository text: the SOI model for guiding three cognitive processes in knowledge construction
Educational Psychology Review, 8 (1996), pp. 357-371, 10.1007/BF01463939 View Record in Scopus Google Scholar
R.E. Mayer Multimedia learning
Mayer and Cook, 1981
McNamara et al., 2007
Ozuro et al., 2009
Paivio, 1986
Perrig and Kintsch, 1985
Pressley and Harris, 2006
Schaeken and Johnson-Laird, 1996
Schmalhofer and Glavanov, 1986 Google Scholar
R.E. Mayer, L.B. Cook
Effects of shadowing on prose comprehension and problem solving Memory and Cognition, 8 (1981), pp. 101-109, 10.3758/BF03196955 View Record in Scopus Google Scholar
D.S. McNamara, Y. Ozuru, R. Best, T. O’Reilly The 4-pronged comprehension strategy framework
D.S. McNamara (Ed.), Reading comprehension strategies, Erlbaum, New York (2007), pp. 465-496
View Record in Scopus Google Scholar
Y. Ozuro, K. Dempsy, D.S. McNamara
Prior knowledge, reading skill, and text cohesion in the comprehension of science texts
Learning and Instruction, 19 (2009), pp. 228-242,
10.1016/j.learninstruc.2008.04.003 Google Scholar
A. Paivio
Mental representations: A dual-coding approach Oxford University Press, Oxford, England (1986)
Google Scholar
W. Perrig, W. Kintsch
Propositional and situational representations of text Journal of Memory and Language, 24 (1985), pp. 503-518,
10.1016/0749-596X(85)90042-7
Article Download PDF View Record in Scopus Google Scholar
M. Pressley, K.R. Harris
Cognitive strategy instruction: from basic research to classroom instruction P. Alexander, P. Winne (Eds.), Handbook of educational psychology (2nd ed), Academic Press, San Diego, CA (2006), pp. 265-286
Google Scholar
W. Schaeken, P.N. Johnson-Laird, G. d’Ydewalle Mental models and temporal reasoning
Cognition, 60 (1996), pp. 205-234, 10.1016/0010-0277(96)00708-1
Article Download PDF View Record in Scopus Google Scholar
F. Schmalhofer, D. Glavanov