HAL Id: hal-02011614
https://hal.archives-ouvertes.fr/hal-02011614
Submitted on 13 Nov 2019HAL is a multi-disciplinary open access archive for the deposit and dissemination of sci-entific research documents, whether they are pub-lished or not. The documents may come from teaching and research institutions in France or abroad, or from public or private research centers.
L’archive ouverte pluridisciplinaire HAL, est destinée au dépôt et à la diffusion de documents scientifiques de niveau recherche, publiés ou non, émanant des établissements d’enseignement et de recherche français ou étrangers, des laboratoires publics ou privés.
foveal and parafoveal word recognition
Jean-Baptiste Bernard, Eric Castet
To cite this version:
Jean-Baptiste Bernard, Eric Castet. The optimal use of non-optimal letter information in foveal and parafoveal word recognition. Vision Research, Elsevier, 2019, 155, pp.44-61. �10.1016/j.visres.2018.12.006�. �hal-02011614�
The optimal use of non-optimal letter information in foveal and parafoveal word recognition 1
2
01/01/2019 3
Jean-Baptiste Bernard1,2,3 and Eric Castet1,2
4
1Laboratoire de Psychologie Cognitive, Centre National de la Recherche Scientifique, UMR 7290
5
2Aix Marseille Université
6
3Brain and Language Research Institute
7 8 Corresponding author: 9 Jean-Baptiste Bernard, PhD 10
Laboratoire de Psychologie Cognitive 11
Bâtiment 9 Case D, 3, place Victor Hugo. 12 13331 Marseille Cedex 3 13 14 Email: bernard_jb@hotmail.com 15 16 17
Abstract 1
Letters and words across the visual field can be difficult to identify due to limiting visual factors such 2
as acuity, crowding and position uncertainty. Here, we show that when human readers identify 3
words presented at foveal and para-foveal locations, they act like theoretical observers making 4
optimal use of letter identity and letter position information independently extracted from each 5
letter after an unavoidable and non-optimal letter recognition guess. The novelty of our approach is 6
that we carefully considered foveal and parafoveal letter identity and position uncertainties by 7
measuring crowded letter recognition performance in five subjects without any word context 8
influence. Based on these behavioral measures, lexical access was simulated for each subject by an 9
observer making optimal use of each subject's uncertainties. This free-parameter model was able to 10
predict individual behavioral recognition rates of words presented at different positions across the 11
visual field. Importantly, the model was also able to predict individual mislocation and identity letter 12
errors made during behavioral word recognition. These results reinforce the view that human 13
readers recognize foveal and parafoveal words by parts (the word letters) in a first stage, 14
independently of word context. They also suggest a second step where letter identity and position 15
uncertainties are generated based on letter first guesses and positions. During the third lexical access 16
stage, identity and position uncertainties from each letter look remarkably combined together 17
through an optimal word recognition decision process. 18
INTRODUCTION 1
It only takes tens of milliseconds for humans to identify words, a combination of letters arranged in a 2
given order to form the essential language unit. Several decades of research suggested that visual 3
word recognition is preceded by a letter recognition step, which is itself preceded by the extraction 4
of letter visual features (see Carreiras, Armstrong, Perea, & Frost, 2014 for a recent review). 5
Identification of word sub-units such as syllables, graphemes or phonemes can also take place 6
between letter and word recognition (Balota, Yap, & Cortese, 2006). Given this cascade of processes, 7
an alteration of letter recognition performance can be critical for word recognition performance. This 8
is especially true for words presented outside the fovea where letter and thus word recognition 9
performance are strongly altered (Latham & Whitaker, 1996). Even in foveal word viewing 10
recognition performance is usually impaired for many letters. This is because letter recognition 11
performance is not homogeneous across the visual field and quickly drops with visual eccentricity 12
(Legge, Mansfield, & Chung, 2001). However, visual limitations can be compensated by the 13
knowledge of word lexicon or sentence context, allowing the recognition of most words within one 14
single foveal fixation, although eccentric letters are not perfectly visible (Legge, Klitz & Tjan, 1997). 15
Acuity, crowding and positional uncertainty have been suggested to be the main visual factors that 16
limit letter recognition across the visual field (He, Legge, & Yu, 2013; Legge et al., 2007; Pelli & 17
Tillman, 2008; Yu, Legge, Wagoner, & Chung, 2014). Low acuity impairs letter identification in the 18
para-fovea and in the periphery when a letter is presented alone or surrounded by other letters 19
(Wertheim, 1980; Westheimer, 1979). Crowding impairs letter identification when a target letter is 20
surrounded by other letters (Bouma, 1970; Levi, 2008; Whitney & Levi, 2011). Crowding supposedly 21
constrains the visual system to integrate together visual features coming from a target letter and 22
from its neighbor letters (Bernard & Chung, 2011; Pelli, Palomares, & Majaj, 2004; Pelli & Tillman, 23
2008). The negative impact of crowding on letter recognition is directly proportional to visual 24
eccentricity (i.e. the Bouma law (Bouma, 1970)). It is more deleterious on reading performance than 25
the impact of visual acuity when letters are presented at a usual print-size (Pelli et al., 2007; Yu et al., 1
2014). Position uncertainty is another visual constraint that decreases the ability of subjects to 2
correctly localize single or crowded objects such as letters (Chung & Legge, 2009; Levi & Tripathy, 3
1996; Strasburger, 2005; Strasburger & Malania, 2013). Localization errors can be represented by a 4
normal distribution centered on the letter target (Chung & Legge, 2009; Gomez, Ratcliff, & Perea, 5
2008; Levi & Tripathy, 1996). Standard deviation of this distribution varies as a function of certain 6
parameters such as time duration or eccentricity (Chung & Legge, 2009; Gomez et al., 2008; Michel & 7
Geisler, 2011). Crowding and localization are tightly connected as it has been shown that crowding 8
increases positional uncertainty for letters (Harrison & Bex, 2016; van den Berg, Johnson, Martinez 9
Anton, Schepers, & Cornelissen, 2012). Visual acuity, crowding, and positional uncertainty are thus 10
the main visual factors which theoretically limit the identification of letters within a word. 11
Therefore, a complete word recognition model should represent (1) the detection and integration of 12
visual features to build letters, and (2) the integration of letter-level information to reach word 13
identification. This is the basic theory that is described by the original interactive activation model 14
(McClelland & Rumelhart, 1981) and its descendants (Coltheart, Rastle, Perry, Langdon, & Ziegler, 15
2001; Davis, 2010; J. Grainger & Jacobs, 1996).1 In this theory, the first feature-to-letter step is still
16
unclear because letter features are not yet defined despite decades of research (Fiset et al., 2008; 17
Jonathan Grainger, Rey, & Dufau, 2008). As a consequence the recognition of crowded letters within 18
a letter string involving the combination of target and flanker features (Pelli et al., 2004) is even 19
harder to define. Thus this step is usually skipped or grossly represented in implemented word 20
recognition models. The letter-to-word process through a lexical access has been largely studied in 21
behavioral (essentially through priming experiments) and in brain activation studies. Lexical access is 22
usually represented by a competition across time between words of the lexicon that are perceptually 23
similar: When a reader starts to identify a word, visual information about its letters increases with 24
1 Note that these models do not separate letter and word identification steps although (Pelli, Farell, & Moore,
time, consequently increasing the activation of the word at the expense of its orthographic 1
neighbors. This competition is another common basis of word recognition models (Norris, 2013), 2
with recent models even describing the accumulation of letter information across time and its use to 3
identify words (Adelman, 2011; Norris, 2006; Norris & Kinoshita, 2012; Norris, Kinoshita, & van 4
Casteren, 2010). It is clear that two categories of letter-level visual information influence the 5
discrimination between a word and its orthographic neighbors: identity and position information 6
(Davis, 2010; Gomez et al., 2008; Norris, 2006; Norris et al., 2010). Behavioral results on visual 7
crowding described in the previous paragraph show that under crowded conditions, human 8
observers can usually extract a limited amount of letter identity and position information, this 9
information depending on many visual factors such as presentation duration, eccentricity or spatial 10
configuration (Chung & Legge, 2009; Legge et al., 2001). Based on the strong influence of visual 11
crowding on letter recognition it is rather surprising that the influence of crowding on letter 12
recognition is almost never (or very superficially) taken into account in current implemented models 13
(Norris, 2013). More generally we argue that the influence of visual crowding on letter recognition 14
cannot be bypassed if we want to predict errors that occur during the recognition of long words 15
(length > 5 letters). This is even more critical for words presented in the parafovea or in the periphery 16
as the deleterious effect of visual crowding increases with visual eccentricity. 17
Bayesian models have been able to predict human perception and oculomotor performance and 18
behaviors in vision science (Geisler, 1989; Geisler, 2011; Kersten, Mamassian, & Yuille, 2004; Legge et 19
al., 1997; Najemnik & Geisler, 2005; Renninger, Verghese, & Coughlan, 2007; Weiss, Simoncelli, & 20
Adelson, 2002). Theoretically, Bayesian observers act like ideal observers who make decisions based 21
on an optimal use of the incomplete available visual information (given the limitations of the visual 22
system). Concerning word recognition, Bayesian theories have been implemented and tested to 23
predict reading performance in foveal and parafoveal reading either with (Bicknell & Levy, 2010, 24
2010; Legge et al., 2001; Legge, Hooven, Klitz, Stephen Mansfield, & Tjan, 2002) or without (Legge et 25
al., 2001; Pelli et al., 2003) eye movements. These models defined identity uncertainty as the only 26
visual factor limiting foveal and parafoveal letter recognition. Legge et al (Legge et al., 2001) 1
calculated the performance of a Bayesian lexical matching algorithm and found that the model was 2
sufficient to account for reading performance in foveal vision. The "Bayesian reader" (Norris, 2006; 3
Norris et al., 2010) used only letter identity uncertainty in its first version (Norris, 2006). Later both 4
letter identity and letter position uncertainties were used to simulate foveal word recognition 5
processes (Norris et al., 2010). The "Bayesian Reader" describes the accumulation and optimal 6
integration of letter feature information, making letter identity and letter position (and thus word 7
identity) less and less uncertain over time. The Bayesian Reader predicts the (logarithmic) effect of 8
word frequency on foveal word reaction times as well as some typical priming effects that modulate 9
lexical decision performance. In the implemented version of this model all letters in a word are 10
assumed to be equally visible, an acceptable hypothesis for the foveal recognition of short words. 11
In the present study, as in previous Bayesian word recognition models, we assumed that human 12
readers make an optimal use of available letter information during the lexical access (Dennis Norris, 13
2006). However, we also took into account that an automatic non optimal letter-processing stage 14
(occurring independently for all letters) precedes lexical access (Pelli et al., 2003). The model that we 15
implemented and tested here is based on these assumptions. It can be broken down in three stages: 16
The first stage is the automatic non-optimal letter-processing stage proposed by Pelli et al. (2003). 17
The two following stages are optimal. Our second stage consists in the extraction of letter position 18
and identity uncertainties based on the first-step letter “recognition” process. Our third stage 19
corresponds to the lexical access and is the integration position and identity uncertainties from each 20
letter in order to identify the presented word. We tested our model with word recognition tasks in 21
parafoveal conditions because they are ideal to create strong perceptual uncertainties with long or 22
unlimited durations without inducing artificial visual noise as in foveal viewing. We can thus judge 23
the validity of our model by directly using word recognition performance. This also allows us to 24
generalize the validity of Pelli et al’s theory in peripheral viewing conditions and to understand the 25
mechanisms of word recognition for subjects who cannot use their central vision. 26
The important novelty of our approach is the way we tested our model: We first behaviorally 1
quantified letter identity and position uncertainties caused by acuity, crowding and position 2
uncertainty. Currently implemented word recognition models usually assume that letter identity 3
uncertainty is homogeneous within the presented word, which is a bold approximation given the 4
large slope of the relationship between eccentricity and crowded letter recognition (Legge et al., 5
2001). Here we bypassed this strong limitation by estimating position and identity letter 6
uncertainties for different letter positions in five individual subjects (Experiment 1). These 7
psychophysical measurements were made in the absence of any linguistic contextual constraints. 8
They allowed us to implement an ideal-observer model that simulated the optimal use of both letter 9
identity and position information for each observer following a non-optimal letter guess (Pelli et al., 10
2003). These predictions were compared with word recognition data from the same five subjects 11
(Experiment 2). To anticipate our results, we showed that word recognition errors and corresponding 12
letter errors made by our ideal-observer model correspond to errors made by human readers. Our 13
work suggests that word recognition can be described as the succession of three stages: A first stage 14
where expert readers automatically try to identify all word letters (Pelli et al., 2003) thus leading to 15
“letter guesses”, a second stage where letter-identity and letter-position information within a word 16
are determined for each letter, and a third lexical access stage where both types of letter information 17
are optimally combined together. 18
Based on the successful comparison between our ideal-observer model and psychophysical data, our 19
work confirm the plausibility of such an optimal word recognition mechanism (stages 2 and 3) 20
following the automatic and non-optimal word letter recognition step (stage 1). 21
METHODS 1
Subjects 2
Five subjects (age: 22-37) participated in Experiment 1 (letter recognition experiment) and the same 3
five subjects participated in Experiment 2 (word recognition experiment). Subjects were all native-4
born French speakers. The research followed the tenets of the Declaration of Helsinki and was 5
approved by the Ethical Committee for Protection of Human Subjects at the Aix-Marseille Université. 6
Written informed consent was obtained from each observer after the nature and purpose of the 7
experiment had been explained. 8
Apparatus 9
Stimuli were displayed on a 21-inch CRT color monitor (ViewSonic P227f, refresh rate = 120 Hz, 10
resolution = 1152 x 854 pixels). A PC computer running custom software developed in Python with 11
the Psychopy library (Peirce, 2007) was controlling the display. Observers sat in a comfortable chair 12
at a viewing distance of 40 cm (screen visual angle: 50.8° x 37.7°) with a forehead rest to stabilize 13
their position. An Eyelink 1000 Tower Mount eyetracker (SR Research Ltd., Mississauga, Ont., 14
Canada) was also connected to our system to control observers’ gaze position in Experiments 1 15
(letter recognition) and 2 (word recognition). In both experiments letters and words were displayed 16
in black (luminance: 0.3 cd/m2) on a light gray background (luminance: 60 cd/m2). 17
Letter strings and words used in experiments 18
Letter strings used in Experiment 1a (3-letter strings) and 1b (5-letter strings) were made of letters 19
randomly chosen among the 26 letters of the alphabet. Word lemmas used in Experiment 2 were 20
randomly extracted from three sets of 500 lemmas (500 5-letter words, 500 7-letter words and 500 21
9-letter words). Each word had a lexical frequency larger than 15 occurrences per million of words 22
based on the Lexique3 corpus (New, Pallier, Brysbaert, & Ferrand, 2004) to avoid the presence of 23
words which could be unknown to the subjects. Importantly, all French trigrams and French 1
words were chosen without any accent letters. 2
Experimental protocol 3
Each subject ran three successive experiments that measured foveal and parafoveal letter 4
recognition (Experiments 1a and 1b) and word recognition (Experiment 2) performance. Letters and 5
words were presented at different positions on an invisible horizontal lined centered on the middle 6
of the screen. Experiments 1a and 1b were run to measure letter recognition performance for letters 7
presented within trigrams (Experiment 1a) and within pentagrams (Experiment 1b). Experiment 2 8
was run to measure word recognition performance. In each experiment and for every subject the x-9
height letter print-size (Legge & Bigelow, 2011) was fixed at 1.38°. We assume that this print-size is 10
large enough to avoid the effect of acuity on letter recognition in our experiment as Yu et al (Yu et 11
al., 2014) found a very small acuity effect on letter recognition with a print-size of 0.55° and a 12
protocol similar to ours. The non-proportional Courier font was used to display letters and words so 13
that the letter slot positions in Experiments 1a and 1b corresponded to the same letter slot positions 14
as in Experiment 2. Presentation duration was fixed at 250 ms, the approximate average duration for 15
a reading fixation (Rayner, 1998) 16
(1) Experiment 1: Letter recognition 17
Experiment 1 was similar to experiments used to measure what previous vision researchers called 18
visual span profiles (Legge et al., 2001; Legge et al., 2007): the recognition performance of letter 19
trigrams (three adjacent letters) presented at different retinal locations. Full report of letter trigrams 20
is useful because it allows the measurement of error rates for interior letters (i.e. letters with one 21
flanker on the left and one flanker on the right) and for exterior letters (i.e. letters with only one 22
flanker on the left or only one flanker on the right). Observers were required to report verbally the 23
three letters from left to right: Therefore we called left, center, and right the three possible letter 24
positions2. Figure 1a and Figure 1b describe the temporal course of Experiments 1a and 1b:
1
Observers were asked to fixate between two dots centered on the middle of the screen (distance 2
between the two dots: 3°). Gaze location was measured to control for steady fixation between the 3
two dots (tolerance: ±0.5°). In Experiment 1a, when the observer was ready for the trial, he/she 4
pressed the button of a hand-held joypad. This started the trial: a letter trigram (a string of three 5
random letters with standard letter-to-letter spacing) was centered at one of 13 possible positions 6
across the horizontal meridian. Before the trigram display, three hashtag symbols were displayed at 7
the future letter positions until the subject pressed the button. A backward mask with the same 8
three hashtag symbols immediately followed the trigram presentation. Each observer was required 9
to report the three presented letters verbally from left to right as the experimenter recorded the 10
report. Each subject ran one session (approximately 1h) which consisted of 4 blocks of 65 trials (13 11
locations x 5 repetitions). For each subject, a total number of 20 trigram trials was run for each 12
location condition. 13
The experimental protocol of Experiment 1b was similar to the protocol of Experiment 1a 14
(recognition of letter trigrams) and is described in Figure 1b. The main difference was that a string of 15
5 letters was displayed on each trial. Subjects had to report the three interior letters (i.e. the interior 16
trigram) of the pentagram. These three interior letters could be displayed at one of the 13 positions 17
that had been used in Experiment 1a. They were also called the left, central, and right letters (i.e. 18
with respect to the central letter) of the interior trigram . Five hashtag symbols were first displayed 19
to indicate the future letter positions and a backward mask was presented comprised of the same 20
hashtag symbols. As in Experiment 1a each observer’s answer was recorded. Each subject ran one 21
session (approximately 1h that consisted of 4 blocks of 65 trials (13 locations x 5 repetitions). For 22
each subject a total number of 20 pentagram trials was run for each (location x duration) condition. 23
In both experiments 1a and 1b, location of the letters to the left and to the right of the central letter 1
(“x” and “z” in figure 3) is referred to hereafter as either the relative position within the interior 2
trigram or as the interior position for short. 3
(2) Experiment 2: Word recognition 4
Figure 1c describes the temporal course of Experiment 2: Five, seven, or nine-letter words were 5
briefly presented, centered on different positions (five possible center positions: the fixation locus, 6
two letter slots on the left, two letter slots on the right, four letter slots on the left, and four letter 7
slots on the right). Presentation duration was 250 ms (as in Experiment 1). The future position of a 8
word was indicated in advance by several hashtag symbols (5, 7 or 9 symbols) until the observer 9
pressed the button and the word was displayed. Right after the word display a backward mask made 10
of the same number of hashtag symbols replaced the word. The observer’s verbal report was stored 11
by the experimenter. Each subject ran two sessions (approximately 1h per session). Each session was 12
made of 6 blocks. Each block corresponded to the display of words of a given word length (i.e. the 13
word length was blocked) and was made of 25 words (5 positions x 5 repetitions). Subjects were 14
not allowed to give non-word responses. Before the beginning of a block subjects were informed 15
of the size of the words. If the subject was reporting a word with a different length the experimenter 16
would collect this response anyway. For each subject 20 words were displayed for each (position x 17
word length) condition. 18
19
1
(c)
(a)
####### ### eth ### ##### lrtev(b)
##### verdure #######Figure 1: Experimental protocol for Experiments 1a, 1b, and 2. 1
Observers were asked to fixate between the two central dots before (a) a letter trigram 2
(Experiment 1a), (b) a letter pentagram (Experiment 1b), or (c) a 5-letter, 7-letter, or 9-letter 3
French word (Experiment 2) was briefly displayed for 250 ms as soon as they pressed a button. At 4
the end of the trial, observers reported the letter string/word to the experimenter (the 3 interior 5
letters when a pentagram was displayed, Experiment 1b). 6
7 8
RESULTS 1
Letter recognition profiles 2
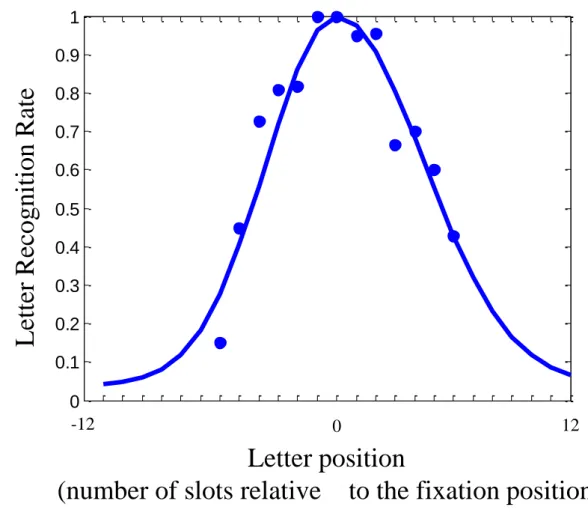
Figure 2 shows an example of a letter recognition profile for one of our five subjects. The average 3
recognition performance for each dot is based on twenty trials. Letter recognition performance is 4
highest for letters presented at the fovea and decreases with eccentricity. Legge et al (Legge et al., 5
2001) showed that two half-Gaussian functions can efficiently quantify the effects of eccentricity on 6
letter recognition rates. This is particularly useful because it improves the quality of the collected 7
data and it uses only 3 parameters to define a visual span profile. In consequence, each (visual 8
hemifield ℎ, trigram interior position 𝑖) association can be characterized by a letter recognition profile 9
function defined as a function 𝑓 of horizontal eccentricity: 10
𝑙𝑒𝑡𝑡𝑒𝑟_𝑟𝑒𝑐𝑜𝑔𝑛𝑖𝑡𝑖𝑜𝑛_𝑟𝑎𝑡𝑒 = 𝑓(ℎ,𝑖)(𝑒𝑐𝑐), f being a half-Gaussian function with 𝑓(ℎ=𝐿,𝑖)(0) = 11
𝑓(ℎ=𝑅,𝑖)(0) ≤ 1 and lim
𝑒𝑐𝑐→∞𝑓(ℎ=𝐿,𝑖)(𝑒𝑐𝑐) = lim𝑒𝑐𝑐→∞𝑓(ℎ=𝑅,𝑖)(𝑒𝑐𝑐) = 1 26⁄ . These equations mean that, 12
for a given interior position, the foveal value for the left visual field corresponds to the foveal value 13
for the right visual field. For the left and the right visual field, the chance level for infinite eccentricity 14
is 1 26⁄ . These mathematical rules were used to fit the raw data into letter recognition profiles for 15
each subject and each relative position within the letter trigram (Experiment 1a) or the three central 16
letters of the pentagram (Experiment 1b). Profiles for each subject, each relative position within the 17
trigram or the three central letters, and each experiment are shown in Figure 3. They show a much 18
better identification performance for trigram letters compared to pentagram letters (37% vs. 65% on 19
average) because of the increase of neighbour letters in the pentagram task. 20
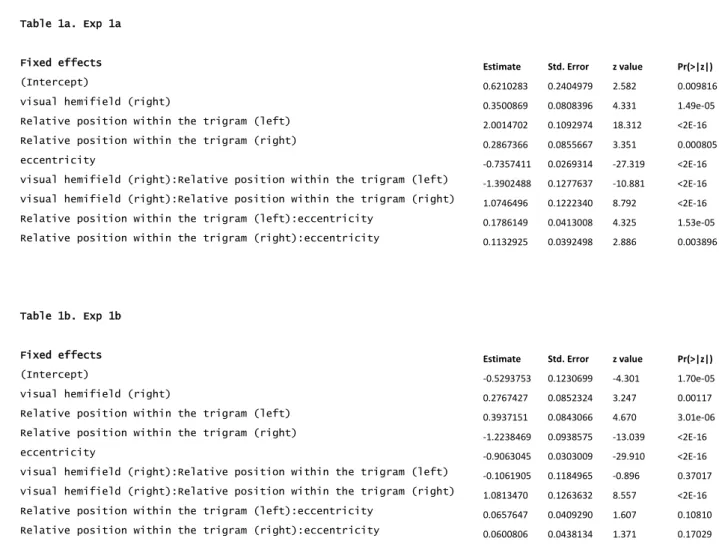
Based on our data average points we investigated the effects of different factors on letter 21
recognition performance. Two generalized linear mixed-effect models for binary responses (function 22
glmer of the lme4 package in the R language and environment (R Development Core Team, 2013)) 23
were performed to analyse letter recognition performance in Experiments 1a and 1b. The random 24
effect was the subject factor and the fixed effects were the visual hemifield side, the eccentricity, and 1
the relative position within the trigram made by the three central letters of the pentagram. There 2
were two interaction terms: visual hemifield* relative position within the interior trigram and 3
eccentricity*relative position within the interior trigram. The dependent variable was the letter 4
recognition error variable (0 or 1). Results of the analysis are shown in Table 1a for Experiment 1a 5
and Table 1b for Experiment 1b. 6
7
Figure 2: Example of letter recognition profile 8
Each dot represents the average recognition rate for each letter position (from 20 trials). The curve 9
represents the two connected half-Gaussian functions that offer the best fit for the given dots in 10
the left and in the right visual field. 11
12
Letter position
(number of slots relatively to the fixation position)
Le
tt
er
Recognit
ion
Rate
-12
0
12
0
0.1
0.2
0.3
0.4
0.5
0.6
0.7
0.8
0.9
1
Our analyses confirm what can be observed in Figure 3: There are differences in letter recognition 1
performance based on eccentricity, relative position within the trigram made by the three central 2
letters (3 coloured letters in figure 3), and visual hemifield as already described in different studies 3
dealing with peripheral recognition of crowded letters (Legge et al., 2001). Confirming this 4
observation our two mixed effect model analyses show significant effects of visual hemifield, internal 5
position, and visual eccentricity on crowded letter recognition rates. In both experiments we found a 6
significant advantage of the right visual hemifield over the left visual hemifield (Bouma, 1973; Bouma 7
& Legein, 1977; Nazir, Heller, & Sussmann, 1992): + 7% on average for the right visual field. We also 8
found a significant decrease of letter recognition performance with visual eccentricity (Bouma, 9
1973): - 18% on average per letter slot. The significant difference between left, central, and right 10
interior positions is different in both experiments: In Experiment 1a (trigram presentation) there is a 11
disadvantage for the central letter compared to the left and right letters because of the lack of 12
crowding for the two outer letters (Bouma, 1973; Legge et al., 2001). In Experiment 1b (pentagram 13
presentation), we found a significant left-to-right gradient effect: Recognition performance is 14
significantly better for the left letter compared to the center letter, and for the center letter 15
compared to the right letter. This small effect could represent a leftward bias (sequential report) 16
already reported in similar letter string experimental measurements (Whitney, 2008). We also found 17
a significant interaction between the relative position within the trigram and the hemifield in 18
Experiment 1a: The outer letter (left letter in the left visual field and right letter in the right visual 19
field) is easier to identify, an effect already shown in previous study (G. E. Legge et al., 2001). This 20
effect is only significant for the right letter of the trigram in Experiment 1b. Finally, a significant 21
interaction between the eccentricity and the relative position within the trigram was found in 22
Experiment 1a: The effect of visual eccentricity is larger for the left than for the right letter. 23
These results confirm that crowded letter recognition performance is dependent on three key 24
parameters that have been previously described: visual hemifield, interior position, and eccentricity. 25
1
2
3
Figure 3: Letter recognition profiles 4
The left and right boxes represent the Letter recognition profiles for the two different letter 5
recognition experiments: Experiment 1a and Experiment 1b. Each box is made of six smaller boxes 6
(one for each subject and one for the average data). Each curve, made of the two connected half-7
Gaussian functions, represents the subject (or average) letter recognition profiles for the three 8
different relative letter positions (left position in red, central position in green, and right position 9
in blue relative to the central letter position within each trigram/pentagram). 10
11
Figure 3 : Letter recognition profiles. The left and right boxes represent the Letter recognition 12
profiles for the two different letter recognition experiments: Experiment 1a and Experiment 1b. 13
Each box is made of six smaller boxes (one for each subject and one for the average data). Each 14
curve, made of the two connected half-Gaussian functions, represents the subject (or average) 15
letter recognition profiles for the three different relative interior positions (left position in blue 16
("x"), central position in green ("y"), and right position in red ("z") ) within each trigram (exp 1a) or 17 pentagram (exp 1b). 18 19 20 21 22 23 24 25
Letter position (Horizontal eccentricity from the fixation position)
Le
tter
Re
cogn
itio
n
Ra
te
-12 0 12 -12 0 12 -12 0 12 -12 0 12 -12 0 12 -12 0 12 -12 0 12 -12 0 12 -12 0 12 -12 0 12 -12 0 12 -12 0 12Exp 1a:
xy
z
Exp 1b: a
xy
z
b
0 0.5 1 S1 0 0.5 1 S2 0 0.5 1 S3 0 0.5 1 S4 0 0.5 1 S5 0 0.5 1 Average 0 0.5 1 S1 0 0.5 1 S2 0 0.5 1 S3 0 0.5 1 S4 0 0.5 1 S5 0 0.5 1 Average
1 2 3 4 5
Table 1a. Exp 1a
Fixed effects Estimate Std. Error z value Pr(>|z|)
(Intercept) 0.6210283 0.2404979 2.582 0.009816
visual hemifield (right) 0.3500869 0.0808396 4.331 1.49e-05
Relative position within the trigram (left) 2.0014702 0.1092974 18.312 <2E-16
Relative position within the trigram (right) 0.2867366 0.0855667 3.351 0.000805
eccentricity -0.7357411 0.0269314 -27.319 <2E-16
visual hemifield (right):Relative position within the trigram (left) -1.3902488 0.1277637 -10.881 <2E-16 visual hemifield (right):Relative position within the trigram (right) 1.0746496 0.1222340 8.792 <2E-16 Relative position within the trigram (left):eccentricity 0.1786149 0.0413008 4.325 1.53e-05 Relative position within the trigram (right):eccentricity 0.1132925 0.0392498 2.886 0.003896
Table 1b. Exp 1b
Fixed effects Estimate Std. Error z value Pr(>|z|)
(Intercept) -0.5293753 0.1230699 -4.301 1.70e-05
visual hemifield (right) 0.2767427 0.0852324 3.247 0.00117
Relative position within the trigram (left) 0.3937151 0.0843066 4.670 3.01e-06
Relative position within the trigram (right) -1.2238469 0.0938575 -13.039 <2E-16
eccentricity -0.9063045 0.0303009 -29.910 <2E-16
visual hemifield (right):Relative position within the trigram (left) -0.1061905 0.1184965 -0.896 0.37017 visual hemifield (right):Relative position within the trigram (right) 1.0813470 0.1263632 8.557 <2E-16 Relative position within the trigram (left):eccentricity 0.0657647 0.0409290 1.607 0.10810 Relative position within the trigram (right):eccentricity 0.0600806 0.0438134 1.371 0.17029
6
Table 1: Fixed effects results of the generalized linear mixed-effects models to predict letter recognition rates in Experiment 1a (Table 1a) 7
and Experiment 1b (Table 1b). In these models, the reference values were: Left visual hemifield, central “interior position” within the 8
trigram made by the 3 central letters (coloured letters in figure 3), and a visual eccentricity of 3 letter slots. No hemifield was assigned to 9
the letters on the midline. 10
11 12 13
Separating letter identity and letter position errors 1
Previous studies have shown that crowded letter recognition errors can be divided in two types of 2
errors (Strasburger & Malania, 2013; Wang, He, & Legge, 2014; Yu et al., 2014) : location errors (a 3
neighbor letter is reported instead of the target letter) and identity errors (an error that is not a 4
location error). To separate both types of letter errors we first assumed that identity and mislocation 5
errors are independent which is a plausible hypothesis (Hanus & Vul, 2013) despite some 6
controversies (Bernard & Chung, 2011; Freeman, Chakravarthi, & Pelli, 2012). Second we assumed 7
that letter position, for a given spatial horizontal position, can be represented by a Gaussian 8
probability density distribution centered on the real position of the letter (Chung & Legge, 2009; Levi 9
& Tripathy, 1996). Interestingly the standard deviation of this position noise has been shown to 10
increase almost linearly with visual eccentricity (Chung & Legge, 2009; Levi & Tripathy, 1996; Michel 11
& Geisler, 2011). Therefore a single mislocation coefficient α (a proportionality coefficient if we 12
consider positional uncertainty as null at the fovea) is sufficient to characterize the position 13
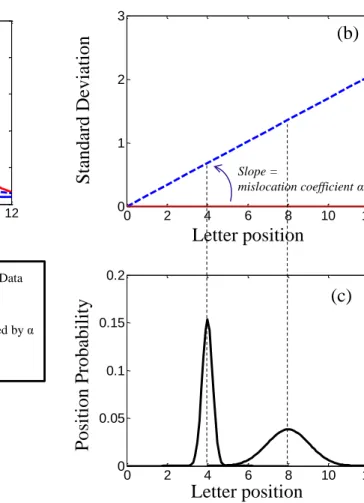
uncertainty of letters at any horizontal position across the visual field. Figure 4 shows how we 14
determined this coefficient (∝) from each letter recognition profile: First we removed mislocation 15
errors from identification errors among letter errors following what has been done in previous 16
studies (He et al., 2013; Wang et al., 2014; Yu et al., 2014). Letter mislocation for a given letter occurs 17
when the letter is correctly identified but not at the true letter slot position (For instance if the 18
trigram abc was presented, the letter b was considered as mislocated if reported at the first or last 19
slot by the subject but not at the center slot). Figure 4a shows the new letter recognition profiles (in 20
red) without mislocation errors. This new profile is critical to determine letter identity uncertainty. 21
We call it the letter identity recognition profile. It is logically higher than the letter recognition profile 22
with mislocation errors (in blue) because it does not consider letter mislocations as letter recognition 23
errors. Once these profiles were extracted for each subject we determined the optimal mislocation 24
coefficient (α) (see Figure 4b and Figure 4c) that offers the best fit (dashed blue line in Figure 4a) to 25
predict the letter recognition profile (in blue) from the letter identity recognition profile (in red). Note 26
that this prediction offers a very high correlation coefficient (r2>0.90) for each obtained mislocation
1
coefficient (α). The mathematical method to calculate a letter recognition profile from an identity 2
letter recognition profile and a mislocation coefficient (α) is detailed in Appendix 1. 3
Letter mislocations were determined for the three relative positions in Experiment 1a and only for 4
the central position in Experiment 1b. Indeed in Experiment 1b (pentagram presentation), subjects 5
did not report all five letters, and it was impossible to know if the subject correctly identified a letter 6
at a wrong position because he/she was naming only 3 letters. For instance, a subject could report a 7
mislocalized letter displayed at the first or last position of the pentagram but we could not know if it 8
was the case because the subject was only naming the three central letters. However, we assumed 9
that for the letter reported at the central slot, most mislocations were directed only towards the 2nd 10
and 4th letters and that we could ignore other non-reported letters. The values of the different 11
mislocation coefficients (α) are given in Appendix 3. They characterize letter position uncertainties 12
for the different subjects and the different conditions. The three coefficients that characterize 13
identity letter recognition profiles (The standard deviation of the left half Gaussian distribution, the 14
standard deviation of the right half Gaussian distribution, and the amplitude of both Gaussian 15
distributions) for Experiments 1a and 1b are given in Appendix 4. They characterize letter identity 16
uncertainties for the different subjects and the different conditions. 17
In sum, letter identity recognition profiles and mislocation coefficients characterize the uncertainty 18
about letter identity and position information extracted for every subject in one fixation of 250 19
milliseconds. For each subject this information is available for different visual eccentricities and 20
internal positions. Experiment 1a gives parameter values for exterior letters (only one letter flanker 21
on one side) and Experiment 1b gives parameter values for interior letters flanked with at least two 22
letters on each letter side. To simplify, letter identity recognition profiles will be called letter identity 23
profiles in the following text. 24
1
Figure 4: Determination of the mislocation coefficient α 2
Figure 4a shows an example of a letter recognition profile (blue curve) for a given subject and a 3
given relative position. We first removed mislocation errors from identification errors to obtain the 4
letter identity recognition profile (red curve). In consequence, the number of mislocation errors is 5
represented by the difference between both curves. The mislocation coefficient α is the slope 6
(shown in Figure 4b) of the regression determining the standard deviation of the Gaussian 7
localization distribution as a function of the visual eccentricity (as shown by 2 eccentricity 8
examples in Figure 4c). The optimal mislocation coefficient is the one predicting the best estimate 9
of the increase of mislocation errors, here the dashed area. (In a perfect case, the predictive blue 10
dashed curve would perfectly correspond to the blue solid curve). 11 12 13 0 2 4 6 8 10 12 0 0.05 0.1 0.15 0.2 -12-10 -8 -6 -4 -20 0 2 4 6 8 10 12 0.2 0.4 0.6 0.8 1
Re
cogn
it
ion
ra
te
Letter recognition profile : Data Letter identity recognition profile: Data
Letter recognition profile : Predicted by α
Letter position
Letter position
Standa
rd
De
vi
at
ion
P
os
it
ion
P
robabil
it
y
Letter position
(a)
(c)
0 2 4 6 8 10 12 0 1 2 3(b)
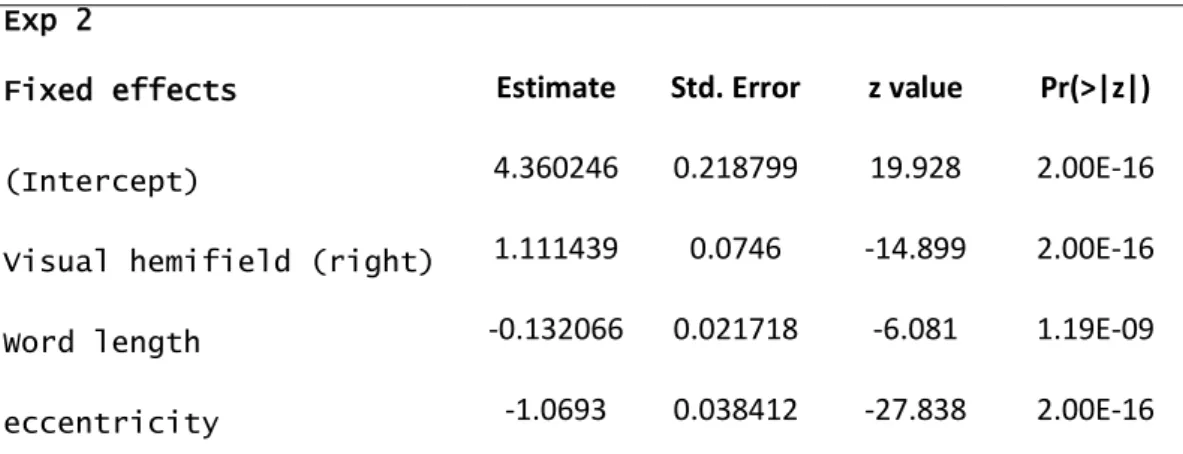
Slope = mislocation coefficient α Mislocation Errors (determined by the slope)Experiment 2: Word recognition 1
Figure 5a shows the word recognition performance (words made of 5, 7, and 9 letters) calculated for 2
each subject at different eccentricities (20 word presentations for each data point). Mean 3
performance across subjects is also indicated in the figure. Similarly to letter recognition 4
performance, word recognition performance clearly decreases with eccentricity. A generalized linear 5
mixed-effect model for binary responses (function glmer of the lme4 package in the language and 6
environment R (R Development Core Team, 2013)) was performed to investigate the effects of 7
relevant factors (hemifield, eccentricity, and word length) on word recognition performance. The 8
random effect was the subject factor. The dependent variable was the word recognition error 9
variable (0 or 1). Results of the analysis are shown in Erreur ! Source du renvoi introuvable.. As 10
previously shown in the literature word recognition performance significantly decreases when 11
horizontal eccentricity increases and when word length increases (Brysbaert, Vitu, & Schroyens, 12
1996). Words were also easier to identify when they were presented in the right visual field, with an 13
average optimal position located between 0 and 2 slots on the left of the center of the word. This 14
position is usually called the Optimal Viewing Position (Brysbaert et al., 1996; O’Reagan & Jacobs, 15
1992). 16
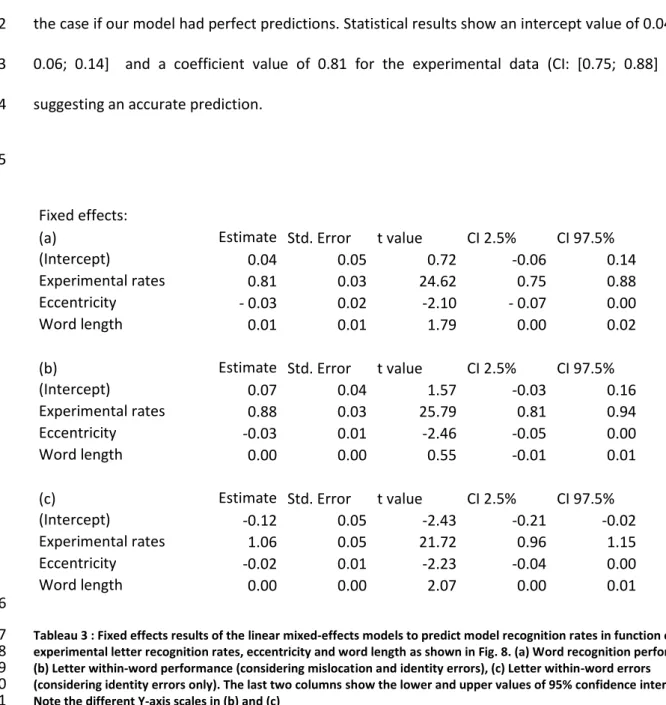
Exp 2
Fixed effects Estimate Std. Error z value Pr(>|z|)
(Intercept) 4.360246 0.218799 19.928 2.00E-16
Visual hemifield (right) 1.111439 0.0746 -14.899 2.00E-16
Word length -0.132066 0.021718 -6.081 1.19E-09
eccentricity -1.0693 0.038412 -27.838 2.00E-16
Table 2: Fixed effects results of the generalized mixed-effects model to predict word recognition rates in Experiment 2. The
17
reference values were: Left visual field and an eccentricity of 3 letter slots. 18
19
1
Letter errors 2
During Experiment 2, subjects' responses were entered letter-by-letter by the experimenter in the 3
experimental program. This allowed us to describe the patterns of letter errors made by the subjects 4
during the word identification task and to calculate the proportion of mislocalized and incorrectly 5
identified letters. Figure 5b shows the proportion of letters that were correctly reported at their 6
actual slot position. The letter errors that are represented here are identity and position errors: In 7
this case a mislocalized letter is considered as an error. Figure 5c shows the proportion of letters that 8
were correctly reported but this time at any letter position within the word. These errors 9
approximate the letter identity errors only: In this case a mislocalized letter is not considered as an 10
error. The goal of the word recognition model presented below is to account for the proportion of 11
word recognition errors at different visual eccentricities, as well as for the different ratios of identity 12
and mislocation letter errors.3
13
14
3 In cases where the participant's response had a different number of letters than the presented word, the slot
position was defined relatively to the first letter of the word. For instance, if the word “timer” was presented while the word “trimer” was reported, only one letter (“t”) was considered to be reported at a correct position.
1
Recog
nit
ion
Rate
Word center position
5-letter words 7-letter words 9-letter words
S1 S2 S3 S4 S5 Av. S1 S2 S3 S4 S5 Av. S1 S2 S3 S4 S5 Av.
(a) Word Recognition performance data
model -4 -2 0 2 4 0 0.5 1 -4 -2 0 2 4 0 0.5 1 -4 -2 0 2 4 0 0.5 1 -4 -2 0 2 4 0 0.5 1 -4 -2 0 2 4 0 0.5 1 -4 -2 0 2 4 0 0.5 1 -4 -2 0 2 4 0 0.5 1 -4 -2 0 2 4 0 0.5 1 -4 -2 0 2 4 0 0.5 1 -4 -2 0 2 4 0 0.5 1 -4 -2 0 2 4 0 0.5 1 -4 -2 0 2 4 0 0.5 1 -4 -2 0 2 4 0 0.5 1 -4 -2 0 2 4 0 0.5 1 -4 -2 0 2 4 0 0.5 1 -4 -2 0 2 4 0 0.5 1 -4 -2 0 2 4 0 0.5 1 -4 -2 0 2 4 0 0.5 1 -4 -2 0 2 4 0 0.5 1 -4 -2 0 2 4 0 0.5 1 -4 -2 0 2 4 0 0.5 1 -4 -2 0 2 4 0 0.5 1 -4 -2 0 2 4 0 0.5 1 -4 -2 0 2 4 0 0.5 1 -4 -2 0 2 4 0 0.5 1 -4 -2 0 2 4 0 0.5 1 -4 -2 0 2 4 0 0.5 1 -4 -2 0 2 4 0 0.5 1 -4 -2 0 2 4 0 0.5 1 -4 -2 0 2 4 0 0.5 1 -4 -2 0 2 4 0 0.5 1 -4 -2 0 2 4 0 0.5 1 -4 -2 0 2 4 0 0.5 1 -4 -2 0 2 4 0 0.5 1 -4 -2 0 2 4 0 0.5 1 -4 -2 0 2 4 0 0.5 1
(b) Letter-within-word recognition performance considering mislocation and identity errors
Recog
nit
ion
Rate
Recog
nit
ion
Rate
(c) Letter-within-word recognition performance considering identity errors only
-4 -2 0 2 4 0.6 0.8 1 -4 -2 0 2 4 0.6 0.8 1 -4 -2 0 2 4 0.6 0.8 1 -4 -2 0 2 4 0.6 0.8 1 -4 -2 0 2 4 0.6 0.8 1 -4 -2 0 2 4 0.6 0.8 1 -4 -2 0 2 4 0.6 0.8 1 -4 -2 0 2 4 0.6 0.8 1 -4 -2 0 2 4 0.6 0.8 1 -4 -2 0 2 4 0.6 0.8 1 -4 -2 0 2 4 0.6 0.8 1 -4 -2 0 2 4 0.6 0.8 1 -4 -2 0 2 4 0.6 0.8 1 -4 -2 0 2 4 0.6 0.8 1 -4 -2 0 2 4 0.6 0.8 1 -4 -2 0 2 4 0.6 0.8 1 -4 -2 0 2 4 0.6 0.8 1 -4 -2 0 2 4 0.6 0.8 1
5-letter words 7-letter words 9-letter words
5-letter words 7-letter words 9-letter words
Word center position
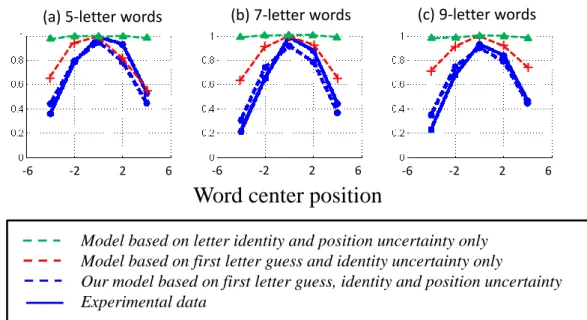
Figure 5: Word recognition performance across the visual field 1
For different word lengths (5,7, and 9 letters) and different positions across the visual field (words 2
centered on -4, -2, 0, 2, and 4 slots with respect to the fixation position), we plotted: (a) Individual 3
average word recognition rates, (b) individual average letter recognition rates considering identity 4
and mislocation errors (a response is counted as correct if the letter is correctly identified 5
whatever its reported location within the word), and (c) individual average identity recognition 6
rates considering identity errors only (a response is counted as correct only if a correct 7
identification occurs at the actual location). In other words, a correctly identified but mislocated 8
letter is counted as an error in (b) and as a correct response in (c). Each data point represents 20 9
trials. Raw data and predictions from our model are indicated. 10
A model to predict word recognition performance based on identity and position letter 1
uncertainties 2
Comparison with other word recognition models 3
Our model extends an important precursor model (Legge et al., 2001) which defined an ideal word 4
recognition observer based on letter identity uncertainty only4. Here we took an additional step
5
forward by including letter position uncertainty and by testing if this ideal-observer model could 6
explain word recognition error rates and patterns of letter recognition errors that occur during foveal 7
and parafoveal word recognition tasks. This was inspired by some recent work on letter position 8
uncertainty (Chung & Legge, 2009) and the possibility to code letter position within a word as an 9
absolute letter position distribution. The overlap model (Gomez et al., 2008), the spatial coding 10
model (Davis, 2010), or the latest versions of the Bayesian Reader (Norris & Kinoshita, 2012; Norris et 11
al., 2010) implemented letter position uncertainty in the same way and showed that it can explain 12
some foveal word recognition priming results (for instance "leakage" of letter identity to nearby 13
positions) that cannot be explained with relative coding of letter position. These models assume that 14
each letter of the word is equally perceptible (only the interior letters in the spatial coding model). 15
This is a plausible assumption for short words presented foveally, but as shown in Figure 2, letter 16
recognition rate quickly decreases as a function of visual eccentricity. In order to model word 17
recognition performance for foveal and parafoveal words, we argue that it is crucial not to ignore 18
these large discrepancies concerning letter identity uncertainties. This would be equivalent to 19
ignoring visual crowding despite its evident influence on word recognition and reading performance 20
(Frömer et al., 2015; Pelli et al., 2007; Risse, 2014). In consequence, a complete word recognition 21
model needs to take the visual limitations of crowding on letter identification into account. The 22
accurate representation of identity and position uncertainty of crowded letters is the key difference 23
between our model and other models of word recognition. 24
The current version of our model considers the use of letter visual information at a single point in 1
time. This is similar to most word recognition models (Norris, 2013). A few models describe 2
accumulation of information over time (Adelman, 2011; Norris, 2006; Norris & Kinoshita, 2012; 3
Norris et al., 2010) and are thus more realistic. In our model we assume that at the end of the 250 ms 4
word presentation the system will have access to the totality of the available position and identity 5
letter information and that a lexical access will be triggered based on this information. We then 6
exclude the possibility of successive lexical top-down feedbacks that might theoretically (despite 7
controversies: D. Norris, McQueen, & Cutler, 2000; Twomey, Kawabata Duncan, Price, & Devlin, 8
2011) improve letter and word recognition performance.5
9
General Principles: A three-step identification process 10
Experiment 1 allowed us to quantify visual information extracted in one 250 ms fixation by each 11
observer at a letter level. This information concerns the identity and the position uncertainties of 12
crowded letters located at different eccentricities along the horizontal median. As indicated in Figure 13
6, we hypothesized that the identification and the localization of letters are two independent 14
processes. Following the results of Pelli et al (2003), our model makes the strong assumption that the 15
letters of a word are separately identified before the word recognition step. In consequence, the first 16
step of word recognition is a letter identification first-guess for all letters of the word (what Pelli et al 17
(2003) called a "tentative internal letter identification", a plausible mechanism to explain their 18
experimental results). 19
Subsequently, the lexical competition occurs at a letter level and is an optimal word discrimination 20
based on this first-guess letter identification step. Many studies suggested that a lexical access based 21
on identity and position letter uncertainties is a plausible process (Davis, 2010; Norris & Kinoshita, 22
2012; Norris et al., 2010). Here the uncertainty concerning letter identity directly depends on the first 23
5 Note that we do not suggest here that no successive lexical feedback occurs during the word recognition
process. We only suggest that such loops might have light effects on word recognition performance for a 250 ms fixation task.
identification guess. Our second stage consists in quantifying these identity and positional 1
uncertainties for each letter. To do so, we consider that the model has an internal representation of 2
its confusion errors for any letter first-guess identity, at any letter position and for any relative 3
configuration (i.e. a confusion matrix for each position and configuration case). This knowledge is 4
used to compute a 26-probability vector that represents the probability of any of the 26 letters of the 5
alphabet to be displayed at the letter slot by using the prior letter recognition guess (G. E. Legge et 6
al., 2001; Pelli et al., 2003). This vector is called the letter-identity probability vector (see Figure 6a 7
and Figure 7). Position uncertainty represents the retinal and neuronal approximation for the spatial 8
localization of letters (Chung & Legge, 2009; Gomez et al., 2008) and is represented by a Gaussian 9
distribution that changes in function of visual eccentricity (see Figure 6b for spatial distribution 10
examples). Following the concepts of the overlap model (Gomez et al., 2008; Norris et al., 2010) and 11
the previous theories from whom it was inspired (Krueger, 1978; Ratcliff, 1981), we consider that this 12
spatial distribution describes the perceived spatial locations of letter features before they are 13
grouped in a single object (a letter). In consequence it is important to note the possibility for a single 14
letter to influence the identity of different letter slots. 15
As shown in Figure 6c, the third stage of our model assumes that human readers make optimal use of 16
both identity and position letter-level uncertainties when they try to identify written words. In other 17
words we assume that human readers calculate exact word probabilities from letter probabilities 18
during lexical access. This optimal use of letter probabilities following Bayes' theorem has been 19
suggested by different studies in visual word recognition (Legge et al., 2001; Norris, 2006; Pelli et al., 20
2003). 21
Detailed mechanisms 22
In Figure 6 we illustrated with an example the principles of our ideal-observer model, i.e. how letter 23
identity and position uncertainty are taken independently into account in order to identify a single 24
word, here the 5-letter word 'train'. As our goal is to predict word recognition performance for each 25
subject individually, we used the individual letter recognition profiles obtained from Experiment 1a 1
and 1b to quantify identity and position uncertainties for each different subject. Note that letter 2
recognition profiles are very different if the observed letter is an exterior letter (data from 3
Experiment 1a) or an interior letter (data from Experiment 1b). 4
1 0 1 2 3 4 5 6 7 8 0 0.005 0.01 0.015 0.02 t r r e t a e c l i t n m 0 1 2 3 4 5 6 7 8 0 0.005 0.01 0.015 0.02 t r r e t a e c l i t n m 0 1 2 3 4 5 6 7 8 0 0.005 0.01 0.015 0.02 t r r e t a e c l i t n m
With identity uncertainty (our model) Lett er Posit ion Probabi li ty dist ri bution
Letter slot number Without identity uncertainty
(overlap model)
Position map
Segmentation
Letter slot number
5-letter words 6-letter words
Likelihood computation 4-letter words
train
Stimulus (Input Letters) Letter-Identity First Guess Letter-Identity Probability Vector Adjusted Confusion matrices Letter identification Profiles 0 0 0 0 0 1 1 1 1 1 -12 12 -12 12 -12 12 -12 12 -12 12 a z a z a z a z a z a z a z a z a z a z 0 1 Con fu sion ra te ) (L1 a P p= ) (1 z L P p= ) (L2 a P p= ) (2 z L P p= ) (L3 a P p= ) (3 z L P p= ) (L4 a P p= ) (4 z L P p= ) (L5 a P p= ) (5 z L P p=t
r
a
l
n
IDENTITY UNCERTAINTY
POSITION UNCERTAINTY
(a)
(b)
LEXICAL PROCESSING
Identificationtrain
(c)
SD of Position distribution 12 0 0 12 0 12 0 12 0 12 0 2.5 0 2.5 0 2.5 0 2.5 0 2.5 sdWord train tarin trait turbin regain recoin telle tain rein
Probability 0.93556 0.04305 0.01183 0.00233 0.00179 0.00159 0.00144 0.00129 0.00112 0 1 2 3 4 5 6 7 8 0 0.005 0.01 0.015 0.02 t r r e t a e c l i t n m N slot 0 1 2 3 4 5 6 Drawn from : P(reported_letter | input_letter) See Figure 7 = P(input_letter | reported_letter=first_guess) 0 1 2 3 4 5 6 7 8 0 0.005 0.01 0.015 0.02 t r a i n p1 p2 p3 p4 p5
Mean C.M. diagonal probability = pi
sd1 sd2 sd3 sd4 sd5
sd1
sd2sd3sd4 sd5
Distribution 1 (sd1) Distribution 1 (sd1)* P(L1p=t)
First letter Interior letter Interior letter Interior letter Last letter
First letter Interior letter Interior letter Interior letter Last letter
sd sd sd sd N slot N slot N slot N slot N slot N slot N slot N slot N slot N slot R ec ogn iti on ra te R ec ogn iti on ra te R ec ogn iti on ra te R ec ogn iti on ra te R ec ogn iti on ra te
Figure 6: Model principles 1
The figure shows the different steps of our word recognition ideal observer trying to identify the 5-2
letter word 'train' displayed parafoveally (centered at slot +4): 3
(a) Identity uncertainties for the 5 displayed letters are defined as 26-element identity probability 4
vectors (last row). These vectors are obtained based on identity first guesses for each of the five 5
letters (first guess for the different observed letters : 'traln'). These first guesses have been made 6
using letter identification profiles (row 1) and confusion matrices (row 2) that correspond to the 7
recognition rate for each letter position. For instance, the first profile in row 1 corresponds to the 8
"x" blue profile in Figure 3: Exp 1a. 9
(b) Position uncertainties for the 5 different letters are displayed on position maps (last row). On 10
the left, the position map represents the classical version of the overlap model when identity 11
uncertainty is not coded. Standard deviations on this map are obtained from the linear relationship 12
between eccentricity and standard deviation (row 1). On the right, identity and position 13
uncertainties are coded for each letter and represent the position map for our model. Standard 14
deviations on this map are obtained from the linear relationship between eccentricity and 15
standard deviation, and from the identity uncertainties obtained in (a). 16
(c) The lexical access is done by using the position map to compute the probability of each word of 17
the lexicon to be presented. The position map can be segmented in different number of letters (4, 18
5, or 6 letters), to calculate word probabilities for each word of the lexicon. Finally, the word with 19
the highest probability is the choice of our ideal observer. 20
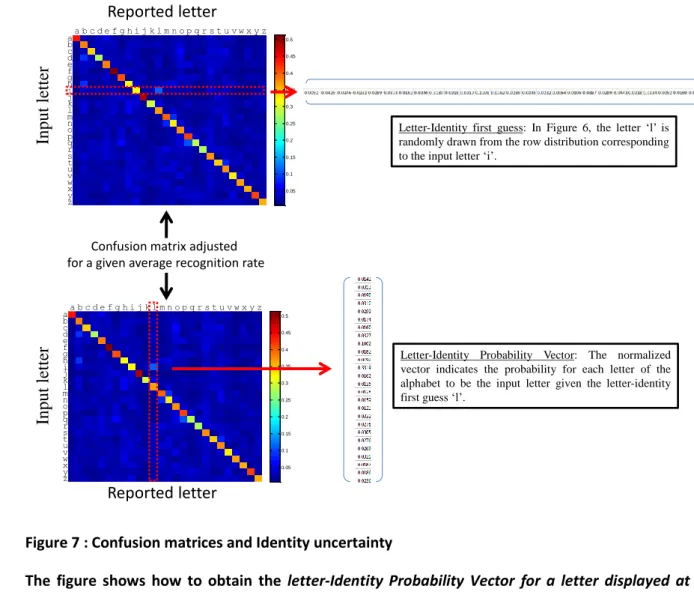
1
Figure 7 : Confusion matrices and Identity uncertainty 2
The figure shows how to obtain the letter-Identity Probability Vector for a letter displayed at a 3
given slot (cf. Figure 6a). First, a confusion matrix (CM) is calculated so that the average of the
4
values for the diagonal confusion matrix is identical to the letter recognition rate determined by 5
the letter recognition profile (see Figure 6a). Here, the corresponding recognition rate is p = 0.37 6
and the corresponding adjusted confusion matrix is calculated (see Appendix 4). The first-guess 7
letter (Pelli et al, 2003) is obtained by randomly drawing from the row distribution corresponding
8
to the displayed letter (Here, the first-guess is a 'l', whereas the letter 'i' was displayed). Finally, the 9
letter-Identity Probability Vector is the normalized column corresponding to the first-guess letter, 10
here the letter 'l'. 11 12 13 aa b b c c d d e e f f g g h h i i j j k k l l m m n n o o p p q q r r s s t t u u v v w w x x y y z z 0.05 0.1 0.15 0.2 0.25 0.3 0.35 0.4 0.45 0.5 aa b b c c d d e e f f g g h h i i j j k k l l m m n n o o p p q q r r s s t t u u v v w w x x y y z z 0.05 0.1 0.15 0.2 0.25 0.3 0.35 0.4 0.45 0.5 Input le tt er Reported letter Input le tt er Reported letter
Letter-Identity first guess: In Figure 6, the letter ‘l’ is randomly drawn from the row distribution corresponding to the input letter ‘i’.
Letter-Identity Probability Vector: The normalized vector indicates the probability for each letter of the alphabet to be the input letter given the letter-identity first guess ‘l’.
Confusion matrix adjusted for a given average recognition rate
a. Identity uncertainty coding 1
Identity uncertainty is coded by a 26-element probability vector for each letter slot. Each element of 2
the vector represents the probability for each letter of the alphabet (a-z) to be the letter at the given 3
slot. Following Pelli et al (2013) evidence, this probability vector is directly based on a first guess of 4
the letter identity. 5
Letter identity First-Guess 6
The way for our model to obtain first-guess letters for the different letters of a word is described in 7
Figure 6a and with more details on the top of Figure 7. To determine the first-guess for each letter, 8
our model uses letter recognition rates and confusion matrices that correspond to each letter slot. 9
Letter recognition profiles that have been measured in Experiments 1a and 1b give the recognition 10
rates for the different letters of the word based on their visual hemifield, their visual eccentricity and 11
their letter relative configuration (left-side crowded only, right-side crowded only, or both-side 12
crowded). The confusion matrix for each letter slot is directly obtained from its letter recognition 13
rate. It is done by transforming a general confusion matrix (obtained with the totality of trials of the 14
five subjects, average recognition rate: 0.44) so that the average recognition rate of the new 15
confusion matrix (the average of its diagonal values) becomes identical to the recognition rate for the 16
specific slot (see the transformation method in Appendix 4). For instance, if the letter identification 17
recognition for a given letter slot position is 0.2 then a confusion matrix that corresponds to 0.2 18
successful recognition rate and 0.8 confusion rate is firstly built. Secondly, this confusion matrix is 19
used by the ideal observer who uses the letter identity distribution given by the row of the input 20
letter to determine the letter first-guess6.
21
Letter Identity Probability Vector 22
6 Presented letters correspond to the rows in our confusion matrix examples, and reported letters