Creation of a Database for Evaluating the Effect of Genetic
Intellectual Property on Genetic Diagnostic Testing
by
Philip Murray
SUBMITTED TO THE DEPARTMENT OF MECHANICAL ENGINEERING IN
PARTIAL FULFILLMENT OF THE REQUIREMENTS FOR THE DEGREE OF
BACHELOR OF SCIENCE
AT THE
MASSACHUSETTS INSTITUTE OF TECHNOLOGY
JUNE 2006
©2006 Philip Murray. All rights reserved.
The author hereby grants to MIT permission to reproduce and to distribute publicly paper and electronic
copies of this thesis document in whole or in part
in any medium now known or hereafter created.
/7. A A
-Signature of Author:
- - VT".n6
Philip Murray
Department of Mechanical Engineering
5/12/06
Certified by:
I
(
Fioyi Murray
\ssn.rofessor,
Sloan
Schoohanagement
Thesis Supervisor
_% '%
Accepted by:
f
'% - -, John H. Lienhard V
Professor of Mechanical Engineering
Chairman, Undergraduate Thesis Committee
ARCHIVES SMMIS INS~frtfE CHNOLOGY 0 2 2006
RIES
MASSACHU OF TE AUGLIBF
I _Creation of a Database for Evaluating the Effect of Genetic Intellectual Property on Genetic Diagnostic Testing
by Philip Murray
Submitted to the Department of Mechanical Engineering on May 12, 2006 in Partial Fulfillment of the Requirements for the Degree of Bachelor of Science and
the Massachusetts Institute of Technology.
1.0 Abstract
In this study, we explore the impact of gene-based patents on the pricing and availability of genetic diagnostic tests. We also explore the nature and scope of the genetic diagnostics industry itself. Through data mining of the GeneTests database and gathering of pricing and procedure information from over 51 laboratories (using a range of sources including phone interviews), we created a unique database that links pricing, procedure and availability information for each sequencing-based gene diagnostic test offered in the US. In addition, we linked relevant gene-based patents to each gene in our database. Our results indicate a correlation between gene patents and test pricing, with an average non-patented test price of -$1330.31 (121 entries) compared to an average price of -$1419.58 for tests associated with gene patents (137 entries).
Thesis Supervisor: Fiona Murray
2.0 Table of Contents
1.0 Abstract ... 2
2.0 Table of Contents ... 3
3.0. Introduction ... 4
4.0. Background ... 5
4.1 Diagnostic Testing Methodologies ... 5
4.2 Heterogeneous Test Packaging ... 6
4.3 Diagnostic CPT Codes ... ... 8
4.4 Market Structure and Dynamics ... 9
4.5 Diagnostic Test Pricing ... ... 1... 1... 1
5.0 Related Work ... 12
6.0 Methods
...
...
13
7.0. Design Component ... 15
8.0. Results and Discussion ... 17
9.0 Conclusions ... 31
3.0 Introduction
Genetic diagnostic testing involves the analysis of human genes and gene products for the detection of disease-related alterations (1, 2). Although there are a variety of available testing methods, most genetic diagnostic tests involve the scanning of DNA segments (typically extracted from a blood sample) in search of mutated nucleotide sequences. By linking nucleotide irregularities to diseases, genetic tests are great tools for diagnosing and predicting disease.
In recent years, the size of the genetic diagnostics industry grew tremendously. Advancements in gene sequencing technologies accelerated gene discovery and enabled a wave of research linking genes to diseases. According to the Gene Tests database (see www.genetests.org), there are currently 960 diseases for which clinical genetic diagnostic testing is available.
Many of the genes associated with these genetic tests are subject to intellectual property. Although genes may not be patented as they exist in the human body, U.S. and European patent laws permit gene patents that claim a unique therapeutic or diagnostic use for a gene, or a proprietary method of gene isolation (3).
The impact of gene patenting on biomedical research and clinical medicine is a subject of considerable controversy (4). Proponents of gene patenting suggest that gene patents provide important incentives for the on-going R&D necessary to take gene-based ideas from the concept stage to the market and the clinic. Proponents also note the benefits of the information disclosure which results from patents (5). Critics, however, argue that gene patents discourage complementary R&D investments, stifle academic research, and slow the development of new medicines (5). With regard to genetic diagnostic testing in particular, critics argue that gene patent-related royalties result in increased test costs and decreased test availability (6). It is this alleged connection between gene patents and genetic diagnostic test pricing and availability that we explored in this study as it has not been subject to large-scale empirical analysis to date.
To conduct this study, we collected information about the pricing and availability of full-gene sequencing diagnostic tests in the United States. These are tests for which then entire coding region of a gene is sequenced in search of disease-related mutations. We also collected information about test procedures by analyzing the Current Procedural
Terminology (CPT) codes associated with each gene test. In addition, we linked each gene in our study to the corresponding number of gene patents by using a comprehensive gene patent database from a past study (5). Our data enable a number of novel
conclusions regarding both the impact of gene patents on genetic diagnostics and the nature of the genetic diagnostics industry itself. Our data suggest, among other things, that gene-based patents do indeed correspond to higher test pricing.
4.0 Background
The landscape of the genetic diagnostics industry is very complex. In order to better understand the industry and the context of our study, there are a few topics that are of particular importance, including (1) the differences among diagnostic methodologies, (2) the meaning and relevance of diagnostic CPT codes, (3) the heterogeneous forms in which genetic diagnostic tests are packaged and labeled, and (4) the unique industry structure. Also relevant to our study is a general understanding of the gene patent landscape. Here we have researched these and other topics and outlined some of our relevant findings.
4.1 Diagnostic Testing Methodologies
There are roughly 16 distinct methodologies by which genetic testing occurs (). These methodologies can be broken down into four general categories:
Direct DNA Analysis:
Sequencing of entire coding region, Sequencing of select exons, Mutation scanning, Mutation analysis, Protein Truncation Test (PTT)
DNA Analysis (Non-Direct):
Linkage analysis, Methylation analysis, Uniparental disomy (UPD), X-chromosome inactivation study
Molecular Cytogenic Methodologies:
FISH-metaphase, FISH-interphase, Subtelomeric FISH screen, Multicolor FISH (M-FISH)/spectral karotyping(tm) (SKY(tm))
Biochemical Methodologies:
Analyte, Enzyme assay, Protein analysis
For many genes and diseases, there are multiple methodologies by which testing is available. Testing for gene UBE3A (associated with Angelman syndrome), for example, is offered in 11 distinct forms by a total of 102 labs worldwide.
However these methods vary widely in their cost and in their accuracy and the applicability to particular mutations or diagnostic enquiries. To eliminate illegitimate price comparisons across methodologies, we chose to limit our study to one methodology in particular: the sequencing of the entire coding region, although we do analyze cases in which a test is offered using full sequencing as well as other methods. Also referred to as
a full sequencing analysis or a full gene sequencing, the sequencing of the entire coding
region is a process that is thought by some to be "the gold standard of genetic testing."
(8). It is, in any case, the most thorough form of testing. Typically, a full sequence
analysis involves PCR-based nucleotide sequencing of each of a gene's exons (coding regions) in search of sequence abnormalities.
4.2 Heterogeneous Test Packaging
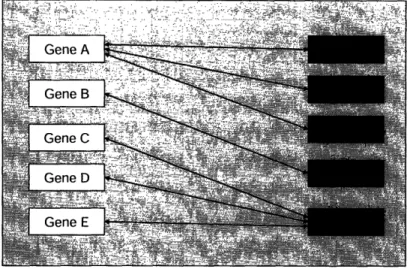
In addition to diverse diagnostic methodologies, there is a great deal of diversity in the way in which genetic tests are packaged. When we refer to test packaging, we simply refer to the gene(s) and disease(s) to which a given genetic test applies. The primary cause of packaging irregularities stems from the fact that some genes are associated with multiple diseases and some diseases are associated with multiple genes. The basic concept is illustrated by FIG. 1 below.
,...mh.;. .... ,: ,-; .... v..X ... :... ,,.:: ... . .
2 v.~:; . .
GeneA
.... v'.'"...:. ; ...:
. ..
. .'. ;. . V~~gr
i!'.'.·IGene B X.
FIG. 1: Diagram illustrating relationships between genes
and diseases. As shown, there are 3 diseases associated
with Gene A (Diseases A, B, and C), and there are 3 genes
associated with Disease E (Genes C, D, and E). Gene B,however, is the only gene associated with Disease D.
The simplest case of test packaging involves the testing of a single gene which is linked to a single disease - for example Gene B and Disease D in our Figure. A slightly more complicated scenario occurs for testing of a single gene which is linked to multiple diseases. In these cases, one lab may offer a test for the gene and all of its diseases, while another lab may offer a test for the gene and only one or some of its associated diseases. Fortunately, for our purposes in the study of full gene sequence tests, these cases can be treated identically. Since the pricing and procedure associated with the full sequencing and analysis of a particular gene is generally the same independent of the number of diseases toward which testing is targeted, such variations can be neglected from our database. Cases where multiple genes are packaged into a single test are those which complicate our study the most. For these cases, we are generally able to collect pricing and CPT coding information for the test as a whole. As a result, the cost and procedure associated with each gene is unclear and the link between gene and price is blurred. In cases such as these we have examined different specifications of our analysis to include the number of genes included in a particular test as part of our determination of price sensitivity.
4.3 Diagnostic CPT Codes
The procedures involved in gene sequencing have been structured to correspond to Current Procedural Terminology (CPT) codes. These codes serve to standardize medical procedures for private and public health insurance reimbursement. FIG.3 lists some of the most common codes and procedures used for gene sequencing, as well as the associated Medicare reimbursement amounts (14).
CPT Code Procedure Medicare
Payment
83890 molecular isolation or extraction $5.60
83891 isolation or extraction of highly purified nucleic acid $5.60
83892 enzymatic digestion $5.60
83893 dot/slot blot production $5.60
83894 separation by gel electrophoresis $5.60
83896 nucleic acid probe, each $5.60
83897 nucleic acid transfer $5.60
83898 amplification of patient nucleic acid, each nucleic acid $23.42 83901 amplification of patient nucleic acid, multiplex, each nucleic acid $23.42
83902 reverse transcription $19.83
83903 mutation scanning by physical properties, each single segment $23.42 83904 mutation identification by sequencing, each single segment $23.42 83905 mutation identification by allele specific transcription, each single $23.42
segment
83906 mutation identification by allele specific translation, each single $23.42 segment
83912 interpretation and report $5.60
FIG.2: CPT codes and descriptions for common molecular diagnostic
procedures. Pricing data represents Medicare national limitation
amounts (CodeMap Compliance Briefing: 4/2/2004).
For a typical full sequence test, certain procedures are repeated several times. In particular, procedures corresponding to codes 83898 (nucleic acid amplification), 83904 (mutation identification by sequencing) and 83894 (separation by gel electrophoresis) are subject to numerous repetitions, although CPT code repetitions vary greatly from lab to lab (certain labs also repeat codes such as 83891, 83903, 83892 and 83912). In some cases, repeated procedures (or repeated CPT codes) correspond to the size of the gene to be sequenced. For Athena Diagnostics, for example, the number of repetitions of the 83898 CPT code corresponds roughly to the number of exons of the relevant gene. Full sequence analysis of the 13 exon GLUD1 gene, for example, is given by CPT codes
83891 x 1, 83898x 14, 83904 x 14, 83912 x 1, where 83898 repetitions yields a similar value to total gene exons. At the Johns Hopkins Hospital DNA Diagnostic Laboratory,
83898 CPT code repetitions also correspond to gene exons. Thus, the full sequence analysis of the 4 exon TTR gene corresponds to codes 83891 x 1, 83898 x 4, 83904 x 8, 83909 x 8, and 83912 x 1. It should be noted, however, that for many labs this direct correlation does not exist. The reasons for these CPT coding differences are still unclear, however we suspect that they result (1) actual differences in diagnostic procedures, and (2) differences in the characterization of similar or identical procedures.
4.4 Market Structure and Dynamics
With genetic diagnostics, as with most areas of medicine, the road to testing typically begins with a patient visit to the physician. If a patient is suspected of having a particular disease, a doctor may order a relevant genetic diagnostic test if such a test exists. A doctor may then collect the patient's genetic sample, typically by drawing a few milliliters of blood, and send this sample to the appropriate diagnostic laboratory for analysis. Such laboratories often provide doctors with a kit to assist in the shipment process. Both Athena Diagnostics and GeneDx, Inc., for example, provide clients with custom shipping kits free of charge. Once the sample is received by the diagnostic laboratory, the sample is analyzed, the patient (and insurance company) is billed, and the results are reported to the patient's doctor.
Sample Market Flow Chart
FIG.3: In this sample flow chart, we see the case where Diagnostic Laboratory 1 has
been granted an exclusive license for a test by the Patent Holder, and then sublicensed
the test to Diagnostic Laboratory 2.Although this may sound straightforward, there are an array of nuances and various other types of companies which complicate this overview. To illustrate the structure and dynamics of this market, let's consider the development of a genetic test for
Severe Myoclonic Epilepsy of Infants (SMEI) which involves the sequencing of the SCN1A gene. The SCN1A sequencing test was the first genetic test for SMEI and was developed by Australia-based Bionomics Ltd in collaboration with researchers based at the University of Melbourne and at the Adelaide Women's and Children's Hospital (13).
In September of 2004, Bionomics licensed their SMEI test to Athena Diagnostics, a U.S.-based diagnostic company focused on neurological genetic tests. According to the Bionomics press release, Athena Diagnostics was granted permission to market the test in to neurologists in North America and Japan. With more than 45 sales representatives in
the U.S. alone, Athena planned to provide the test to a group of more than 5,000
neurologists for whom they already performed diagnostic testing (12). The terms of the license called for an upfront payment by Athena, as well as "milestone payments linked to sales targets and royalty payments on net sales" (10). Later, in November of 2004, Bionomics reached another SMEI-related agreement, this time with Australia-based Genetic Technologies Limited (GTG). Under the terms of this agreement, GTG was given permission to market worldwide through the Gendia laboratory network. Athena's test, which involves the detection of SCN1A sequence variations, is currently offered in the U.S. at a price of $3995.
Generally speaking, the majority of genetic diagnostic discoveries are made by academic institutions. It is not surprising, then, that Bionomic's SCN1A discovery came in collaboration with the University of Melbourne and at the Adelaide Women's and Children's Hospital. Indeed, such partnerships between academia and industry are common, as private companies benefit from government-funded R & D while academic institutions benefit financially when their patented tests are made commercial available. As another example such a partnership, Bionomics has since announced a diagnostic research collaboration with Emory University. According to a Bionomics press release, both Bionomics and Emory University "will jointly own the intellectual property arising from the epilepsy research while Bionomics, Inc. will have exclusive rights relating to the commercialization of that intellectual property" (11)
4.5 Diagnostic Test Pricing
Also relevant to our study is an understanding of the various factors which influence genetic test pricing. On the basis of a series of interviews with industry
executives, we found that both gene size and test methodology are very important factors in determining price, where increased size typically corresponds to increased price. Other important factors include pricing objectives for the test provider, external market factors (such as number of potential patients), R & D compensation and, as we
hypothesize, patent related royalties. An illustration of these influences can be seen below in FIG.4.
FIG.4: This diagram offers a very simplified illustration of the
factors which effect genetic test pricing.
5.0 Related Work
To date, no study has linked patents to genes and diagnostic tests. Past analyses regarding the impact of gene patents on genetic diagnostics have been limited primarily
to anecdotal evidence. As a result, there is little information regarding the extent to which gene patents effect genetic diagnostic test pricing and availability.
In 2003, Cho and a group of Stanford University researchers published a study on the topic of gene patents and genetic diagnostics (15). Cho et al surveyed 201 genetic laboratory directors via telephone with questions regarding the impact of gene patents of diagnostic testing. According to the study, 53 % of respondents reported that they had decided not to offer a genetic diagnostic test because of a patent or license, and 25%
reported that they had actually stopped offering a genetic diagnostic test because of a patent or license. The study also noted that most respondents had a negative perception of the role of patents on the price, availability and development of genetic tests but was
not designed to probe this relationship more deeply.
In 2005, a study by Kyle Jensen and Fiona Murray of MIT provided a
comprehensive map of the human genome patent landscape (5). This study linked gene patents, patent holders, and genome location, among other things. The study revealed that nearly 20% of the human genome has already been patented, and that a
disproportionately high number of those patents pertain to disease-related genes.
6.0 Methods
To begin this study, we first researched the genetic diagnostics industry. As mentioned in our background section, the primary challenges of this process were (1) understanding the market structure, (2) understanding the differences between diagnostic methodologies, (3) understanding the meaning and relevance of diagnostic CPT codes, and (4) understanding the heterogeneities of genetic diagnostic tests themselves. We also researched the history and extent of the gene patent landscape.
With a general understanding of the industry, we then created the framework for our database. Using the software written by our team, data was taken from the Gene Tests database and placed into a Microsoft Excel spreadsheet for analysis (see section 5.0
for more detail on this procedure). As a result, our preliminary database included information about each gene, disease and test provider in the Gene Tests database. The structure of our database is pictured below in FIG. 5 (note that CPT codes and prices are included here, although they were not included at this stage of the study). Each row, or entry, features a disease, a corresponding gene and a corresponding test provider. For example, if a given disease has 3 associated genes and there 3 test providers which test for this disease, there will be a total of 9 entries. Likewise, there will be 9 entries for a single gene which has 3 associated diseases and 3 test providers (maybe modify this statement).
In all, there were 7195 entries in this database, with 795 distinct diseases and 864 distinct genes. To eliminate faulty price comparisons between different test
methodologies, we decided to focus our study on tests for which at lease one U.S. test provider employs the full gene sequencing methodology. In addition, we decided to focus only on tests offered in the United States. To isolate this data subset, we sorted our preliminary database by methodology and test location. The resulting subset consisted of 832 entries, 364 distinct diseases and 377 distinct genes.
With this subset of data, we were then able to provide information about the availability of each test. This was accomplished by using Microsoft Excel to count the number of times that each test was repeated in the database, thus revealing the number of labs at which the test is available. A simplified sample of this modified database
(including CPT codes and pricing) is featured in FIG.4.
Disease Name Gene Test Provider CPT Codes Test Price
Johns Hopkins Hospital, DNA
Transthyretin Amyloidosis TR 83891 x 1, 83898 x 4.83904 x 8.
Transthyretin Amyloidosis TR Diagnostic Laboratory 83909 x 8. 83912 x I 662 APC-Associated Polyposis APC Baylor College of Medicine 83891 x 1. 83898 x 28, 83904 x 56, 1500
Conditions Medical Genetics Laboratory 83894 x 56. 83912 x 1
Multiple Endocrine Neoplasia RETGeneDx, Inc 83891 x 8 83898 x 8 83894x 8. 650
Type 2 83904 x 8, 83892 x 2. 83912 x 2
Familial Cerebral Cavernous CCM 83890 x 1. 83891 x . 83898 x 16. 1090
Malformation 1 CCMl PreventionGenetics 83904 x 16, 83894 x 1. 83914 x Familial Cerebral Cavernous 83890 x 1, 83891 x 1. 83898 x 10.
Malformation 2 CCM2 PreventionGenetics 83904 x 10. 83894 x 1. 83914 x 1 740
Familial Cerebral Cavernous CCM3 83890 x 1. 83891 x .83898 x 7. Malformation 3 83904 x 7, 83894 x 1. 83914 x 1
Rapid-Onset Dystonia ATPIA3 Massachusetts General Hospital 83891 x 1, 83898 x 2. 83904 x 2.
Parkinsonism / Harvard Medical School 83891 x I
MTTS1 -Related Hearing Loss and Harvard-Partners Center for 83891 x 1, 83894 x 1. 83898 x 2.
Deafness Genetics and Genomics 83904 x 3. 83912 x
FIG.5: Sample of genetic test database information
With our Excel database serving as a framework, our next challenge was to map each test to the corresponding CPT codes and prices. This was accomplished, in part, by searching through test provider websites for CPT code and price listings. A large portion of CPT code and pricing information was also collected through phone conversations
with test provider representatives. While accumulating prices and CPT codes, 39 of the 377 genes were eliminated from our study. In some cases, genes were eliminated because we were unable to find evidence of US-based full sequence testing. We also eliminated all mitochondrial genes from our study, leaving us with a group of 338 nuclear genes for which full sequencing testing is available in the US. [can you explain why?].
After collecting CPT code and pricing information, we then listed the number of patents associated with each gene in our database. To match genes to patents, we used a comprehensive gene patent database from a past study (5).
Our final database listed the following information for each entry: gene, number of gene patents, associated disease, number of laboratories (availability), laboratory (for particular entry), test price and CPT codes.
7.0 Design Component
For the design component of this project, we created a suite of software
comprising a set of Unix shell scripts and a Python program to extract information from the GeneTests Database and transfer the information into a Microsoft Excel Spreadsheet. This program, which was central to our database assembly, is designed so that it can also be used to update our database in the future as new tests are added to the GeneTests Database, or changes are made. Featured below is FIG.6 is a diagram which follows the flow of information from the GeneTests database to our Excel spreadsheet as generated by our software.
FIG.6: Diagram illustrating the flow of information as a result of
designed software. Note that the software, which consists of Unix shell
scripts and a Python program, can be used to update our database as
more tests are added to the GeneTests database.
For each entry listed in the GeneTests Database, our program extracted 34 unique sets of data, including the gene symbol, gene locus, associated protein, disease name, institution (test provider), and location of test provider. Although GeneTests is a publicly available source of information, the underlying data are not available to researchers in a batch download, nor are the data exposed via an Application Programming Interface (API). Therefore, we had to download each of the HTML-formatted pages on the GeneTests site and parse the data using a series of regular expression-based functions to match particular patterns and build a local database of tests.
GeneTests
Database
Local Computer
iRaw ata
: Shell Script
f
-Raw pw--a
Excel
Python . . . . ··· · .····. ·· f I- __ - --; ·
6.0 Results and Discussion
Our final database consists of the 338 nuclear genes for which US-based full sequence testing is available. Our pricing data comes from 51 institutions, with a large portion of data coming from GeneDx, Inc., Athena Diagnostics and the Baylor College of Medicine (-45 % of entries).
Most of our data analysis was done using a subset of this data: a group of 257
tests for which we have collected pricing information. Note that a group of tests differs
from a group of genes in that a group of tests includes both tests that correspond to one gene and tests that correspond to multiple genes (packaged tests). As a result, our group of 257 tests actually corresponds to 274 of the 338 nuclear genes for which US-based full sequence testing is available (81 %). Of the 257 tests, 246 are tests of a single gene (95.3 %), while 12 are packaged tests with multiple genes (4.7 %). In some cases, for a single test, pricing and CPT code information was collected from multiple laboratories. For these tests, we averaged our collected prices and used this averaged value as a single data point.
For tests not included in this subset, reasons for exclusion include: (1) inability to contact test providers, (2) unwillingness of test providers to reveal CPT codes and pricing information, and (3) cases where test relevance to dataset is still under review (for example, cases where it is still unclear whether full sequence testing is available).
Featured below is a table which summarizes the general results for several categories of data. The data subset used for this table is the group of 257 tests previously mentioned.
Data Table for 257 Tests (both Patented and Unpatented Tests)
Standard Maximum Minimum
Parameter (per Test) Average Deviation Value Value
Price (USD) $1378.95 $794.78 $5400 $126.50
#of Exons 14.5573123 13.54247 79 1
Price per Exon (USD) $144.05 $118.77 $925 $13.04
# of Genes per Test 1.08560311 0.468194 5 1
# of Exons per Gene 13.8196311 12.61522 79 1
# of Patents 1.31128405 2.589867 20 0
# of Test Providers 2.26459144 3.533328 40 1
FIG.7: Table ofaverages, standard deviations, maximum values and minimum values
from a group of data parameters collected during the study.
In addition, we have summarized our data for tests with associated patents and tests without associated patents. These data summaries can be seen in FIG.8 (Patented Tests) and FIG.9 (Unpatented Tests). Note that both datasets come from our list of 257 sets, where the patented data contains 121 tests and the unpatented data comes from 136 tests.
Data Table for Patented Tests (121 entries)
Standard Maximum Minimum Parameter (Per Test) Average Deviation Value Value
Price (USD) $1419.58 $858.02 $5400 126.50
# of Exons 15.0336134 14.42745 79 1
Price per Exon (USD) $147.42 $129.44 $925 $31.65
# of Genes per Test 1.10743802 0.513187 5 1
# of Exons per Gene 13.7957983 12.62964 79 1
# of Patents 2.78512397 3.189061 20 1
# of Test Providers 2.33057851 3.364987 32 1
FIG.8: Table of averages, standard deviations, maximum values and minimum vahlies
Data Table for Unpatented Tests (136 entries)
Standard Maximum Minimum Parameter (Per Test) Average Deviation Value Value
Deviation Value Value
Price (USD) $1330.31 $733.75 $3995 $300
# of Exons 14.1343284 12.74492 67 1
Price per Exon (USD) $141.07 $108.83 $795 $13.04
# of Genes per Test 1.06617647 0.425175 5 1
# of Exons per Gene 13.840796 12.64975 67 1
# of Patents 0 0 0 0
# of Test Providers 2.20588235 3.688054 40 1
FIG.9: Table of averages, standard deviations, maximum values and minimum values
from a group of data parameters collected for unpatented tests.
One result that stands out from these data is the difference in price of patented vs. unpatented tests. Our results show that the average price of an unpatented test is
$1330.31, while the average patented test price is $1419.58, an average difference of almost $90. Our data also shows a difference in the average price per exon for patented and unpatented tests. The average price per exon for unpatented tests is $141.07, compared to $147.42 for patented tests.
With regard to CPT coding, FIG.8 below shows the frequency with which particular diagnostic CPT codes are used. The first column lists the diagnostic CPT codes originally listed in FIG.2, and the second column lists the number of tests which use each CPT code from our group of 257 tests.
CPT Code Number of Tests which Use Code 83898 224 83904 219 83912 215 83891 180 83894 130 83892 72 83890 62 83903 13 83902 5 83901 2 83896 1 83893 0 83895 0 83897 0 83905 0 83906 0
FIG. 10. Table of diagnostic CPT codes which indicates
the number of tests which use each code. Note that this
list is not comprehensive, as unlisted CPT codes are used
for genetic diagnostic testing in some cases.
This table indicates that certain diagnostic CPT codes are used much more
frequently than others. CPT codes 83898, 83904, 83912, 83891, and 83894 used in more 50 % of tests, while CPT codes 83893, 83895, 83897, 83905 and 83906, are not used in any tests.
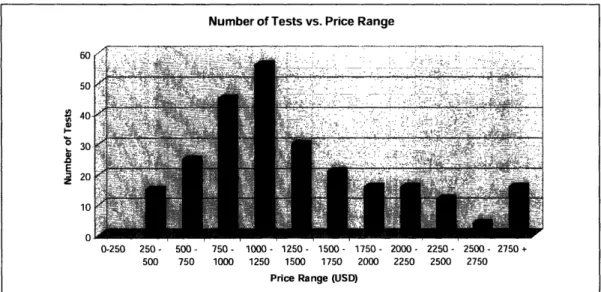
General Test Pricing and Availability Data
For the group of 257 tests for which we collected pricing information, we found the average test price to be $1378.95. As seen below in FIG.11, when sorted as a
histogram in increments of $250, the largest portion of tests falls in the $1000-$1250 range.
FIG. 11: This figure shows the number of tests for each price range. The data comes
from the subset of 257genetic tests for which pricing information has been collected.
In terms of test availability, we found that more than half of all tests are offered by one lab (57%), and that this percentage decreases steadily as the number of
laboratories increases. FIG. 11 below illustrates these data in the form of a pie chart. We also found that the average test is offered by 2.27 laboratories, with a range from 1 to 40.
Number of Tests vs. Price Range
I-. E z 0-250 250- 500- 750- 1000- 1250- 1500- 1750- 2000- 2250- 2500- 2750 + 500 750 1000 1250 1500 1750 2000 2250 2500 2750
Price Range (USD)
.i
Percentage of Tests Offered by X Laboratories
1 57%
1st Value: Number of Labs for a Particular Test 2nd Value: Percentage of Tests
FIG.12: This figure shows the percentage ofgenetic tests offered for by a given number
of labs. The data set for this graph is the list of 257 unique gene tests for which pricing
information has been collected.
Of these tests, we found six tests for which full sequence testing is available at ten or more laboratories. FIG. 13 below provides information for each of these popular six tests, including the number of laboratories (test providers), the number of associated patents, the gene symbol, and the associated disorder(s). Note that three of these tests have one associated patent while the other three are unpatented.
4 5
_ _ po/n
6+ 5%
;su Dir~Ifs i. -..:: .I i
FIG.13: This table provides information about the 6 most widely available genetic
diagnostic tests from our group of 257 tests.
Patents and Test Pricing
As mentioned above, we found the average price for patented tests to be
$1419.58, compared to $1330.31 for unpatented tests. In addition, we found the average price per exon for patented and unpatented tests to be $147.42 and $141.07 respectively. To take a closer look at these data, we plotted separate histograms the number of tests vs. test price range (sorted in increments of $250) for patented tests and unpatented tests. These plots can be seen in FIG.14 and FIG.15 below.
Patented Tests - Number of Tests vs. Price Range t-o E z 0-250 250- 500- 750- 1000- 1250- 1500- 1750- 2000- 2250- 2500- 2750+ 500 750 1000 1250 1500 1750 2000 2250 2500 2750
Price Range (USD)
FIG. 14: This histogram shows the number of patented tests for each price range in
increments of $250. Like the histogram for all 257 tests, the largest category is the
$1000-$1250 range.
FIG. 15: This histogram shows the number of unpatented tests for each price range in
increments of $250. When compared to the patented test histogram, we can see that in
the unpatented test histogram the three categories that span the $250-$1000 price range
each have a higher number of entries. It should be noted; there are 15 more unpatented
tests overall.
Unpatented Tests - Number of Tests vs. Price Range
Number of Tests
0-250 250- 500- 750- 1000- 1250- 1500-1750-2000-2250 -2500- 2750 500 750 1000 1250 1500 1750 2000 2250 2500 2750 +
Price Range (USD) i;.. ..-- .. ... ..
When sorted by number of patents, the averaged test price values support a correlation between patents and test pricing. In FIG. 16 below, we can see the average price for tests with each number of associated patents, along with the corresponding standard deviation for each of those averaged values.
Test Price vs. Number of Patents
4500 4000 , 3500
2,
3000 - 2500 CL w 2000 t 1500 1000 500 0 0 1 2 3 4 5 6+ Number of PatentsFIG.16: This histogram shows the relationship between the number of associatedgene
patents and test price. The error bars represent one standard deviation in each direction.
Similarly, FIG. 17 shows the average price per exon for tests with each number of associated patents, along with the corresponding standard deviation for each of those averaged values. Here, however, the relationship between price per exon and number of
patents is not particularly apparent, despite the overall difference that exists for the average price per exon for unpatented and patented tests.
Price Per Exon vs. Number of Patents
450 ... Ill..----
.
400 ' 350 (dA - 300 " 250 a. 200 ·, 150 a-m 100 ,' 50 0 -50 Number of PatentsFIG.17: This histogram shows the relationship between the number of associated gene
patents and the price per exon. The error bars represent one standard deviation in each
direction.Gene Size and Price
Our results also indicate that test prices increases as a result of increased gene size (number of exons). This result is predictable given that each sequenced exon requires an additional set of procedures which takes additional time and costs additional money for test providers. FIG. 18 below demonstrates this relationship with a graph of test price vs. number of exons for our group of 257 tests.
i i i
FIG. 18: This graph demonstrates
the relationship between test price and number of
exons. As shown, the applied best fit line has a slope of-40.
As we would expect, this result is consistent with data taken exclusively from Athena Diagnostics. As seen in FIG.19 below, this group of 49 Athena Diagnostics tests shows a similar trend to that of the entire dataset.
Test Price vs. Number of Exons
r-nnn 5000 5' 4000 .o 3000 L. T 2000 1000 0 0 10 20 30 40 50 60 Number of Exons r]. t,. ·:;;:- - ":: ··i;·:. ···i··;·2 i " · ··: · ·--s ·'· r·,..··- ·[ . .:.· 70 80 90
Athena Diagnostics - Test Price vs. Number of Exons A An 4:uu 4000 -3500 3000 a V) a 2500 ., X 2000 VI 1500 1000 500 -0
E-. --.-mm e. e -_Ja._.-._ ?mWW.:...-.-4.::- .~ ", ,-j' ^ ./....'/ i...: '. '!. X ' I:,,:;'- "?. . ~' ' -- ...-,,,,,,2'k , .' ~...--?_ . .... . ... M. .. ' _ .,_ ,,_vI,,____,,_ ~,_ ,,,,_ < .... ._... _< __L__=_ _1;;1,' v! >- <, , , , ,
_ Vowl el{{w -~~~r-:--·T~":·~- ... .-:.. -- .. . . .. . . .. . .
12
.... ... ... ... .... .... . ...
· '.' .;...- .'.°.:" "'! ". m'.:.i:-AA_ ,,, !.%3~{...{-X"':..!.!'..:.;.?j..¢ '.lc:.j''i:i%.>i:? t..'!;?-SA , :,i..,.",,,% : ",, ,. .'..;"3.1: ... ':... .,-i ...;... =-'... '...:.':. M''.V"...:
A .'" ."Y'e, /.~.'...~ ." , '"W . '."' ""-' '
,~~
~ ~ ~~:··:""~-~~:~'
-·.··-'
'.'":i".:'i··
.:;'
.. '
'~·t I~
"
.
<:..~.%,::
~.' .'
.. :./".. :."~"i '".".
I?~:¢"-~-~~~
...
,,~¢..
.,:".r'''?~.~.'..'.
..:~..¢2-
~
.
:
'
~'x
;-.'
i'.
.'-.;~...~-". ..";...:.
''
:::"
:..'='-
~.'...,
a -.. *~~·· · · ;···· ....·r. '.U~~~~~~~~'j; ' .* ' : ..- '17' r:
'"" ,':;:i-':{~'{~""'.:,~-~~.¥ " - ' * '~~~~-~~~.'I'-..'; ~"..{i:;i~;; ' 2 :' . :' :
. ii. "::;.."' ;
-''':;" . ";:::'.";"..1-.~''"
-2
0
0
.
FIG. 9: This graph shows that for the of 49 tests at thena Diagnostics, larger genes in
terms of number of exons) tend to correspond to more expensive tests. These results are
consistent with that of the entire dataset.
Economies of Scale
We have also found that for a given test, the price per exon tends to decrease as the number of exons increases. This result can be seen in FIG.20 below, which represents data from our list of 257 tests for which we collected pricing information.
:;·:: · ··· ,: ····;p·...···r::-.i·j
···. :il-· ;
·· ,;. -· r·i'-; ·,;·· i;."·
,'lri:) ;; .i.;-..···:· ·· ···J .cir·. ··-·.· :···'· "·- ··· r·";,: · Igal :··" :-·· ··:;:·:--;r ·-."-'--·;,.. · · r ;s: "ls;·": I-i. *;"·g*i;;k·-'_"·:·I ;ai::i . ':·.:.* 2
·x,-i·.·...··-.Z--:---q·sl:;·Ldrs:,,e ;I*-i:*x. .: *··: ; I· - -:-L··
c:-:f-·-:-:::,:·:·.---,.P ::.-P·;--'· .-·j ·II; · ·- I-i·,r :·;.· , . . , , 0 10 20 30 40 50 60 70 Number of Exons
Price Per Exon vs. Number of Exons I U ' qnn
...
.'
':' :'-~"..."1
"-"
=' M a.5714
9...."'.:..x.-...,
5
1
.
800 700 i 600 t 500 400 300 200 100 0 70 80 90 0 10 20 30 40 50 60 Number of ExonsFIG.20: This graph shows the relationship between the price per exon and the total
number of exons for full gene sequence tests. As we can see, the price per exon tends to
decrease as the number of exons to be sequenced increases.
Again, this result is consistent with the Athena Diagnostics dataset. As seen in FIG.21 below, this group of 49 Athena Diagnostics tests shows a similar trend to that of the larger dataset.
I nf"
Athena Diagnostics - Price Per Exon vs. Number of Exons
FIG.21: This graph shows the relationship between price per exon and number of exons
for a set of 49 tests offered at Athena Diagnostics. Similar to the data the entire group of
tests, these data show a trend whereby price per exons decreases as the number of exons
increases.
Laboratory Consistency
In addition, we have collected multiple data points for several of the genes in our database. For these genes, where pricing and CPT codes are listed from multiple
laboratories, we were able to analyze the consistency of pricing and CPT coding across laboratories.
To study test price and procedure consistency across laboratories, we focused on the 4 four genes for which we collected the most information: MECP2, PTPN11, GJB2, and LMNA.
For the MECP2 gene, we collected pricing information from 5 laboratories and found a price range from $925 to $1092. The average of these prices is $1022.77, with a standard deviation of $70.39. For the PTPN11 gene, data was collected from 4
laboratories, with a price range from $1750 to $950. The average of these prices is $1287.5, with a standard deviation of $402.85. For the LMNA gene, we collected pricing
900 800 700 C 600 0 x W s 500 0. e cr 400 300 200 100 0 0 10 20 30 40 50 60 Number of Exons
I-n -I~"
~
"~ ~ ~ ~ ~
--- I~~~ ~1"~"~~1___~1...
~`'"
. . .... . ... . . ... .... ... ... ... .information from 5 laboratories and found a price range from $575 to $1009. The average of these prices is $814.75, with a standard deviation of $186.56. Lastly, data taken from 6 laboratories for the GJB2 showed more consistent results, with a price range from $290 to $450, an average of $367.67, and a standard deviation of $68.30.
These results illustrate the highly varied nature of test pricing across laboratories. For the four genes studies, our results indicate an average range of -$390 and an average standard deviation of -$182.
CPT coding also seems to be highly varied across laboratories. This concept can be seen in FIG.X, where the CPT codes for five test providers are drastically different for
the MECP2 full gene sequencing test.
FIG.22: This chart shows the variations in CPT coding and pricing for the full
sequencing test of the MECP2 gene. We can see that for this test CPT coding is
particularly varied. As shown, each of the five test providers differ in terms of CPT codes
used and number of repetitions per code.
7.0 Conclusions
Overall, our data indicate that there is a correlation between increased gene-based patents and increased genetic diagnostic test pricing. From our dataset of 257 U.S.-based full sequence genetic tests, we found the average price for patented tests to be $1419.58 and the average unpatented test price to be $1330.31. In addition, we found the average price per exon for patented and unpatented tests to be $147.42 and $141.07 respectively.
There are several ways in which our study can be improved in the future. To begin with, we can collect more pricing data per test in order to make our pricing values more reliable. As seen in our "Laboratory Consistency" results section, there is a great
deal of variability both in pricing and CPT coding across laboratories. With more data for each test we may see more consistency in our results. Another potential improvement may come from determining which gene-based patents actually generate royalties
through diagnostic-related licensing. Although our list of gene patents tells us how many times each diagnostic-related gene has been patented, applying a more refined list of royalty-generating diagnostic gene patents may yield more consistent results as well.
References
1. Keefer, CM. (1999). "Bridging the Gap Between Life Insurer and Consumer in the Genetic Testing Era: The RF Proposal." The Indiana Law Journal, 74(4), Fall 1999.
2. GeneTests website, Educational Materials section. (revised 2004). "What is Genetic Testing?" [Updated 3-19-04, Cited 4-12-06]. Available from
<http://www.genetests.org>.
3. Westphal, Sylvia Pagan. (2005). "Human Gene Patents 'Surprisingly High,' A New Study Shows ." The Wall Street Journal, Oct 13, 2005
4. Merz, Jon F., et al. (2002). "Diagnostic Testing Fails the Test." Nature. Vol. 414, February 7, 2002.
5. Jensen K. and Murray F., "Intellectual Property Landscape of the Human Genome."
Science, Vol 310, Oct. 14, 2005.
6. Secretary's Advisory Committee on Genetics, Health and Society. (2005) "Coverage and Reimbursement of Genetic Tests and Services (Draft Report)." April 2005.
7. United States Patent and Trademark Office. Patent no. 6709817. Available from <http://uspto.gov>.
8. GeneDx company website. [Cited on 4-19-06]. Available from <http://www.genedx.com>.
9. Williams-Jones, Bryn. (2002). "History of a Gene Patent: Tracing the Development and Application of Commercial BRCA Testing." Health Law Journal, 2002.
10. Bionomics Ltd press release. (Sept. 27, 2004). "Bionomics Licenses Epilepsy Test." Available from <http://www.bionomics.com.au/news_detail.asp?ReflD=184>.
11. Bionomics Ltd press release. (Sept. 20, 2004). "Bionomics Strengthens United States Presence." Available from
<http://www.bionomics.com.au/news_detail.asp?ReflD= 183>
12. O'Neill, Graeme. (2004). "Boston's Athena Diagnostics to Market Bionomics Epilepsy Test". Australian BiotechnologyNews, September 27, 2004.
13. Bionomics Ltd 2004-2005 annual report. Available fromn
14. Wheaton Partners, LLC, CodeMap Complience Briefing (4--02-04). Available from <http://www.codemap.com/2004/content.cfm?d=04/02/2004%20Genetic%20Testing%20 Codes%20I&id= 1610>
15. Cho, M. et al. (2003). "Effects of Patents and Licenses on the Provision of Clinical Genetic Testing Services." Journal of Molecular Diagnostics, Vol. 5, No. 1, February 2003