Continuous Assessment of Epileptic Seizures with
Wrist-worn Biosensors
by
Ming-Zher Poh
Bachelor of Science in Electrical and Computer Engineering
Cornell University (2005)
Master of Science in Electrical Engineering and Computer Science
Massachusetts Institute of Technology (2007)
Submitted to the Harvard-MIT Division of Health Sciences and Technology
in partial fulfillment of the requirements for the degree of
ARCHIVES
Doctor of Philosophy in Electrical and Medical Engineering OMASSACHUSETTINTUE OF TECHNOLOG Y
at the
MASSACHUSETTS INSTITUTE OF TECHNOLOGY
SEP
2 1 2011
September 2011
L
LWBRARIES
@
Massachusetts Institute of Technology 2011. All rights reserved.
A u th o r ...
...
Harvard-MIT Division of Health Sciences and Technology
September 2011
C ertified by ...
Rosalind W. Picard
Professor of Media Arts and Sciences
Thesis Supervisor
x%~J
A ccepted by ...
...
Ram Sasisekharan
Director of Harvard-MIT Division of Health Sciences and Technology
Continuous Assessment of Epileptic Seizures with Wrist-worn Biosensors
by
Ming-Zher Poh
Submitted to the Harvard-MIT Division of Health Sciences and Technology on September 2011, in partial fulfillment of the
requirements for the degree of
Doctor of Philosophy in Electrical and Medical Engineering
Abstract
Epilepsy is a neurological disorder characterized predominantly by an enduring predisposi-tion to generate epileptic seizures. The apprehension about injury, or even death, resulting from a seizure often overshadows the lives of those unable to achieve complete seizure con-trol. Moreover, the risk of sudden death in people with epilepsy is 24 times higher compared to the general population and the pathophysiology of sudden unexpected death in epilepsy
(SUDEP) remains unclear. This thesis describes the development of a wearable
electro-dermal activity (EDA) and accelerometry (ACM) biosensor, and demonstrates its clinical utility in the assessment of epileptic seizures.
The first section presents the development of a wrist-worn sensor that can provide comfortable and continuous measurements of EDA, a sensitive index of sympathetic activity, and ACM over extensive periods of time. The wearable biosensor achieved high correlations with a Food and Drug Administration (FDA) approved system for the measurement of EDA during various classic arousal experiments. This device offers the unprecedented ability to perform comfortable, long-term, and in situ assessment of EDA and ACM.
The second section describes the autonomic alterations that accompany epileptic seizures uncovered using the wearable EDA biosensor and time-frequency mapping of heart rate vari-ability. We observed that the post-ictal period was characterized by a surge in sympathetic sudomotor and cardiac activity coinciding with vagal withdrawal and impaired reactivation. The impact of autonomic dysregulation was more pronounced after generalized tonic-clonic seizures compared to complex partial seizures. Importantly, we found that the intensity of both sympathetic activation and parasympathetic suppression increased approximately lin-early with duration of post-ictal EEG suppression, a possible marker for the risk of SUDEP. These results highlight a critical window of post-ictal autonomic dysregulation that may be relevant in the pathogenesis of SUDEP and hint at the possibility for assessment of SUDEP risk by autonomic biomarkers.
Lastly, this thesis presents a novel algorithm for generalized tonic-clonic seizure detec-tion with the use of EDA and ACM. The algorithm was tested on 4213 hours (176 days) of recordings from 80 patients containing a wide range of ordinary daily activities and detected
15/16 (94%) tonic-clonic seizures with a low rate of false alarms (<; 1 per 24 h). It is
antic-ipated that the proposed wearable biosensor and seizure detection algorithm will provide an ambulatory seizure alarm and improve the quality of life of patients with uncontrolled tonic-clonic seizures.
Thesis Supervisor: Rosalind W. Picard Title: Professor of Media Arts and Sciences
Thesis Committee
Thesis Supervisor
Rosalind W. Picard, Sc.D.
Professor of Media Arts and Sciences Massachusetts Institute of Technology Thesis Chair
John V. Guttag, Ph.D.
Dugald C. Jackson Professor of Computer Science and Engineering Massachusetts Institute of Technology
Thesis Reader
Richard J. Cohen, M.D., Ph.D.
Whitaker Professor in Biomedical Engineering Massachusetts Institute of Technology
Thesis Reader
Tobias Loddenkemper, M.D. Assistant Professor of Neurology Harvard Medical School
Acknowledgments
"Many are the plans in a person's heart, but it is the LORD's purpose that will prevail." Proverbs 19:21
Upon re-reading my graduate school statement of intent written six years ago, I realized how different my experience ended up being compared to what I had envisioned it to be. The beginning was rough as I struggled with work and a sense of emptiness despite being admitted into the Ph.D. program of my dreams. But I soon learned that true satisfaction and joy can only come from the Lord for He is the one who gives meaning and purpose to my life. By God's grace, my overall experience at MIT has been fantastic, one that has certainly helped me grow in many ways. So above all, I thank God for guiding me every step of the way, and for all the blessings in my life.
I want to express my deepest gratitude to my supervisor, Prof. Rosalind Picard, for being such an amazing mentor. It was Roz who gave me the opportunity to enter to wonderful, wacky world of the Media Lab. She trusted me from the very beginning and gave me so much freedom to explore and pursue ideas that interested me. Furthermore, Roz was always happy to share her godly wisdom and to support me in prayer. I couldn't have asked for a better advisor.
I am sincerely grateful to my thesis committee including Prof. John Guttag, Prof. Richard Cohen and Dr. Tobias Loddenkemper for helping me improve and achieve my research goals. John kindly chaired the committee and was a constant source of encourage-ment and advice. Richard brought along insight and expertise in physiologic signal analysis. Tobi was my primary collaborator at Children's Hospital who was a joy to work with and he taught me so much about epilepsy.
I would like to thank my other collaborators who contributed greatly to this work. In
particular, Dr. Claus Reinsberger for performing the video-EEG analysis and teaching me about the autonomic nervous system, Dr. Eun-Hyoung Park for setting up and maintaining the data transfer process, Lolli Fleming for handling all the IRB issues and Dr. Joseph Madsen for helping us get the study up and running at Children's Hospital.
I'm grateful to all my labmates from the Affective Computing group. In particular, I thank Hyungil Ahn for showing me the ropes from day one, Yuta Kuboyama for being a great friend and sharing lunch breaks, Ehsan Hoque for improving my ping-pong skills,
Kyunghee Kim for helping me with the Heartphones project, Javier Hernandez for sharing his knowledge on SVMs, and Daniel Bender for being an awesome group administrator. I'm grateful to Daniel McDuff for his friendship and happy that we ended up as roommates and labmates. I'm also thankful to Jackie Lee for his encouragement as we worked towards completing our theses and defences together, as well as for his infectious entrepreneurial spirit. It's been a pleasure to get to know Rana el Kaliouby, Matthew Goodwin, Richard Fletcher, Shani Daily, Hoda Eydgahi, Micah Eckhardt, Rob Morris, Elliott Hedman and Akane Sano. I thank the Media Lab community as a whole, for creating a family-like atmosphere and making the lab one of the best places to work at.
Special thanks to the UROPs I've had the privilege of mentoring including Nicholas Swenson, Shubhi Goyal, Mangwe Sabtala and Andrew Goessling. In particular, Nick always was eager to learn and full of enthusiasm in his work.
Graduate school can be such a lonely experience without friends. So I'm thankful for all my friends at MIT including my HST mates Sukant Mittal, Yongkeun Park, Euiheon Chung and Benjamin Diop. Sukant and I went through the ups and downs of graduate life together and I'm glad to have a friend like him. My friends from the GCF have been a tremendous source of support. In particular, I thank Adekunle Adeyemo, Samuel Perli, David Kwabi, John Lee, Po-Ru Lo, Daniel McDuff, Eric Jones, Sze Zheng Yong and Louis Tee for being like brothers to me.
I cannot fully express how grateful I am for my parents. Mum and Dad have always
been there to encourage me and never stopped praying for me. This thesis is dedicated to them in recognition of their love and support all these years. I thank my sisters, Jen and Lisa for cheering me on all the way. Lastly, my deepest thanks goes to Yukkee, who shared my burdens, gave me confidence and more importantly, for being a loving wife. I love you.
Contents
1 Introduction 1.1 E pilepsy . . . . 1.1.1 Seizures . . . . 1.1.2 Treatment of Epilepsy . . . . 1.1.3 Mortality in Epilepsy . . . . 1.2 Sudden, Unexpected Death in Epilepsy . . . . 1.2.1 Risk Factors and Pathophysiology of SUDEP . . . 1.3 Seizure Prediction and Detection . . . . 1.3.1 Seizure Detection Using Wearable Biosensors . . .1.4 O verall Aim s . . . .
1.5 Thesis outline . . . .
2 Autonomic Alterations in Epilepsy
2.1 Autonomic Nervous System . . . .
2.2 Heart Rate Variability . . . . 2.2.1 Regulation of Heart Rate Variability as a Predictor 2.2.2 Potential Autonomic Mechanisms in SUDEP . . . 2.3 Electrodermal Activity . . . . 2.3.1 Electrodermal Activity in Epilepsy . . . .
. . . .
of Sudden Death
3 A Wearable Electrodermal Activity and Accelerometry Biosensor 3.1 Introduction . . . . 3.2 Related Work . . . . 3.3 System Design . . . . 3.3.1 Circuit Design . . . . 23 . . . . 23 . . . . 24 . . . . 24 . . . . 25 . . . . 25 . . . . 26 . . . . 28 . . . . 29 . . . . 30 . . . . 31 33 33 34 34 36 37 38 41 41 43 44 44
3.3.2 Sensor Module . 3.3.3 Packaging . . . . 3.4 Experimental Methods . . . . 3.4.1 Participants . . . . 3.4.2 Physiological Measurements . . . . 3.4.3 Physical Task . . . . 3.4.4 Cognitive Task . . . . 3.4.5 Emotional Task . . . . 3.4.6 Long-term In Situ Experiment . .
3.4.7 Data Analysis . . . .
3.5 R esults . . . . 3.5.1 EDA Increases During Stressor Tasi
3.5.2 Recordings of Proposed System are Highly Accurate
Correlated with FDA System . . . .
3.5.3 Distal Forearm is a Viable EDA Recording Site . . . . 3.5.4 Long-term In Situ EDA Recordings Reveal
Arousal . . . .
3.6 Discussion . . . . 3.7 Conclusion . . . .
4 Autonomic Footprints of Epileptic Seizures
4.1 Introduction...
4.2 Experimental Methods . . . . 4.2.1 Patients and Seizures . . . .
4.2.2 Wearable EDA Biosensors . . . .
4.2.3 Recordings . . . . 4.2.4 EEG Analysis . . . . 4.2.5 EDA Analysis . . . .
4.2.6 ECG Analysis: Time-frequency Mapping of Heart Rate Variability .
4.2.7 Statistical Analysis . . . .. . .. . 4.3 R esults . . . .. - -. .. .. . - - .. and Strongly Patterns in Autonomic . . . . . . . . . . . . . . 57 . - - . . . - . . . . 58 . . . . 61 63 . . . . 6 3 . . . . 6 5 . . . . 6 5 . . . . 6 5 . . . . 6 6 . .. . . . . . . 6 6 . . . . 66 . . . - - . . - - - - . - 47 . . . - . 49 . . . .- . .- - - - 49 . . . . 50 .. . . . . 51 . . . .- - - - . . . . . 51 . . . . 52 . . . . 52 .. . . . .- - - . . .- - . 52 . .. . . . . 52 ks . . . . . . 52
4.3.1 Autonomic Footprints Reveal Critical Window of Severe Imbalance after Tonic-Clonic Seizures . . . . 4.3.2 Comparison Between Complex Partial and Generalized Tonic-Clonic
Seizu res . . . . 4.3.3 Correlations Between Heart Rate, Sympathetic EDA and
Parasym-pathetic HF Power . . . . 4.3.4 Magnitude of Autonomic Imbalance in Tonic-Clonic Seizures is Strongly
Correlated with Post-Ictal Generalized EEG Suppression . . . .
4.3.5 Binary Outcome Analysis for Prolonged Post-Ictal EEG Attenuation 4.4 D iscussion . . . .
5 Convulsive Epileptic Seizure Detection Using Electrodermal Activity and Accelerometry
5.1 Introduction . . . . 5.2 Related W ork . . . .
5.3 Methods ... .. .. ... .. .
5.3.1 Wearable EDA and ACM Biosensor
5.3.2 Patients and Seizures...
5.3.3 EEG/ACM/EDA Analysis . . . .
5.3.4 Seizure Detection Architecture.. . .. 5.3.5 Data Reduction ...
5.3.6 Feature Extraction...
5.3.7 Support Vector Machines . . . .
5.3.8 Model Selection and Testing Methodology
5.4 R esults . . . .
5.4.1 Performance Comparison of Seizure Detection Modes . . . . 5.4.2 Physiological Signal Fusion Improves Performance . . . . 5.4.3 False Alarms in Patients with No GTC Seizures . . . . 5.5 D iscussion . . . . 6 Conclusions
6.1 Thesis Contributions . . . .
6.2 Other Relevant Contributions . . . .
85 .. . . . . . . . 85 . . . . 88 . . . .. . 90 . . . . 90 . . . . 90 . . . . 91 . . . . 91 . . . . 91 . . . . 93 . . . . 97 . . . . 98 102 102 103 104 105 111 111 113
6.3 Future W ork . . . . 114
6.3.1 Home-based, Ambulatory Studies. . . . . . . . . . 114
6.3.2 Off-line Seizure Detection and Classification . . . . 114
6.3.3 Detection of Complex Partial Seizures/Subclinical Seizures . . . . . 115
6.3.4 Responsive, Closed-Loop Devices . . . . 115
6.4 O utlook . . . . 116
A Supplementary Information on Design and Evaluation of Wearable
Biosen-sor 117
B Supplementary Information on Clinical Study 123
C Supplementary Information on Autonomic Footprints of Epileptic Seizures127 D Supplementary Information on Convulsive Epileptic Seizure Detection 137
List of Figures
1-1 Outline of thesis aims. . . . . 31 3-1 (A) Circuit for EDA measurements. Computed profiles for the (B) voltage and (C)
current flow across skin for a range of typical skin conductance values. . . . . 45
3-2 Overview of the EDA sensor system architecture. The device is capable of recording measurements onto an on-board
Bash
memory card (data logging), wirelessly trans-mitting data to a remote site (data forwarding) and performing real-time analysis (data processing). . . . . 463-3 EDA sensor module. The device has a modular design and is shown with an optional
radio transceiver mounted on top. . . . . 47
3-4 The wearable EDA sensor. (A) Final packaging in an attractive and inconspicuous wristband. (B) Disposable Ag/AgC electrodes attached to the underside of the wristband. (C) The wearable EDA sensor can be worn comfortably on the wrist for long periods of time and during daily activities. . . . . 48
3-5 The experimental setup. Measurements were recorded from (I) right fingers with the Flexcomp system, (II) left fingers with the proposed sensor module, (III) right distal forearm with the proposed sensor module using Ag/AgC1 electrodes and (IV) left distal forearm with the proposed sensor module using conductive fabric electrodes. 50 3-6 Example of a slide for the Stroop word-color matching test . . . . 51 3-7 EDA waveforms during (A) physical activity, (B) cognitive stressors and (C)
emo-tional stressors (a horror movie clip). Measurements were recorded from (I) right fingers with the Flexcomp system, (II) left fingers with the proposed sensor module,
(III) right distal forearm with the proposed sensor module using Ag/AgCl electrodes
and (IV) left distal forearm with the proposed sensor module using conductive fabric electrodes. . . . . 53
3-8 Distributions of correlation coefficients between EDA measurements from bilateral fingers (I and II in Fig. 4) under (A) physical (n = 13), (B) cognitive (n = 15)
and (C) emotional (n = 13) stressors. Each experiment was separated into baseline, task and recovery conditions for correlation. The median values of the correlation coefficients, fr, are also presented for each condition. . . . . 54
3-9 Accuracy of the proposed sensor in fixed resistance measurements. Error bars rep-resent 1 S.D. Inset: Computed sensitivity of the proposed sensor showing increasing
quantization error at higher EDA values . . . . 55
3-10 Distributions of correlation coefficients between EDA measurements from distal fore-arms (conductive fabric electrodes on the left distal forearm and Ag/AgCl electrodes on the right distal forearm) and ipsilateral lingers under (A) physical (n = 13), (B) cognitive (n = 15) and (C) emotional (n = 13) stressors. Each experiment was separated into a baseline, task and recovery conditions for correlation. The#edian values of the correlation coefficients, r, along with the performance indices (pro-portion of correlation coefficients geq 0.5), wr, are also presented for each condition. Dashed lines indicate r = 0.5. . . . . 56 3-11 Long-term in situ EDA recordings. Continuous skin conductance measurements
were recorded for seven days in a natural home environment. Daily EDA waveforms displayed are normalized (Scale bar on the right side indicates original values). . . 58
4-1 Long-term electrodermal activity (EDA) recordings obtained from a wearable biosen-sor. In this example of a 24 h continuous EDA recording from a single patient, four secondarily generalized tonic-clonic seizures (GTCS) were captured. Vertical red lines denote EEG seizure onset. Inset: The wearable biosensor consists of an incon-spicuous wristband with an integrated sensor module that can be worn comfortably for long periods of time and during daily activities. The underside of the wristband is shown to reveal standard dry Ag/AgCl electrodes used for EDA measurements. . 69
4-2 Histogram of the onset times for the complex partial seizures (CPS) and secondarily generalized tonic-clonic seizures (GTCS) in this study. The occurrence times for
4-3 Changes in autonomic activity after individual epileptic seizures. Examples of al-terations in electrodermal activity (EDA), R-R intervals (RRI) along with time-frequency mapping of the RRI during peri-ictal segments of 75 min. (A) A small increase of EDA is observed with a decrease in RRI (i.e. increase in heart rate) during this complex partial seizure (CPS). There is also a brief reduction of the high frequency spectral component (HF, 0.15 - 0.4 Hz) of RRI during the post-ictal period that reappears after approximately 5 min. (B) A large surge in EDA is visi-ble after this secondarily generalized tonic-clonic seizure (GTCS) accompanied by a drop in RRI. Note the reduction in RRI variability during the post-ictal period and the dramatic reduction of the high frequency power. Vertical red lines denote EEG seizure onset and offset. . . . . 72
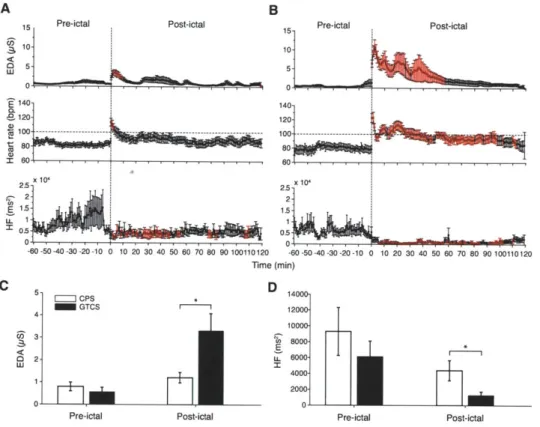
4-4 Autonomic footprints of epileptic seizures. High-resolution profiles of autonomic alterations computed every minute during a peri-ictal period of 3 h for (A) complex partial seizures and (B) secondarily generalized tonic-clonic seizures. Each post-ictal measurement epoch was sequentially compared to the baseline level taken as the average of the entire 60 min pre-ictal period. Epochs in red indicate statistical significance after accounting for multiple comparisons using the False Discovery Rate controlling procedure (p < 0.05; paired, two-sided Wilcoxon signed rank test). Post-ictal levels of EDA were higher for 9 min after complex partial seizures (n = 22).
Heart rate was also higher lasting 3 min (n = 16). HF power was continuously reduced for approximately 55 min (n = 16). Strikingly, the first 56 min after tonic-clonic seizures was associated with marked increases in EDA (n = 12) and heart rate (n = 10), as well as profound reduction in HF power (n = 10). Persistent tachycardia was observed for 40 min; heart rate and HF power levels recovered after 100 min. (C) EDA during the pre-ictal period was marginally similar between seizures (p = 0.05; Mann-Whitney-Wilcoxon test [MWW]), but was higher in tonic-clonic seizures during the first 60 min of the post-ictal period (p = 0.004; MWW).
(D) There was no difference in pre-ictal HF power between seizures (p > 0.5; MWW), whereas post-ictal HF power was lower in tonic-clonic seizures (p = 0.033; MWW). 73
4-5 Correlation coefficients between EDA vs HR and HF vs HR during the (A) pre-ictal and (B) post-ictal period of complex partial seizures. . . . . 75
4-6 Correlation coefficients between EDA vs HR and HF vs HR during the (A) pre-ictal and (B) post-ictal period of generalized tonic-clonic seizures. . . . .. 75
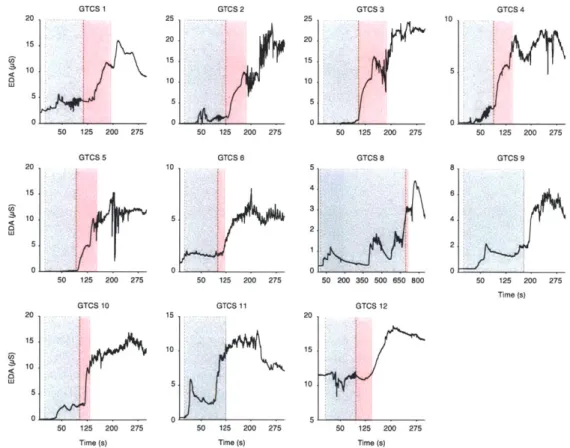
4-7 Post-ictal generalized EEG suppression (PGES) following a secondarily generalized tonic-clonic seizure. An example of a tonic-clonic seizure abruptly terminated and replaced by flattening of EEG signals in all channels. . . . . 76 4-8 Morphology of EDA changes relative to the onset/offset moments of PGES. The
gray shaded areas represent the ictal period while the red shaded areas correspond to PGES. Seizures 9 and 11 did not exhibit PGES upon termination. . . . . 77
4-9 Relationship between degree of post-ictal autonomic disturbance and post-ictal gen-eralized EEG suppression (PGES) in secondarily gengen-eralized tonic-clonic seizures
(GTCS). Scatter plots of PGES duration vs (A) EDA response amplitude, (B)
log-transformed area under rising portion of EDA curve and (C) maximum percentage HF power change. EDA response amplitude was strongly positively correlated with
PGES (Pearson r = 0.81,p = 0.003; n = 11), as was the area under rising portion of EDA curve (r = 0.83, p = 0.002; n = 11). The reverse direction of relationship was
observed for maximum percentage HF power change, which was strongly negatively correlated with PGES (r = -0.87, p = 0.002; n = 9). (D) The association between
EDA response amplitude and PGES in GTCS on a patient-specific level showed
close agreement in trends. Patient 2 had four GTCS events (top) and patient 5 had three GTCS events (bottom). (E) GTCS with higher SUDEP risk (PGES > 20 s) had a higher EDA response amplitude (p = 0.01; Mann-Whitney-Wilcoxon test [MWW]). (F) The maximum percentage decrease in HF power was greater in GTCS with higher SUDEP risk (p < 0.05; MWW). . . . . 78 5-1 Overview of seizure detection architecture. . . . . 92 5-2 Time-frequency mapping of the ACM signal during a tonic-clonic Seizure (63 s long).
The first 20 s do not contain much movement energy because the seizure starts off as a complex partial seizure before secondarily generalizing and affecting the motor cortex. The power distribution during the tonic clonic phase (after 20 s) is concentrated at frequencies above 2 Hz. . . . . 94
5-3 Example of recurrence plots for various events. Time series of net acceleration (top) along with the corresponding recurrence plot (bottom) during (A) a tonic-clonic seizure epoch (B) playing catch with a ball (C) shaking dice and (D) fapping hands. 95 5-4 Features extracted from a 10 s EDA epoch. Dotted line represents the least squares
line fit. Green circles indicate measurement points that were greater than the pre-vious point. Red squares indicate start and stop of the epoch. . . . . 97 5-5 ROC of the non-patient-speciic (blue circles) and semi-patient-specific seizure (red
squares) detectors. . . . .. 103 5-6 Semi-patient-speciic seizure detection performance. (A) Number of GTC seizures
detected per patient. (B) Number of false alarms per 24 h per patient. (C) Latency of detection for each GTC seizure. *Seizure 10 (Patient 4) was not detected by the algorithm . . . . . 104
5-7 ROC of the semi-patient-speciic seizure detector using solely ACM features (blue circles) and using both ACM and EDA features (red squares). . . . . 105 5-8 Histogram of False Alarm rates across 73 patients with no GTC seizures. .... 106 A-1 Layout of the EDA and ACM sensor board. . . . . 118 A-2 Individual EDA recordings of each participant during a physical task involving
cy-cling. Measurements were made from (I) right fingers with Flexcomp, (II) left fin-gers with MIT sensor, (III) right distal forearm with MIT sensor using Ag/AgCl electrodes and (IV) left distal forearm with MIT sensor using conductive fabric elec-trodes . . . . 119 A-3 Individual EDA recordings of each participant during a cognitive task including a
mental arithmetic test (MAT) and Stroop word-color matching test. Measurements were made from (I) right fingers with Flexcomp, (II) left fingers with MIT sensor, (III) right distal forearm with MIT sensor using Ag/AgCl electrodes and (IV) left distal forearm with MIT sensor using conductive fabric electrodes . . . . 120 A-4 Individual EDA recordings of each participant during an emotional task consisting
watching a horror movie clip. Measurements were made from (I) right fingers with Flexcomp, (II) left fingers with MIT sensor, (III) right distal forearm with MIT sensor using Ag/AgCl electrodes and (IV) left distal forearm with MIT sensor using conductive fabric electrodes . . . . 121
B-I Data collection from patients with epilepsy staying at the long-term monitoring unit at Children's Hospital Boston. Continuous video, electroencephalographic (EEG), electrocardiographic (EKG), electrodermal activity (EDA) and 3-D accelerometry
(ACM) recordings were obtained throughout the stay. Patients were not constrained
to remaining in the bed as the EEG recording system was ambulatory (backpack). Video frames shown depict patients wearing the wrist-worn biosensors and perform-ing a variety of daily activities . . . . 124 B-2 Summary of data collected from clinical study performed from Jan to September
2009. (A) 94 patients were enrolled and 80 provided over 12 hours of complete EDA and ACM recordings. (B) Due to a server crash, only 64% of those patients
had complete EEG-EKG-video recordings. (C) 11 patients experienced at least one complex partial seizure (CPS) or generalized tonic-clonic (GTC) seizure. 7 patients experienced at least one GTC seizure. . . . . 125
B-3 Example of a 24-hour recording from an 11-year-old female with refractory epilepsy.
A single complex partial seizure and two GTC seizures that occurred during the
monitoring period were accompanied by an increase in EDA. . . . . 126 C-i Peri-ictal EDA recordings (sympathetic) of individual complex partial seizures (CPS).
Red lines denote seizure onset and offset . . . . 128 C-2 Peri-ictal heart rate recordings of individual complex partial seizures (CPS). Red
line denotes CPS. . . . . 129 C-3 Time-frequency mapping of heart rate variability of individual complex partial seizures
(CPS). Two main spectral components can be observed. The high frequency (HF: 0.15 - 0.4 Hz) component reflects vagal modulation of the heart rate; the low fre-quency (LF: 0.04 -0.15 Hz) reflects a complex mixture of sympathetic and
parasym-pathetic modulation. Black lines denote seizure onset and offset. . . . . 130
C-4 Peri-ictal high-frequency heart rate variability power (HF: 0.15-0.4 Hz; parasympa-thetic) of individual complex partial seizures (CPS). Red line denotes CPS. . . . 131 C-5 Peri-ictal EDA recordings(sympathetic) of individual generalized tonic-clonic seizures
(GTCS). Red lines denote seizure onset and offset . . . . 132 C-6 Peri-ictal heart rate recordings of individual generalized tonic-clonic seizures (GTCS).
C-7 Time-frequency mapping of heart rate variability of individual generalized tonic-clonic seizures (GTCS). Two main spectral components can be observed. The high frequency (HF: 0.15 -0.4 Hz) component reflects vagal modulation of the heart rate; the low frequency (LF: 0.04 - 0.15 Hz) reflects a complex mixture of sympathetic
and parasympathetic modulation. Black lines denote seizure onset and offset. . . 134
C-8 Peri-ictal high-frequency heart rate variability power (HF: 0.15-0.4 Hz; parasym-pathetic) of individual generalized tonic-clonic seizures (GTCS). Red line denotes
GTCS. ... .. ... ... ... 135
D-1 Electrodermal activity (EDA) and net acceleration recordings of individual general-ized tonic-clonic seizures (GTCS) from seven patients included for seizure detection. This recordings are zoomed-in to highlight the ictal period. See Fig. D-2 for a broader view of the EDA changes surrounding each seizure. . . . . 138 D-2 Electrodermal activity (EDA) recordings of individual generalized tonic-clonic seizures
(GTCS) from seven patients included for seizure detection. Note: One new patient
(patient 3) was included in this study so the numbering and ordering of seizures are different compared to Fig. C-5 from the previous study. . . . . 139 D-3 Time-frequency mapping of the net acceleration recordings of individual generalized
tonic-clonic seizures (GTCS) from seven patients included for seizure detection. 140
D-4 SVM parameter tuning for non-patient-specic seizure detection: Grid-search for optimal pair of C and -y values based on cross-validation of F-measure for (leave-one-patient-out using both EDA and ACM features). . . . . 141
D-5 SVM parameter tuning for semi-patient-specific seizure detection: Grid-search for optimal pair of C and -y values based on cross-validation of F-measure for (leave-one-seizure-out using both EDA and ACM features). . . . . 142
D-6 SVM parameter tuning for semi-patient-specific seizure detection: Grid-search for optimal pair of C and y values based on cross-validation of F-measure for (leave-one-seizure-out using only ACM features). . . . . 143
List of Tables
4.1 Clinical Characteristics of Patients . . . ... 70
Chapter 1
Introduction
1.1
Epilepsy
Approximately 50 million people worldwide are affected by epilepsy [206], one of the most common serious neurological disorders that has potentially deadly consequences. Epilepsy is a disorder of the brain characterized predominantly by an enduring predisposition to generate epileptic seizures - transient manifestations of abnormal, excessive or synchronous neuronal activity in the brain [62]. In America, the prevalence of epilepsy is estimated as 3 million with around 200,000 new cases diagnosed each year [55]. Among all medical conditions, it is as common as lung or breast cancer. Moreover, death from seizure-related causes is comparable with breast cancer; up to 50,000 deaths occur every year in America
[36].
Epilepsy is not one condition, but a variety of disorders reflecting underlying brain dys-function that may result from many different causes. In children and young adults, epilepsy is often attributed to birth trauma, congenital abnormalities or genetic disorders affecting the brain. In middle-aged adults and the elderly, strokes, tumors and cerebrovascular dis-ease are more often the underlying causes [103]. Nonetheless, more than half of the time the underlying cause is unknown. Epilepsy imposes huge physical, psychological, social and economic burdens on individuals and their families. Due to the fear, misunderstand-ing and the resultmisunderstand-ing social stigma and discrimination surroundmisunderstand-ing epilepsy, many people with epilepsy suffer in silence, afraid to be found out [206]. This is particularly true in the developing world where 80% of the burden of epilepsy falls.
1.1.1
Seizures
An epileptic seizure is defined as "a transient occurrence of signs and/or symptoms due to abnormal excessive or synchronous neuronal activity in the brain" [62]. The diagnosis of epilepsy requires only one epileptic seizure along with an enduring alteration in the brain capable of giving rise to other seizures. Many types of seizures exist and accurate classification is important for prescribing the appropriate therapy.
In 1981, the International League Against Epilepsy (ILAE) formulated an international classification of epileptic seizures that divided seizures into two major classes: partial seizures and generalized seizures [79]. This classification is based on clinical and elec-troencephalographic (EEG) observations of the extent to which the brain is affected by the ictal discharges. Recently, the ILAE revised the terminology and concepts for organization of seizures [20], but no major changes were introduced. According to this latest proposal, focal seizures are perceived as originating within neural networks from only one side of the brain. They may affect a distinct region or be widely distributed. Moreover, focal seizures may originate in cortical or subcortical structures. On the other hand, generalized seizures are thought to originate within rapidly recruiting bilaterally distributed networks. These networks can include cortical and subcortical structures and do not necessarily involve the entire cortex.
1.1.2
Treatment of Epilepsy
Over a dozen antiepileptic drugs (AEDs) are available to treat epilepsy. These drugs typi-cally seek to prevent the development of seizure activity by decreasing neuronal excitation or increasing inhibition. One approach is to modify electrical conduction along neurons
by blocking certain ion channels (e.g. sodium, calcium or potassium channels) in the cell
membrane. Alternatively, the drugs can target the chemical transmission between neurons
by affecting the neurotransmitter interactions (e.g. GABA, glutamate) at the synapses.
Nonetheless, up to 36% of patients have inadequate control of seizures with drug ther-apy [92].
For people with medically intractable seizures, some may be candidates for surgery such as those who have partial seizures. Epilepsy surgery can be performed only if the seizure origination point can be localized and the surgery to remove that part of the brain
will not significantly alter its normal function. As such, people with generalized seizures are not candidates for surgery. The ketogenic diet is another treatment option that is used primarily in children. This high-fat diet is designed to mimic the biological effects of starvation, but the exact mechanisms of seizure inhibition are unknown. For this treatment to work, a rigid diet must be followed that requires extraordinary dedication and discipline from both the child and family. Another approach for treating epilepsy is to use vagus nerve stimulation (VNS). VNS involves surgically implanting a battery-powered device akin to a cardiac pacemaker under the skin in the chest. The device is connected to the vagus nerve in the left side of the neck and can be adjusted to periodically stimulate the vagus nerve. This therapy has been shown to be an effective treatment for epilepsy in some patients, but its mechanism also remain unknown.
1.1.3
Mortality in Epilepsy
People with epilepsy have mortality rates two to three times higher than the general popu-lation [65,118]. Some excess mortality is partly related to the underlying disorder causing epilepsy such as cerebrovascular disease, respiratory disorders and cancer. In America, up to 50,000 of deaths each year are direct seizure-related consequences, such as accidents (e.g. trauma or drowning), suicide, status epilepticus and sudden unexpected death in epilepsy
(SUDEP) [36]. Status epilepticus is a condition in which epileptic seizure activity continues
or is repeated without the person regaining consciousness for an extended period of time. It is a medical emergency that can lead to permanent injury or death. In adolescents and young adults, the most common direct seizure-related cause of death is SUDEP [65].
1.2
Sudden, Unexpected Death in Epilepsy
"She rose from Dinner about four o'clock in better health and spirits than she appeared to have been in for some time; soon after which she was seized with one of her usual Fits, and expired in it, in less than two minutes, without uttering a word, a groan, or scarce a sigh. This sudden and unexpected blow, I scarce need
add has almost reduced my poor Wife to the lowest ebb of Misery." [1]
This is one of the earliest accounts of sudden death as a result of a seizure and was written in 1773 by George Washington, the first US president, concerning his 17 year old
stepdaughter with refractory epilepsy [47]. SUDEP is defined as a sudden, unexpected, witnessed or unwitnessed, non-traumatic and non-drowning death of a patient with epilepsy, with or without evidence of a seizure (excluding documented status epilepticus), in which postmortem examination does not reveal a toxicological or anatomical cause for death [123]. It is the leading cause of death in patients with chronic uncontrolled epilepsy and although a relatively rare event, the risk of sudden death in people with epilepsy is 24 times higher compared to the general population [61]. The incidence rate of SUDEP in people with epilepsy ranges from 0.1 to 2.3 per 1,000 person-years (calculated as incidence proportion divided by number of years) [183]. Patients with refractory epilepsy are at higher risk (1.1 to 6.0 per 1,000 person-years) [11,118,124,125] and the highest rates fall on epilepsy surgery candidates or patients who fail to achieve complete seizure control after surgery, reaching
6.3 to 9.3 per 1000 person-years [39,130,170].
The circumstances of deaths in SUDEP cases bear remarkable similarities; death appears to occur during or shortly after a seizure and often occurs at home (in bed or by the bed) during the night [177]. Although the deaths are largely unwitnessed, evidence of a recent seizure is frequently found, such as a bitten tongue/lip, urinary incontinence, signs of having fallen off the bed and a disrupted environment [126]. Moreover, in most, but not all witnessed cases of SUDEP, patients died shortly after a generalized tonic-clonic seizure (within minutes rather than hours) [93, 94,190]. One of the most frequent complaints of parents of SUDEP victims is that they were not informed of this fatal possibility. Many struggle with the thought that knowing about the risk of SUDEP beforehand possibly could have helped them prevent it. Nonetheless, there remains much debate among clinicians whether the risk of SUDEP should be discussed with all patients. Because SUDEP is a relatively rare phenomenon, the primary concern is on the potential to cause harm to the patient by disclosing information that was not actively sought, where the knowledge of
SUDEP does not significantly alter management or outcome [30].
1.2.1
Risk Factors and Pathophysiology of SUDEP
Unlike many disorders that can be prevented by avoidance or correction of risk factors, the currently known risk factors for SUDEP are not as easily modifiable for many patients
[169]. Nonetheless, knowledge of the clinical profile of SUDEP can guide studies into its
consistently associated with SUDEP include poor seizure control, antiepileptic drug (AED) polytherapy, and a long duration of epilepsy [177]. Five out of six studies analysing seizure frequency reported that the frequency of generalized tonic-clonic seizures was a significant risk factor [189]. Although polytherapy with AEDs was a risk factor in several studies, the absence of treatment with AEDs was also a strong risk factor in the largest case control study [94].
The pathophysiology of SUDEP remains unclear. As SUDEP is a category and not a condition, it may represent more than one entity and different mechanisms may operate in different individuals. In most cases, SUDEP is triggered by a generalized tonic-clonic seizure [189]. Only eight SUDEP cases have been reported during EEG monitoring. Seven of the SUDEP events occurred after a secondarily generalized tonic-clonic seizure and in the single case that occurred after a complex partial seizure, the patient had experienced two secondarily generalized tonic-clonic seizures (one hour apart) in the two hours prior to the terminal seizure. Notably, seven out of eight cases reported abrupt interruption of ictal activity replaced by severe suppression of the EEG that failed to recover in the fatal seizure [14, 23, 99, 104, 115, 144]. Four of the reports suggested electrical shutdown of the brain as the primary mechanism [23,98,104,115]. One case postulated that death was due to asphyxia secondary to obstructive apnea in the setting of post-ictal EEG suppression [144]. Two other reports attributed the deaths to hypoxemia leading to eventual cardiac failure, although the primary mechanism was not clarified [14]. Another SUDEP case was related to seizure-induced ventricular fibrillation as seen on the electrocardiogram (ECG) followed by terminal asystole in a patient with a past history of myocardial infarction and angina [40]. On the other hand, in two monitored cases of near SUDEP, either postictal central apnea or ictal obstructive apnea was suspected to be the primary dysfunction that led to cardiac arrest [168,186]. Recently, a third near SUDEP case reported ventricular tachycardia and fibrillation after a secondarily generalized tonic-clonic seizure in a patient with epilepsy who had no underlying cardiac disease [56].
It is likely that no single mechanism can explain all cases of SUDEP. The pathophysi-ology of SUDEP appears to be multifactorial and identifying the primary cause of death is challenging. In general, three major domains of potential SUDEP mechanisms have been identified: cardiac, respiratory and autonomic [169]. These mechanisms may not be in-dependent of each other and many potential mechanisms are in more than one domain,
especially in both cardiac and autonomic domains. As such, Surges et al. proposed a "fatal coincidence" hypothesis, suggesting that SUDEP is likely caused by the periictal coinci-dence of several precipitating factors that form a chain of events that culminates in sudden death [177].
1.3
Seizure Prediction and Detection
Patients with epilepsy often describe seizures as occurring "like a bolt from the blue" which accentuates the apparent sudden, unforeseen way in which seizures tend to strike [120]. This represents one of the most disabling aspects of the disease [54], especially for those unable to achieve complete seizure control. It can lead to an intense feeling of helplessness that has a strong impact on the everyday life of a patient. In addition, abrupt episodes of staring, loss of muscle control or loss of consciousness can pose a serious injury risk and can even be life-threatening if they occur while the patient is driving, crossing a busy street, bathing, swimming or climbing stairs. Therefore, a method capable of forecasting the occurrence of seizures could significantly improve the quality of life for epilepsy patients [53].
For many years, epileptic seizures were thought to strike abruptly but there is now mounting evidence that seizures develop minutes to hours before clinical onset. Clinical findings corroborating the existence of a pre-seizure state include a significant increase in blood flow in the epileptic temporal lobes minutes before seizure onset [16, 204], increase in cerebral oxygenation hours before the ictal event [2], increase in blood oxygen level dependent functional MRI (fMRI) signals [58] as well as changes in RR intervals on the ECG minutes before seizure onset [134]. Since Viglione and colleagues pioneered the visionary work on predicting epileptic seizures in the 1970s, much of the work in seizure prediction has focused on extracting characteristic features that are predictive of an impending seizure from intracranial electroencephalogram (EEG) signals [198]. Nonetheless, there is awareness that single quantitative techniques are unlikely to predict seizures in all patients. In recent years, seizure prediction work has diversified and there is an increasing interest in methods for forecasting seizures from other physiological or non-physiological variables [106].
Irrespective of whether seizures can be robustly predicted, a device that can detect seizures and trigger an alarm has important utility. Since seizures often cause loss of consciousness, most patients have trouble accurately reporting the occurrence of seizures.
Treatment decisions are primarily based on seizure frequency [43], thus inaccurate self-reports can lead to ineffective therapy. A seizure detection device would provide objective measurements for quantification of seizure frequency. More importantly, because most deaths are unwitnessed, supervision and attention to recovery after a seizure may be im-portant in SUDEP prevention [93]. If a parent or caregiver is alerted when a seizure occurs, especially during sleep, the patient can receive timely treatment if injured, be placed in the recovery position and avoid airway obstruction that could be fatal. One study in a residen-tial school for children with epilepsy who were closely supervised at night and monitored after a seizure reported that deaths occurred with students on leave or after they left, but not at the school [124]. Another large case-control study found that sharing a bedroom with someone capable of giving assistance and special precautions such as regular checks throughout the night or using a listening device were all protective factors [94].
1.3.1
Seizure Detection Using Wearable Biosensors
Although neuronal signals are the most obvious candidate for seizure detection, an EEG-based approach has its disadvantages. To obtain high-resolution data, recordings need to be intracranial, which is highly invasive and not likely to have widespread applicability. Even if the quality of recordings from surface-based electrodes is improved, the technical require-ments for the implementation of a portable EEG recorder are challenging. Furthermore, much effort will be needed to design a wearable electrode system that is not obstructive, unwieldy or stigmatizing.
Wrist-worn or leg-worn sensors are appealing because patients can avoid intracranial procedures and they have the freedom to remove the device at any point in time. For exam-ple, accelerometers placed on the trunk and limbs have been used to detect motor seizures based on patterns in physical activity [129]. The autonomic nervous system is an attractive alternative that may provide a sensitive and easily measured index of central dysregulation because autonomic output reflects the sum of a wide number of central systems with a host of central inputs [18]. Therefore, it is likely that seizures can be detected from autonomic efferents that often accompany them. Many patients are aware of periods when seizures are more likely, although they can rarely specify an exact time when seizures will happen [106].
Sleep deprivation, emotional, somatic and intellectual stress have also been reported to provoked stress convulsions, supporting the notion that stress plays a role in facilitating
epileptic seizures [68,70]. Cardiac autonomic activity as measured by heart rate variability (HRV) has been used to detect neonatal seizures [116]. HRV analysis has also been utilized for forecasting generalized seizures in rats and complex partial seizures humans by applying an unsupervised fuzzy clustering algorithm [89].
Using physiological signals other than EEG may not offer the same sensitivity or speci-ficity for seizure detection, but the convenience and comfort of an unobtrusive device cannot be overlooked. In a survey of over 90 patients with epilepsy, almost 80% could not accept having to wear scalp EEG electrodes to obtain seizure warnings, but more than 50% could imagine wearing a device of the size of a Walkman on a long-term basis [159]. A wearable device that is non-stigmatizing and comfortable is more likely to be adopted by patients during their daily lives.
1.4
Overall Aims
Epileptic seizures can result in events that are potentially fatal, including accidents, status epilepticus and SUDEP. Combined EEG and video-monitoring remains the clinical standard for seizure detection but this technique is not practical for long-term outpatient monitoring or everyday use. A round-the-clock seizure monitoring system would allow tracking seizures for therapeutic purposes and prevent serious complications including death and neurological injury. Thus, there is a medical need for a reliable, comfortable, cost-effective, and non-stigmatizing seizure monitor suitable for everyday use. The specific aims of this thesis (shown in Figure 1-1) are:
" To develop a wrist-worn biosensor for long-term, continuous monitoring of
electro-dermal activity (EDA) as an index of sympathetic nervous system activity, and 3-D accelerometry (ACM) to measure movement patterns of the arm . The hypothesis is that a low-cost, compact, and non-stigmatizing device that can be worn comfort-ably will enable widespread, continuous measurements to be performed over days to months.
" To characterize autonomic alterations associated with epileptic seizures with the use
of the wrist-worn EDA biosensor and time-frequency mapping of heart rate variability (HRV). The hypothesis is that epileptic seizures, generalized tonic-clonic seizure in
Wrist-worn Bionsensor
(Electrodermal Activity
'
+Accelerometry)
Effects of Seizures on
Autonomic Activity
Epilepsy alarm system insight Seizure ....- - ~ ptcus Accidents Sudn Death (SUDEP) DeathConvulsive Seizure
Detection Algorithm
tFigure 1-1: Outline of thesis aims.
particular, can induce an increase in EDA as a marker for sympathetic activity and reduce HRV indices of parasympathetic activity.
* To quantify the relationship between the intensity of seizure-induced autonomic imbal-ance and post-ictal EEG suppression, an objective surrogate marker under investiga-tion by epileptologists for its possible relainvestiga-tion to the risk of SUDEP. The hypothesis is that the duration of EEG suppression will correlate positively with the degree of sym-pathetic EDA increase and correlate negatively with the extent of parasymsym-pathetic HRV reduction.
" To develop an algorithm for automatic detection of generalized tonic-clonic seizures
with the use of the wrist-worn biosensor. The hypothesis is that tonic-clonic seizures can be detected using EDA and ACM signals.
1.5
Thesis outline
Chapter 2 provides background information on the autonomic nervous system and
ap-proaches to quantify activity using heart rate variability (HRV) and EDA. Existing information in the literature regarding autonomic activity in patients with epilepsy is also presented.
Chapter 3 presents a novel, unobtrusive, nonstigmatizing, wrist-worn integrated
biosen-sor for long-term, continuous measurements of EDA and ACM along with the first demonstration of long-term, continuous assessment of EDA outside of a laboratory setting. This chapter includes performance evaluation of the biosensor against a Food and Drug Administration (FDA) approved system for the measurement of EDA during various classic arousal experiments. The choice of electrode material is also discussed.
Chapter 4 describes high-resolution characterization of autonomic alterations of epileptic
seizures using the wearable EDA biosensor and time-frequency mapping of HRV. A comparison between the autonomic impact of complex partial and generalized tonic-clonic seizures is performed. The possibility that autonomic biomarkers could serve as biomarkers for SUDEP risk is examined by quantifying the relationship between the degree of autonomic disturbance and post-ictal generalized EEG suppresion, a surrogate marker of SUDEP risk.
Chapter 5 presents a novel algorithm for automated detection of generalized tonic-clonic
seizures using the wearable biosensor. The utility of EDA as a supplementary signal to ACM for seizure detection is evaluated. Performance of the algorithm is tested on recordings taken over 176 days from 80 patients.
Chapter 2
Autonomic Alterations in Epilepsy
2.1
Autonomic Nervous System
The autonomic nervous system (ANS) is the control system responsible for maintaining homeostasis of the body through regulation of visceral functions including functions of the heart muscle, smooth muscles, secretory glands and hormone secretion. The peripheral component of the ANS is composed of two functionally and anatomically distinct divi-sions - the sympathetic and parasympathetic nervous systems. While the parasympathetic nervous system promotes restoration and conservation of energy, the sympathetic nervous system stimulates increased metabolic output to deal with external challenges. As such, increased sympathetic activity elevates heart rate, blood pressure, and sweating, as well as redirects blood from the intestinal reservoir toward skeletal muscles, lungs, heart, and brain in preparation for motor action. The brain controls the ANS via a complex neural network called the central autonomic network. The central autonomic network comprises the insular cortex, anterior cingulate gyrus, amygdala, hypothalamus, prefrontal cortex, periaqueduc-tal gray matter, parabrachial complex, nucleus of the tractus solitarius, and ventrolateral medulla [18]. Several of these structures, such as the insular cortex, prefrontal cortex and cingulate gyrus have recognized seizure potential, thus providing direct connections between epileptic seizures and ANS activity [160].
Autonomic symptoms during epileptic seizures are mediated by an activation of the cen-tral autonomic network and range from subtle manifestations to severe, even life-threatening events [15]. Autonomic signatures such as flushing, sweating and piloerection often accom-pany partial seizures and auras [15,108,109]. In contrast, GTCS are associated with severe
increases in blood pressure and changes in heart rate and cardiac conduction [157]. Seizure-induced autonomic dysfunction can have serious clinical consequences and potentially fatal effects when the cardiovascular or respiratory systems are involved [46].
2.2
Heart Rate Variability
The heart is one of the most important target organs of the ANS. Sympathetic innerva-tion of the heart arises from the cervical and upper thoracic sympathetic ganglia, whereas parasympathetic innervation is mediated via the vagus nerve originating from the medulla oblongata. Sympathetic activation increases conduction, excitability and contractility of the heart. In contrary, parasympathetic activation decreases these cardiac functions.
Heart rate variability (HRV), a measure of beat-to-beat alterations in the heart rate, provides a measure of the cardiac autonomic modulation because they are mediated by autonomic inputs to the sinoatrial (SA) node [110]. Analysis of HRV can be performed in the time and frequency domains to obtain information regarding the influence of parasym-pathetic or mixed symparasym-pathetic and parasymparasym-pathetic modulation. Vagal modulation can be quantified by analyzing oscillations at respiratory frequencies (also known as respira-tory sinus arrhythmia; 0.15 - 0.4 Hz) that are mediated solely by the parasympathetic system and are abolished by atropine infusion [6,142]. Although there is a consensus that HF power reflects vagal modulation of the heart rate, sympathetic modulation cannot be easily uncoupled. It has been claimed that power in the low frequency range (LF, 0.04
-0.15 Hz) reflects primarily sympathetic modulation of heart rate and that the LF/HF ratio
reflects the sympathovagal balance but this is highly controversial as beta blockade does not reduce, but rather increases LF power [32] and direct cardiac sympathetic blockage via epidural anesthesia has no effect on it [76].
2.2.1
Regulation of Heart Rate Variability as a Predictor of Sudden
Death
Studies of HRV in patients with epilepsy suggest a decrease in parasympathetic tone and/or an increase in sympathetic tone in the inter-ictal state [177]. In patients with temporal lobe epilepsy, interictal HRV was reported to be reduced compared to healthy controls [148,
HRV was found to increase after epilepsy surgery [74], suggesting that HRV is related to
seizure control. Since most SUDEP cases occur shortly after a seizure, peri-ictal autonomic alterations might be more relevant to its pathophysiology. In a study of 12 patients, an increase of parasympathetic activity was observed during the pre-ictal period followed by a rapid fall 30 s before the onset of temporal lobe complex partial seizures (CPS), raising the possibility of predicting impending seizures based on hallmark autonomic alterations prior to their clinical presentation [134]. These findings have yet to be replicated and a separate study of 10 patients reported elevated parasympathetic activity prior to GTCS but not CPS [45]. On the other hand, low frequency heart rate oscillations (0.01 to 0.1 Hz) lasting 2-6 minutes postictally that could indicate neuroautonomic instability were observed in five female patients [7]. Recently, HRV was found to be significantly lowered postictally (measured 5 min after seizure offset) in GTCS compared to CPS in 25 patients [175]. Another study of 31 patients also reported that postictal HRV was lower in GTCS compared to CPS, supporting the notion that GTCS has a greater impact on autonomic function [191]. The authors observed that HRV was lower at two time points measured after GTCS onset
(10-15 min and 5-6 hours) which suggests long-term postictal autonomic disturbance, but
it is worth noting that continuous measurements were not taken in between. Overall, these studies indicate that there is a window of disorganized autonomic neural function in the postictal state and there is a need to investigate the duration and dynamics of this disturbance.
A number of studies have shown that decreased HRV is a consistent predictor of cardiac
mortality and sudden cardiac death, independent of disease status [171]. These studies have included apparently healthy middle-aged adults who had Holter recordings prior to their sudden death [119] as well as patients who died suddenly while wearing a Holter monitor [112]. Furthermore, a report of progressive decrease in HRV in two patients with eventual sudden death within two years of the first recording suggests that long-term HRV monitoring can identify patients at high risk of sudden death [122]. Interestingly, a recent case study described a patient who underwent repeated measures of vagus-mediated HRV, which progressively deteriorated prior to SUDEP [146]. Another recent study of 19 patients found an association between vagus-mediated HRV and an inventory of clinical SUDEP risk factors [44]. Thus, it is reasonable to postulate that decreased HRV could be a potential risk factor for SUDEP.