HAL Id: hal-01720074
https://hal.archives-ouvertes.fr/hal-01720074
Submitted on 28 Feb 2018
HAL is a multi-disciplinary open access
archive for the deposit and dissemination of sci-entific research documents, whether they are pub-lished or not. The documents may come from teaching and research institutions in France or abroad, or from public or private research centers.
L’archive ouverte pluridisciplinaire HAL, est destinée au dépôt et à la diffusion de documents scientifiques de niveau recherche, publiés ou non, émanant des établissements d’enseignement et de recherche français ou étrangers, des laboratoires publics ou privés.
Bertrand Fournier, El-Eulmi Bendeif, Benoît Guillot, Alberto Podjarny,
Claude Lecomte, Christian Jelsch
To cite this version:
Bertrand Fournier, El-Eulmi Bendeif, Benoît Guillot, Alberto Podjarny, Claude Lecomte, et al.. Charge Density and Electrostatic Interactions of Fidarestat, an Inhibitor of Human Aldose Reductase. Journal of the American Chemical Society, American Chemical Society, 2009, 131 (31), pp.10929-10941. �10.1021/ja8095015�. �hal-01720074�
J. Am. Chem. Soc., 2009, 131 (31), pp 10929–10941
DOI: 10.1021/ja8095015
Publication Date (Web): July 13, 2009
Charge density and electrostatic interactions of fidarestat,
an inhibitor of human aldose reductase.
Bertrand Fournier†, El-Eulmi Bendeif†, Benoît Guillot†, Alberto Podjarny‡, Claude Lecomte†,
Christian Jelsch†*
‡
† Laboratoire de Cristallographie, Résonance Magnétique et Modélisations (CRM2)
CNRS, UMR 7036, Institut Jean Barriol.
Faculté des Sciences et Techniques, Nancy University. BP 70239, 54506 Vandoeuvre-lès-Nancy CEDEX, France.
† UPR de Biologie Structurale, IGBMC, CNRS INSERM ULP, 1 rue Laurent Fries, B.P. 163, 67404
Illkirch, France
Summary
The charge density and the topological features of fidarestat, an inhibitor of human aldose reductase, have been determined from ultra high-resolution X-ray diffraction data at 100 K. The modelled electron density was used to calculate the electrostatic interaction energy of fidarestat and its (2R4S) stereoisomer with the human Aldose Reducase by using the ELMAM database as coded in the MoPro program. Such calculation may be extended to other protein complexes for which accurate high resolution X-ray data are available. The paper also discusses the hydrogen bonds in the fidarestat crystal. There are notably two hydrogen bonds with a π system as acceptor. All the chemical bonds and the intermolecular interactions, especially these two π…H bonds, have been quantitatively studied by topological analysis. The three-dimensional electrostatic potential calculated on the molecular surface emphasizes the preferential polar binding sites of fidarestat. Theses interacting features in the molecule are crucial for drug-receptor recognition. The interactions between chemical groups in the crystal are also analyzed by computing the electrostatic energy using the latest advancements of the MoPro crystallographic software. The complexes of fidarestat and its (2R4S) stereoisomer with human aldose reductase were modelled with a multipolar atom model transferred from our electron density database. Accurate estimation of electrostatic interaction energy between inhibitors and the main residues of the protein active site is derived from this high detail level of the electron density.
1. Introduction
Fidarestat ((2S,4S)-6-fluoro-2’,5’-dioxospiro[chroman-4,4’-imidazolidine]-2-carboxamide) (Figure 2) is a human Aldose Reductase (hAR) inhibitor. hAR is a 36-kDa enzyme, member of the aldo-keto reductase superfamily, which catalyzes the reduction of different compounds such as aldehydes, xenobiotic aldehydes, ketones and trioses with NADPH as a cofactor. hAR is the first and rate-determining enzyme of the polyol pathway converting first glucose into sorbitol which is, in a second step, turned into fructose by sorbitol dehydrogenase. The accumulation of sorbitol in cells leads to diabetes complications. Thus, inhibition of hAR is a potential therapeutic way to cure the debilitating pathologies related to chronic hyperglycemia. Fidarestat (SNK-860) was tested on human patients.1 There was a doubt about
its absolute configuration, but it has been recently determined by X-ray crystallography using a bromine derivative.2
Many aldose reductase inhibitors have been identified and studied for several years.3-5 Unfortunately, most of them such as tolrestat, zopolrestat, ponalrestat and zenarestat, have unacceptable side effects or lack of efficiency.6-8 The side effects are related to the inhibition of another member of the aldo-keto reductase superfamily, aldehyde reductase, which shares with hAR a high level of structural homology.9 Fidarestat is a cyclic imide group inhibitor which contains a carbamoyl-substituted cycle.10,2 It shows higher activity and selectivity than the other inhibitors. Fidarestat recently showed encouraging results in that it normalized erythrocytic sorbitol contents in neuropathic patients without significant side effects.11
Taking into account the pharmaceutical stake, hAR in complex with fidarestat has been subject to many studies starting from high resolution X-ray diffraction analysis.4 The common
and main purpose of these studies is the understanding of fidarestat binding affinity and selectivity for hAR. The stereospecificity in binding to aldose reductase of fidarestat ((2R,4S) stereoisomer) compared to its (2R,4S) stereoisomer has been investigated by means of crystallographic structures analysis67 and of molecular dynamics simulations using free energy integration techniques.12 The two stereoisomers differ mainly in the orientation of the carbamoyl moiety with respect to the active site and rotation around the bond joining the carbamoyl substituent to the ring.
Diffraction data at ultra high resolution, (sin/ around 1.0 Å-1) allows to model quantitatively the deformation of the atomic electron distribution due to chemical interactions like covalent bonds and hydrogen bonding. The charge distribution of fidarestat is investigated in this paper for a better understanding of the nature and intensity of the intermolecular interactions in the crystal packing. An analysis of the electrostatic interactions of hAR complexed with another inhibitor, IDD594 was already performed.13 Recently, we analysed the charge density of the protein itself at 0.66 Å resolution.14 Another result of the present study is the contribution to the electron density database (ELMAM) which is being built in our laboratory and generalized from amino acids to common chemical functions.15
In the course of our study on ultra high resolution crystallography and drug design13-14, the paper is organized as follows. After a description of the used methodology, the electron density of fidarestat is discussed. Finally, an analysis of electrostatic interactions using our ELMAM database is carried out for the first time on protein-ligand complexes, namely fidarestat and its (2R,4S) stereo-isomer bonded with hAR.
2. Materials and methods
2.1 Crystallization
The fidarestat powder was dissolved in water. Colourless single crystals of needle form grew from the solution, by slow evaporation at room temperature, over a period of a few days. A small specimen of size 0.2 0.15 0.8 mm3 was selected and used for the X-ray diffraction
experiment.
2.2 Data collection
The fidarestat single-crystal X-ray diffraction experiment was performed at 100 K on the D3 beamline at Hasylab/DESY (Hamburg, Germany), using a λ = 0.450 Å synchrotron radiation. The high-resolution Huber four-circle diffractometer was equipped with an Oxford Cryosystem cooling unit and a Bruker MAR CCD (165 mm) area detector. The reciprocal space was explored by a combination of different and scans with 2 set at 6° due to device characteristics. The low and high resolution reflections were measured with a radiation exposure time of 30 s and 90 s respectively. The detector was positioned at 60 mm distance from the crystal. A total of 1690 frames were collected with a scan width of 1°. This procedure yields to data collected up to a maximum resolution of sinmax/ = 1.01 Å-1, with an
overall completeness that exceeds 97% (Table 1). The analysis of the diffraction data showed no significant intensity decay during data collection.
2.3 Data reduction
The diffraction data of fidarestat were integrated using the XDS program.16 Absorption correction was performed by means of a Gaussian numerical quadrature using the ABSORB program.17 The maximum and minimum transmissions calculated in this way were Tmax =
0.995 and Tmin = 0.983. The different sets of measured reflections were then merged and
scaled with the SORTAV program.18 317438 reflection intensities were collected resulting, after averaging over 222 symmetry, in 10020 unique reflections, of which 9991 satisfy the
Iobs/ (Iobs) ≥ 0 criteria. The internal agreement factor for all data is RInt(I) = 0.088 with an
average redundancy of 31. Further details on the crystal data and experimental conditions are given in Table 1.
2.4 Spherical atom refinement
The fidarestat crystal structure was solved in the P212121 space group by direct methods with
the SHELXS97 program.19 The least-squares refinement was carried out with the MoPro software package20-21. For the structure factor computations, the atomic form factors were calculated from Clementi & Raimondi22, the real and imaginary dispersion corrections to the form factors were from Kissel23. In all refinements, the quadratic sum ∑H wH (|Fobs| - k |Fcal|)2
was minimized using all reflections with Iobs/ (Iobs) ≥ 0. The reflection weights wH were set equal to 1/2(Fobs).
In the absence of suitable anomalous scattering, refinement of the Flack24 parameter led to inconclusive values. This means that a definite conclusion on absolute structure and chirality of the molecule cannot be drawn.25 Therefore, the absolute conformation was set by reference
to the structure of the bromine derivative of fidarestat2 and to the hAR - fidarestat complex.4-5
2.5 Multipolar modelling
The electron density refinements were performed with the MoPro software20-21 using the Hansen & Coppens26 multipolar atom formalism. It allows modelling the non-spherical part of the atomic electron density using atom-centred multipole functions:
.) , ( ) ' ( ' ) ( ) ( ) ( 0 0 3 sph val 3 val core atom max
l m lm lm l l l r P Y R r κ κ P r r (1)In the multipole formalism, the core and the spherical valence density of the atoms are calculated from Hartree-Fock wave functions expanded over Slater-type basis functions.27 For the multipolar terms, single-zeta radial functions Rl with energy-optimized Slater exponents
were taken and kept fixed. An octupolar level of the multipole description was used for C, N, O and F atoms, while only bond-directed dipoles were applied for H atoms.
2.6 Multipolar refinement strategy
The crystal structure resulting from the spherical atom modelling was used as input for the multipolar refinement. A first standard multipolar model refinement was performed using anisotropic thermal displacement parameters for heavy atoms and isotropic ones for hydrogen. The bond lengths for H atoms were restrained to the standard neutron distances28 with an allowed standard deviation of 0.002 Å. The coefficients of hydrogen atoms were
restrained to the value 1.160(1)29 which has been used since 1996 in our laboratory. The ’ coefficients of the hydrogen atoms bound to C or N atoms were restrained to the values reported by Volkov et al.30, namely 1.180(1) and 1.400(1). The and ’ coefficients of the fluorine atom F17 were both restrained to the value of 0.988 according to Sorensen et al.31, with 0.001 and 0.01 standard deviations, respectively.
At the end of this first multipolar refinement, a rigid body motion analysis was performed in order to derive Atomic Displacement Parameters (ADP’s) for the hydrogen atoms. The Translation-Libration-Screw (TLS)32 analysis was performed through the SHADE program
33-34 on fidarestat rigid groups using ADP’s of non-H atoms. For the TLS analysis of fidarestat,
the molecule was divided in four groups: the hydantoin moiety, the chroman ring, the carbamoyl moiety with three extra atoms: C9, O10 and H9, and, finally, a last atom group made up of atoms C19, O10, C9, C8I, C7I, H9, H28I and H18I. The hydrogen atoms ADP’s were refined using tight restraints to the target values obtained from the SHADE program with an allowed standard deviation of 0.0003 Å2. The multipolar refinement was then continued from the previous model, with the new anisotropic description of the thermal motion for the hydrogen atoms.
Modelling the hydrogen atoms up to the quadripolar level was not deemed necessary; there was no significant electron density around the hydrogen atoms in the residual maps.
2.7 Calculation of electrostatic interaction energies
For a better understanding of the intermolecular interactions in the fidarestat crystal, calculations of electrostatic interaction energies were performed with VMoPro, a properties visualization tool of the MoPro software.21 The VMoPro program allows computing the electrostatic potential and energy derived from the multipolar charge distribution. The electrostatic energy is computed between two interacting chemical moieties, for instance, two molecules in contact in the crystal packing of fidarestat.
The total electrostatic interaction energy between the charge distributions of two chemical entities A and B, named respectively A andB, is:
B A B A B A elec r r dr dr E
1 (2)It is computed by 3D integration of the charge distribution A of the entity A, multiplied by the electrostatic potential B of the entity B, or reciprocally:
B A B A B A dr dr Eelec
(3)The program performs the calculation on a non regular grid with focusing on regions showing large variations of the function integrated and using 5th order Taylor formula. An estimation of the error in the numerical integration can be based on the reciprocity of the integration. Swapping the volume integrals in the electrostatic energy formulas allows proposing two different expressions in equation (3). The two numerical integrations of the electrostatic interaction energies show differences which are always lower than 1%. The integration method implemented in VMoPro will be described in more details in a future paper.
3. Electron density and electrostatic properties of the fidarestat molecule
3.1 Crystallographic refinement
The final crystallographic agreement factor is given in Table 1. Its low value testifies for the quality of the data and refinement model. The rigid bond test35 shows that the highest difference of mean-squares displacement amplitudes between non-hydrogen atoms is Z2 =
8(3)10-4 Å2 for the C9—C8I bond, indicating a proper deconvolution of the atomic thermal motion and electron density. No significant electron density was found in the residual Fourier maps. The goodness-of-fit values are lower than unity at the end of the spherical independent atom model (IAM) and of the multipolar refinements. This shows that the low- or high-resolution frames are integrated in the same way and the experimental standard uncertainties are uniformly overestimated after data reduction with the SORTAV program.18 It has to be
noted that using ADP’s to model H-atoms thermal motion led to a small, but systematic, improvement of agreement factor (Table 1).
3.2 Crystal structure and packing
The molecular structure of fidarestat including hydrogen atoms is given in Figure 2. A view of the fidarestat crystal packing is shown in Figure 3. A molecule of fidarestat is in contact with 14 neighbouring molecules. To each dimer of neighbouring molecules corresponds a twin dimer which displays the same intermolecular interactions. In the twin dimers, the reference and neighbour molecules are related by reverse symmetric operators. These crystal contacts thus correspond to seven unique dimers.
The fidarestat molecule is involved in seven significant hydrogen bonds (Table 2). Four of the seven dimers in the crystal involve at least one hydrogen bond (Table 3, Figure 4). All oxygen atoms are involved in hydrogen bonds: O6I is acceptor three times, O3I twice while O20 and the ether oxygen O10 are acceptors only once. Two of the H-bonds: N21—H121…O10 and C9—H9…O6I are intramolecular interactions. Each fidarestat molecule is involved five times as acceptor/donor in H…O interactions with symmetry related molecules.
The configurations of the molecular dimers are shown in Figure 5. The geometrical parameters of the five inter- and the two intra-molecular N—H…O or C—H…O hydrogen bonds are reported in Table 2. Two categories of inter-molecular interactions can be
distinguished from their geometry: two strong (distance (H…A) < 2.1 Å and angle D—H…A > 140°) and three weak (H…A > 2.1 Å or D—H…A < 140°) hydrogen bonds. Among the four fidarestat dimers, only one of them is implicated in two hydrogen bonds.
The fidarestat molecules form zigzag chains along the a axis by the means of two different interactions (Figure 3). The first is the N1I—H1I…O20 hydrogen bond between the imino group of the hydantoin ring and the carbonyl oxygen atom O20. The second is a weak hydrogen bond C13—H13…O6I (Figure 5a).
The zigzag chains parallel to the a direction are connected through the N4—H4…O3I hydrogen bond between the carbonyl and imino groups of two different hydantoin rings to form a two dimensional network (Figure 5b). These zigzag chains are interconnected through two other hydrogen bonds N21—H121…O6I (Figure 5c) and C15—H15…O3I (Figure 5d). In addition, O10 and O6I atoms interact with their adjacent amino group N21—H121 and
Csp3—H group C9—H9 respectively via N21—H121…O10 and C9—H9…O6I
intramolecular hydrogen bonds (Figure 4), leading respectively to a five and six-membered ringsR11(5) and (6)
1 1
R .36-37
The fluorine atom F17 is involved in only one intermolecular contact with the H121—N21 hydrogen atom. This interaction may be classified as van der Waals rather than hydrogen bond due to its geometry. The hydrogen-fluorine distance, 2.55(1) Å, is equal to the sum of their van der Waals radii (1.47Å and 1.09Å for F38 and H39, respectively), and the N—H…F angle of 113(2)° is not favourable for hydrogen bonding. A combination of theoretical and statistical approaches40 have shown that C—H...F contacts cannot be classified as hydrogen bonds since they are weak with interaction energies similar to those of van der Waals interactions. The nearly perpendicular orientation of the two cyclic groups of fidarestat explains the absence of … interactions between the aromatic rings in the crystal packing. The molecular structure can be viewed as a donor-acceptor adduct, in which the carbonyl and the imino groups play an important role in the hydrogen bonding pattern.
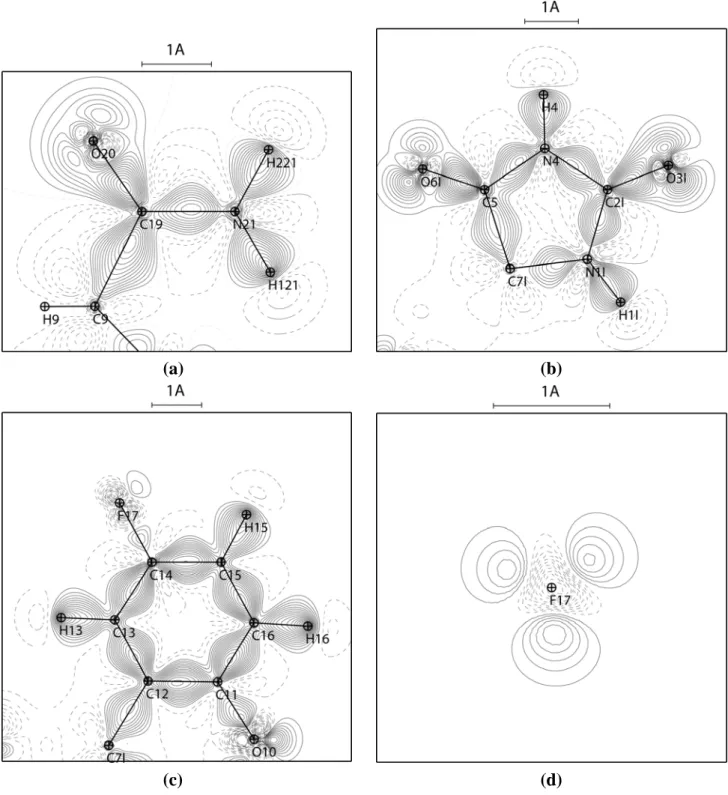
3.4 Deformation electron density
Figure 6 shows the deformation of the static electron density (∆ maps) in the plane of the carbamoyl moiety, of the hydantoin and of the fluorophenyl-like moiety of the chroman ring.
All the expected bonding features and electron lone pairs are clearly visible in the ∆ representation. They illustrate charge accumulations on the non polar covalent bonds (C—C), on the polar bonds (C—F, C—O) and in the non-bonded valence shell regions around the oxygen and fluorine atoms. There is a small electron depletion on the C=O and C—F polar bonds near the electronegative atoms. The electron density peak on the C—F bond is weak, which is in line with literature.41-43 The electron lone pairs of the O6I and O3I carbonyl oxygen atoms are found to be aligned in the hydantoin ring plane.
A view of the deformation electron density in the plane perpendicular to the C—F bonds (Figure 6d) reveals the presence of the 3 fluorine electron lone pairs.
3.5 Topology of the covalent bonds
The topological analysis of the total electron density (r) and the bond critical points (BCP) localization was performed using VMoPro.21 The BCP topological parameters are
summarized in Table 5. The average standard uncertainties of the position and of the density at the BCP point are estimated to be about 10-3 Å and 0.05 e/Å3, respectively. The relative standard uncertainty on the Laplacian values is estimated to be 10%.44 All chemical bonds of the fidarestat crystal are characterized by (3,-1) bond critical points. Two (3,+1) ring critical points (CP) are localized in the center of the chroman ring’s fluorophenyl-like part and of the hydantoin ring.
The topological properties of the fluorophenyl-like and hydantoin moieties (Table 5_supp) also correlate well with the structural features, with values for the BCP electron densities, Laplacian values, and corresponding bond lengths showing the expected consistency. The electron density at the BCP clearly decreases smoothly as a function of the bond distance (Table 5_supp).
The topological analysis clearly brings out the covalent character of the C14—F17 bond. The value of the Laplacian at CP located on the C14—F17 bond is -15.1 e/Å5, which is equal to the value -15(4) e/Å5 obtained for Csp2—F bond in p-fluoromandelic acid.45 The value of λ3
with 14.9 e/Å5 in the C14—F17 bond is close, in absolute values, to λ1 and λ2 with
respectively -15.5 e/Å5 and -14.5 e/Å5.42 It is obvious that the Laplacian on the C14—F17 bond differs from the other covalent bonds: one notices a change of sign along the bond path between the fluorine atom and the BCP, which does not appear with others bonds involving oxygen or nitrogen atoms (Figure 8).
The topological analysis allows the elucidation of the resonance scheme and electron delocalization on the five-membered hydantoin ring. Indeed, the differences in the topological properties of the C—N bonds clearly bring out the variation in charge density distribution around each nitrogen atom. The C7I—N1I covalent bond is clearly longer than the four other C—N bonds (Table 5). This is due to the nature of the C7I atom which is the only one not involved in a C=O double bond among all C—N carbon atoms. Therefore, the N1I—C2I, N4—C5 and N4—C2I bonds show a higher double bond character than N1I—C7I, which is clearly confirmed by the bond ellipticities (0.15, 0.16, 0.12 and 0.05 respectively). This behaviour shows the electron density resonance and delocalization in the N1I—C2I—N4— C5 fragment. This can also be observed on the static deformation electron density map (Figure 6b), which clearly shows a weaker bonding electron density on the N1I—C7I bond, when compared to the other C—N bonds of the hydantoin ring.
Despite the differences in the electronic environment around the oxygen atoms, the topological properties of the three C=O bonds (C2I=O3I, C5=O6I and C19=O20) are close, the ellipticities ranging for instance from 0.14 to 0.18.
3.6 Net atomic charges
The zero-flux surfaces of the electron density gradient vector field
allow the partitioning of a molecule into atomic fragments.47 Therefore, atomic properties, such as volume, charge and higher order electrostatic moments, can be derived by numerical integration over the atomic basins defined by the zero-flux surface. To evaluate the atomic volumes and charges, the InteGriTy program48 was used. The total integrated atomic volume per cell is 1179.09 Å3;compared to the measured unit-cell volume of 1183.56(17) Å3, resulting in a 0.38 % error.
Several recent studies49-52 suggest a conservative estimate of about ± 5% for the accuracy of the integrated atomic properties; the electron populations are however less sensitive to integration errors. The sum of all topological charges is +0.004 |e| for the fidarestat molecule, almost electroneutrality, therefore is an indicator of reliability.
The atomic charges qPv= Nval-Pval derived from the experimental monopole valence
populations, and qAIM integrated over the atomic basins are shown in Table 3. In view of the
differing partitioning schemes used in these methods, it is not surprising that there are some major disagreements.
The N, O and F atoms bear all a negative charge, with both definitions, in accordance with their electronegative nature. All the hydrogen atoms have positive qAIM and qPv charges. In all
cases, the Csp3—H hydrogen atoms are positively charged as expected.
The AIM method leads generally to significantly stronger charges, with a substantial negative charge on the fluorine (-0.540 |e|), nitrogen (-1.030.07 |e| on average), and the oxygen atoms (<qAIM> = -1.140.07 |e|). The net negative charges of the carbonyl oxygen atoms are slightly
stronger than that of the ether group, which is in accordance with their higher propensity for H-bond formation. In the crystal packing of fidarestat, all the oxygen atoms are indeed hydrogen bonds acceptors.
The qPv charges of the carbon atoms show a relatively large range (-0.24 |e| to +0.35 |e|)
(Table 3) and seem to be related to the chemical nature of bonded atoms. Nevertheless, the carbon qAIM charges are more contrasted. The sign and magnitude of qAIM charges are
generally in accordance with the charge transfer expected from the electronegativity of their neighbour atoms. The carbonyl >C=O carbon atoms have a strong positive qAIM charge upper
than 1.30 |e|. The fluorophenyl-like moiety carbon atoms C14 and C11, respectively bonded to F17 and O10, but also the sp3-carbon atoms C9 and C7I bonded to O10 and N1I have a significant positive qAIM charge around 0.50 |e|. All carbon atoms bonded to hydrogen atoms
are nearly neutral.
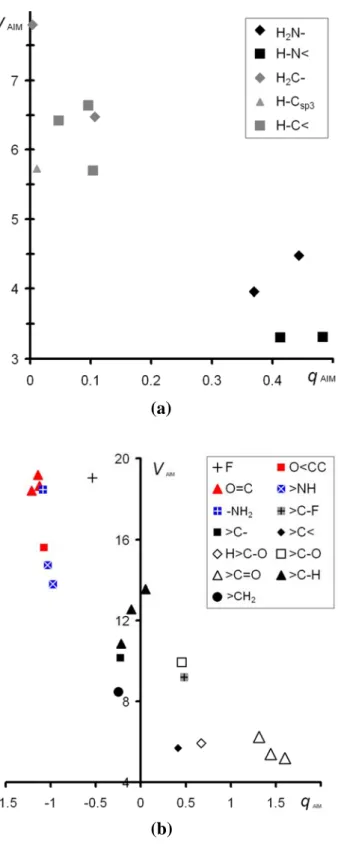
The qAIM charges are plotted versus the topological atomic volumes VAIM in Figure 9. For the
non-hydrogen atoms (Figure 9b), the spots distribution displays a significant split between electronegative atoms (O, N and F), which are negatively charged, and carbon atoms. The latter have the tendency to be neutral or positive, depending on the atoms they are bonded to. A more precise analysis highlights smaller clusters corresponding to different atom types characterized by their chemical environment. For instance, the three spots of the O=C< type oxygen atoms are close to each other; these three atoms have high negative charges and correlatively large topological volumes. In the same way, their neighbour >C=O carbon atoms form a well defined cluster as already shown by us in 53.
The qAIM vs. VAIM plot for H atoms also displays a similar clustering of the spots (Figure 9a).
The H atoms bonded to nitrogen atoms have strong positive charges while those bonded to carbon atoms have qAIM around +0.1 |e|. These two groups of spots are merely linked to the
difference of electronegativity of the bonded carbon and nitrogen atoms. We note, for each atomic chemical type, that the atom with the largest qAIM charge does not necessarily have the
smallest VAIM volume especially for hydrogen atoms, because the volumes are limited by the
intermolecular interactions.
The clustering of the atoms with a similar nature and chemical environment provides support for the refinement strategy used for this work. Each cluster of similar atoms can be drawn in parallel with the corresponding pseudo-atoms equivalence constraints that were applied at the early stages of the multipolar refinement.
The total atomic basin charges of the hydantoin ring and of the carbamoyl group are close to electroneutrality (+0.015 |e| and -0.104 |e| respectively). Conversely, the fluorophenyl-like moiety of the chroman ring shows a significant positive total charge qAIM (+0.459 |e|). This
positive charge is explained by the presence of the bonded oxygen atom O10 (Figure 2) which withdraws electrons from the carbon C11 (qAIM = +0.455 |e|).
3.7 Intermolecular interactions
- Electrostatic potential of fidarestat
Mapping the electrostatic potential on molecular surfaces provides information on the topology of the charges distribution. The electrostatic potential generated by an isolated fidarestat molecule, i.e. extracted from the crystal lattice, was computed using VMoPro21 from the experimental electron density (Figure 12).
Generally speaking, the C—F bond, also called “organic fluorine”, has been an interesting aspect of the charge distribution analysis in fluoro compounds.42-43 A broad electronegative surface extends from the fluorine atom to the oxygen atoms O6I and O20 sites. This result is in agreement with their negative charges. If the qpv = Nval-Pval values of the oxygen atoms are
only slightly negative, some of the charge transfer between atoms occurs also partly through the multipoles. It is of interest to note that the negative potential generated by the carbonyl groups is much stronger than that around the fluorine atom. The high negative potentials around the carbonyl groups are correlated with their ability to be strong acceptors in H…O hydrogen bonds.
The electropositive surfaces are all well separated around the H221—N21—H121 group and the two imino groups of the hydantoin moiety (N1I—H1I and N4—H4). This correlates with the stronger positive qAIM charges of the H—N hydrogen atoms bound to nitrogen atoms
compared to H—C atoms. Therefore, the polar binding sites of the fidarestat molecule are clearly visible on Figure 12: the electropositive potential generated by the N4—H4 group is flanked by the two electronegative zones arising from the carbonyl moieties.
- Topology of H…O hydrogen bonds
According to the theory of atoms in molecules,47 a H…O contact might be considered as a hydrogen bond if, among other conditions defined by Koch & Popellier,54 there is a critical point along the H···O path. The search of the (3,-1) critical points for the eight H…O interactions revealed six unique CPs.
The only intramolecular interaction, N21—H121 ... O10, is weak as the N—H…O angle is only 104(1)°. This polar interaction closes an intramolecular cycle and does not display a critical point. The H121…O10 interaction is located on the border of the molecule which generates significant electron density gradient inwards in the whole region around the two atoms. Due to geometric characteristics of the five membered cycle (H121—N21—C19— C9—O10...), there is no electron density CP in the cycle nor on the interaction path. However, the norm of the gradient shows a minimum in the cycle, which is not zero.
The topological values for the hydrogen bonds are summarized in Table 4. The two strongest hydrogen bonds according to geometric criteria have the highest electron density at their critical points: cp0.146 e/Å3 for N1I–H1I…O20 and 0.196 e/Å3 for the N4–H4…O3I
hydrogen bond. Their Laplacian values are positive, with 2.32 e/Å5 and 3.38 e/Å5 respectively, which is a characteristic of closed-shell interactions.47 For the longer N21— H121…O6I interaction, the CP lies closer to the H121 atom. This long interaction is also characterized by a lower CP electron density (0.047 e/Å3). There are three Csp2—H…O=C
weak hydrogen bonds in the crystal packing. The shorter the donor-acceptor distance is, the higher the electron density and Laplacian magnitudes are at the CP of the interaction (Table 4).
The search of CP’s allowed to highlight two additional intermolecular interactions between hydrogen atoms and the fluorophenyl-like moiety of a chroman ring (Figure 10). These unusual interactions can be considered as weak hydrogen bonds where the hydrogen acceptor is a -system, typically an aromatic ring. This type of intermolecular X—H… interactions (with X = O, N, C) are often observed in protein structures57 and, more generally, in crystal structures where there is a lack of usual hydrogen bond acceptors.58. Such interactions are mostly schematically described as a T shape contact where a hydrogen atom is close to the center of an aromatic ring. However, the study of hydrogen bonds involving phenyl rings, carried out by Malone et al.59 on Cambridge Structural Database structures,60 reveals that the interaction pattern is usually more diverse: the hydrogen atom may interact directly with carbon atoms of the aromatic ring. The fluorophenyl-like moiety of the fidarestat is not a standard phenyl ring as it shares the C11—C12 bond with the adjacent cycle, and has the fluorine atom bonded to C14. When compared to a standard phenyl ring, these modifications disturb the axial symmetry of the cycle and thus support the possibility of direct hydrogen bonding with selected parts of the ring.
The first of the two X—H… interactions in the fidarestat crystal involves the C13—C14 group of the fluorophenyl-like ring and the H9—C9 moiety. Figure 11a shows the gradient lines of the static electron density in the (C13—H13, H9) plane of the two hydrogen bonds. In particular, a bond path between H9 and the C13 nucleus exists for the C9—H9… interaction. The CP is found in the plane defined by the atoms C13, H13 and H9 (Figure 11a). The Csp2 atom which is the closest to the hydrogen atom H9 is C13, with a distance of 2.628(9) Å. The next closest distance d=3.04(1) Å is to atom C14. The C9—H9 … C13 angle has a 153.4(8)° value while the C9—H9 bond is almost perpendicular to the ring plane (the angle with vector normal to the mean plane is 11°).
The second X—H… hydrogen bond involves N21—H221 as donor which interacts with the C13—C14 group from the other side of the aromatic ring (Figure 11b). The BCP of this N21—H221… interaction is localized in the plane defined by atoms C13, C14 and H221 as can be seen in Figure 11b. The N21—H221 bond forms an angle of 43° with the vector normal to the phenyl-like mean plane. The geometric characteristics of the N21—H221… interaction show that the atoms which are closest to H221 are C14 and C13, respectively at distances 2.62(1) Å and 2.81(1) Å. The interaction N21—H221… is rather unusual with respect to the X—H… bonds studied by Malone et al.59, as the H… BCP is almost located
at equal distance to the C13 and C14 atoms (Figure 11b). The angle formed by N21—H221 …C14 is 144(1)°, which is more favourable than the N21—H221…C13 angle of 115(1)°. The position of H221 with respect to the fluorophenyl-like ring and the orientation of the N21—H221 bond favour an interaction mostly with the C14 atom. Indeed, the electron density gradient lines (Figure 11b) reveal a bond path between the H221 and C14 atoms. However, considering experimental electron density uncertainty and the geometrical criteria, the bond path could also be between H221 atom and the C13—C14 covalent BCP. Bond paths between an atom and a BCP were already observed, for instance, in carbides complexes involved in Sc…C=C bonds.61
These two C—H… interactions are quite weak according to their Laplacian values lower than 1 e/Å5, which is related to the poor overlapping of the atoms electron shell. However, these weak interactions present (3,-1) BCPs and the electron density values at CPs are comparable to those usually found for C—H…O hydrogen bonds, which are now commonly admitted as valid hydrogen bonds, especially in biological structures.62 These H… interactions contribute to the electrostatic interaction energy of the corresponding fidarestat dimers as shown below.
3.8 Crystal packing and electrostatic interaction energy
The electrostatic interaction energy was computed (Table 4) for each dimer of neighbouring fidarestat molecules involved in hydrogen bonding. In dimer #1, there are three hydrogen bonds contributing to the intermolecular interaction (Figure 5a). The strongest one is the N1I—H1I…O20 hydrogen bond between the imino group N1I—H1I of the hydantoin ring and the carbamoyl oxygen atom O20. The second H-bond C13—H13…O6I, between a fluorophenyl-like moiety and a hydantoin ring, is weak. The third H-bond C9—H9…C13 is also weak as described in the previous section.
In dimer #2, the hydantoin rings of both molecules interact only via the N4—H4…O3I hydrogen bond (Figure 5b). If the donor-acceptor distances of these two N—H…O hydrogen bonds are compared, the N4—H4…O3I interaction is shorter (dN…O = 2.801(1) Å) than N1I—
H1I…O20 (dN…O = 2.847(1) Å). Furthermore, N4, H4 and O3I are nearly aligned (N—H…O
angle of 168(2)°), while the N1I—H1I…O20 hydrogen bond forms a less favourable angle of 146(1)° (Table 2). Thus, from distance and angle considerations, the hydrogen bond N4— H4…O3I should be stronger than N1I—H1I…O20. This is also confirmed by the electron
density value at the CP which is 5.12 e/Å3 (Table 4). The total electrostatic interaction for dimer #1 is the strongest with -56 kJ.mol-1 compared to -44 kJ.mol-1 for dimer #2. This is a consequence of the two additional weak contacts C13—H13…O6I and C9—H9…C13, which obviously contribute to the stabilization of the first dimer.
With an energy of -16 kJ.mol-1, dimer #3 has the weakest total electrostatic interaction. This observation is in agreement with the longer donor-acceptor distance of 3.156(1) Å in the C15—H15...O3I hydrogen bond (Figure 5c). The hydrogen bonds where C—H is the donor group are also known to be weaker than those involving N—H or O—H moieties.62 The positive charge qAIM of the H—C hydrogen atom is indeed about one quarter (+ 0.104 |e| for
H15) compared to the charge of H—N hydrogen atoms (Table 3).
The electrostatic interaction energy computed for dimer #4 is -24 kJ.mol-1 (Table 3). This
dimer has a weak hydrogen bond N21—H121...O6I with a long donor-acceptor distance
dNO=3.374(1) Å (Figure 5d). This is the weakest hydrogen bond (excluding the H…
interactions) in the fidarestat crystal according to its electron density at the CP of 0.047 (Table 4). Dimer #4 is also characterized by a hydrogen bond with acceptor between the hydrogen atom H221—N21 of the carbamoyl moiety and the C14 sp2 atom of the fluorophenyl-like ring. The addition of these two weak hydrogen bonds results in a total electrostatic interaction energy of dimer #4 which is significantly higher than that of dimer #3.
In conclusion, such weak H… interactions contribute in the crystal packing energy and should not be neglected. This should also be the case when one evaluates the protein ligand interaction.
This energy calculation is achieved by integrating the total charge distribution of one molecule with the electrostatic potential generated by the total charge distribution of a second. Such an approach is pertinent in the case of Fidarestat, as the electrostatic contribution to the molecule-molecule interaction energy is expected to be the dominant compared to the dispersion energy distribution (e.g. π-staking interactions, weak – but cooperatively additive van der Waal’s interactions). Fidarestat has a highly polar (and hence electrically charged) nature which is confirmed by the 7.7 Debye dipolar moment of fidarestat in the crystal. For comparison, the dipolar moment generated by the mainchain of a dipeptide in an ideal α-helix conformation is around 10.6 Debye. Another characteristic of fidarestat which indicates that dispersion energy is not a major contribution is the T-shape structure of the molecule that prevents the close packing of the π-systems of different molecules in the crystal.
4. Electrostatic interactions of fidarestat in the protein active site
The X-ray structure of human aldose reductase (hAR) in complex with the NADP+ cofactor and the inhibitor fidarestat (SNK-860) was determined at 0.92 Å resolution (PDB code: 1PWM) by El-Kabbani et al.4 The crystal structure refinement at atomic resolution of the hAR-fidarestat complex allows the positioning of hydrogen atoms for the inhibitor, the coenzyme NADP+ and the active-site amino acids. A complete determination of the multiple conformations was also achieved by El-Kabbani et al.4
To elucidate the binding affinity of fidarestat with human Aldose Reductase, El-Kabbani et
al.67 have also determined the structure of complex of hAR with (2R,4S) stereoisomer of fidarestat at 1.4 Å resolution (PDB code: 1X97). The (2R,4S) stereoisomer can be distinguished from the fidarestat inhibitor ((2S,4S) stereo-isomer) by a configuration change of its C9 chiral carbon atom.
Their study suggests, based on geometric considerations, explanations about the relative inhibition efficiency between fidarestat and its (2R,4S) stereoisomer.
4.1 Electron density models
Here, we perform electrostatic interaction energy calculations between these inhibitors and hAR active site residues based on multipolar electron density models. Studying quantitatively the contribution of each active site residue to the electrostatic interaction can bring reliable information about their relative importance.
To model the multipolar electron density, molecular structures including all hydrogen atoms are needed. This step was achieved using the MolProbity68 server which adds hydrogen atoms according to stereochemistry and optimal hydrogen bonding network. For each complex, the electron density model of the protein was obtained by transfer from the Experimental Library of Multipolar Atom Model (ELMAM library).15 The electron density of the NADP+ coenzyme was derived from the charge density analysis of NAD+ coenzyme63 and from the library.
In order to reduce intermolecular interaction effects due to the specific chemical environment in the fidarestat crystal, the transferred charge density parameters of the ligand are derived from a multipolar molecular model corresponding to an intermediate step of refinement where the atomic equivalence and symmetry constraints are still maintained.
The fidarestat molecule shows an overall rigidity, except for its carbamoyl moiety due to the dihedral angle rotation around the covalent bond C9—C19. The O10-C9-C19-O20 dihedral angle value is169.8° in the fidarestat crystal, 181.0° in the fidarestat-hAR complex and 57.1° in the stereo-isomer.
We notice, considering only non hydrogen atoms, a small root mean square difference (rmsd) for covalent bond distances of 0.012 Å between the two structures in the crystal and in the protein active site. A rmsd of bond angles between the two conformations of 1.6° for non hydrogen atoms is also observed. These small rmsd values clearly support the transferability of the charge density parameters of fidarestat.
The multipolar model of fidarestat in the crystal was also be transferred to (2R,4S) stereoisomer. The rmsd for covalent bond distances is 0.024 Å and the rmsd for bond angles is 6.2° between the fidarestat crystal conformation and the (2R,4S) conformation in the hAR protein active site. In spite of the configuration change of C9 carbon atom, the local covalent environment of atoms is preserved, which is in favor of a multipolar parameters transfer.
4.2 Electrostatic interaction energies
The total electrostatic interaction energies between the inhibitors and their neighbouring residues in the hAR active site were calculated (Table 5).
The hydantoin moiety of fidarestat ligand is anchored in the anion-binding site located between the nicotinamide ring of the coenzyme, and the active site residues Tyr48, His110, and Trp111 by three major hydrogen bonds (Table 5) as described by El-Kabbani et al..67 The two carbonyl groups C5=O6I and C2I=O3I of the hydantoin ring are hydrogen-bonded respectively to the hydroxyl hydrogen atom of Tyr48 and the N1—H1 moiety of Trp111. Between them, the hydantoin N4—H4 group forms a hydrogen bond with the N2 atom of His110. Hence, the specific electrostatic potential pattern of the hydantoin head of fidarestat (Figure 12) is facing in hAR active site chemical moieties of opposite, complementary, charges. Furthermore, the hydantoin moiety is in van der Waals contact with the nicotinamide
ring of NADP+. In the (2R,4S) stereoisomer – hAR complex, the cyclic imide ring is in the same configuration as in the anion binding pocket. Thus, (2R,4S) stereoisomer displays the same hydrogen bonds with Tyr48, His110 and Trp111 within similar interaction distances (Table 5). In the same way, the (2R,4S) stereoisomer interacts with the nicotinamide moiety of NADP+ cofactor.
The electrostatic interaction energy values are in good agreement with this observation. At first sight, we notice no relation between H-bond Donor-Acceptor distances and total electrostatic interaction energy values. As shown in the section dedicated to the electrostatic interaction energy in the fidarestat crystal, intermolecular interactions cannot be reduced to pairs of atoms. Thus, the absence of correlation emphasizes how much an atom pair-wise description of intermolecular interactions is crude.
Moreover, even if the hydrogen bonding network is preserved in (2R,4S) stereoisomer – hAR complex, the total electrostatic interaction energy of the (2R,4S) isomer hydantoin moiety with its interacting neighbours is less favourable that in fidarestat case with respectively -124 kJ.mol-1 and -152 kJ.mol-1 (Table 5).
The chroman ring of fidarestat is involved in short contacts with the side-chains of Trp20, Phe122 and Trp219 residues. Interestingly, Trp20 indole moiety is interacting also with the N1I—H1I group of the hydantoin moiety through a H…π hydrogen bond, leading to a strong attractive electrostatic interaction energy of -46 kJ.mol-1. These short contacts can be observed in the (2R,4S) stereoisomer – hAR complex active site, especially the H… π hydrogen bond between the inhibitor’s hydantoin moiety and Trp20’s indole moiety (shortest distance) with a comparable electrostatic interaction energy of -40 kJ.mol-1.
The carbamoyl group C19—O20 of fidarestat is involved in a hydrogen bond (2.95 Å) with the main-chain N—H of Leu300. This hydrogen bond seems to have a major role in the higher affinity of fidarestat for hAR than with Aldehyde Reductase.9
There are close contacts between the side-chains of Trp219 and Cys298 (3.61 Å and 3.29 Å, respectively) and fidarestat’s carbamoyl group, which are significantly different in the case of (2R,4S) stereoisomer. The hydrogen bond between the carbamoyl group and the Leu300 main-chain N—H is still observed (2.80 Å), but the configuration change of the C9 chiral carbon atom in the binding site induces shorter close contacts between the side-chains of
Trp219 and Cys298, and the carbamoyl moiety (3.00 Å and 2.98 Å, respectively). This fact may contribute to the weaker affinity of the (2R,4S) isomer according to El-Kabbani et al.67 This is confirmed from an electrostatic point of view, as the shorter contacts of the (2R,4S) stereoisomer with Trp219 and Cys298 residues are less favourable with total electrostatic interaction energies of 20 kJ.mol-1 and 38 kJ.mol-1 respectively, while they are only 12 kJ.mol
-1 and 6 kJ.mol-1 in the case of fidarestat.
To summarize, the total electrostatic energies between the hAR active site and the inhibitors are -209 kJ.mol-1 for fidarestat ((2S,4S) stereoisomer) and -130 kJ.mol-1 for (2R,4S) stereoisomer, which leads to a difference of -79 kJ.mol-1 in favour of fidarestat. The active site residues can be classified in three groups depending on which moiety of fidarestat they dominantly interact with (chroman ring, hydantoin moiety or carbamoyl moiety). The total electrostatic energy difference related to each group can be computed.
The atoms interacting with the hydantoin moiety (His110, Trp111, Tyr48, Trp20, NADP+ nicotinamide group) induce an electrostatic energy difference of -34 kJ.mol-1 in favour of fidarestat. For the neighbours of the chroman ring (Val47, Phe122 and Trp79), this difference is around +4 kJ.mol-1 in favour of (2R,4S) stereoisomer, which is not significant. Finally, the neighbours of the carbamoyl moiety (Leu300, Ala299, Cys298 and Trp219) are responsible for the largest energy difference with -49 kJ.mol-1 in favour of fidarestat.
This last result agrees with the structural description performed by El-Kabbani et al.67 with the predominant role attributed to the carbamoyl moiety. Although the hydrogen bond network between the hydantoin moiety of the inhibitors and the anion binding pocket is well preserved with very similar interatomic distances, slight conformation changes affect dramatically total electrostatic interaction energy values. This effect cannot be predicted without quantitative energy computations.
It is noteworthy that the sums of total electrostatic interaction energies around a fidarestat molecule is stronger in the complex with hAR/NADP+ (Table 5) than in the crystal (-140 kJ/mol, Table 4). The fidarestat chemical groups involved in the major interactions are the same, namely the hydantoin moiety and the oxygen atom of the carbamoyl moiety. The energy difference between the two fidarestat conformers in vacuo was computed with the
software Gaussian using Density Functional Theory method at the B3LYP level with 6311+(d,p) basis set. The energy is 1028.6395 Hartree for the crystal conformation and -1028.6333 Hartree for the protein bound conformation. The internal energy is 0.0061 Hartree or 16.2 kJ.mol-1 less favorable for the protein bound conformer. This can be related to the stronger total electrostatic energy and to the mix of attractive and repulsive interactions in the protein bound ligand.
5. Conclusion and perspectives
The hydrogen bonding pattern in the fidarestat crystal packing was analyzed. It exhibits notably interactions between the π-orbitals of the fluorophenyl-like ring and two hydrogen atoms.
The substrate recognition and binding efficiency are directly related to the charge distributions of the ligand and of the enzyme active site. The electrostatic potential pattern of the hydantoin moiety is complementary, in a key-lock manner, with the charges of hydrogen bonded groups in the hAR active site as revealed by electrostatic potential analysis.
The experimental multipolar atomic model of fidarestat was used for a new analysis of the hAR protein / ligand interactions and electrostatic energy computations. The charge density of the protein was transfered according to the principle of multipolar parameter transferability from the ELMAM database.15 Transferability of multipolar parameters allows to obtain a highly detailed electron density description of the inhibitor-enzyme complex from which accurate interaction properties can be derived. This level of description can provide an original view of electrostatic interactions to understand inhibitor-protein recognition and specificity in docking studies.
Acknowledgements. This work was partly funded by ANR grant NT05-3_41509
(programme blanc). We acknowledge the help of Dr. W. Morgenroth for the use of the D3 beamline at Hasylab/DESY (Hamburg). The authors thanks the referees for their useful remarks.
Supporting Information Available: All information about multipolar electron density model
with anisotropic hydrogen atoms are given in Tables 9S, 10S, 11S and 12S, and Figure 17S. More detailed informations about topological properties analysis of fidarestat covalent bonds
are also summarized in Tables 5S. This material is available free of charge via the Internet at http:/pubs.acs.org.
References
(1) Hotta, N.; Toyota, T.; Matsuoka, K.; Shigeta, Y.; Kikkawa, R.; Kaneko, T.; Takahashi, A.; Sugimura, K.; Koike, Y.; Ishii, J.; Sakamoto, N. Diabetes Care 2001, 24, 1776-1782. (2) Oka, M.; Matsumoto, Y.; Sugiyama, S.; Tsuruta, N.; Matsushima, M. J. Med. Chem. 2000,
43, 2479-2483.
(3) Cachau, R.; Howard, E.; Barth, P.; Mitschler, A.; Chevrier, B.; Lamour, V.; Joachimiak, A.; Sanishvili, R.; Van Zandt, M.; Sibley, E.; Moras, D. & Podjarny, A. J. de Physique
2000, 10, 3-13.
(4) El-Kabbani, O.; Darmanin, C.; Schneider, T. R.; Hazemann, I.; Ruiz, F.; Oka, M.;Joachimiak, A.; Schulze-Briese, C.; Tomizaki, T.; Mitschler, A.; Podjarny, A.
Protein, 2004, 55, 805-813.
(5) Howard, E. R.; Sanishvili, R.; Cachau, R. E.; Mitschler, A.; Chevrier, B.; Barth, P.; Lamour, V.; Van Zandt, M.; Sibley, E.; Bon, C.; Moras, D.; Schneider, T. R.; Joachimiak, A.; Podjarny, A. Proteins 2004, 55, 792-804.
(6) Pfeifer, M. A.; Schumer, M. P.; Gelber, D. A. Diabetes 1997, 46, S82-S89.
(7) Costantino, L.; Rastelli, G.; Vianello, P.; Cignarella, G.; Barlocco, D. Med. Res. Rev.
1999, 19, 3-23.
(8) Yasuda, H.; Terada, M.; Maeda, K.; Kogawa, S.; Sanada, M.; Haneda, M.; Kashiwagi, A.; Kikkawa, R. Prog. Neurobiol. 2003, 69, 229-285.
(9) El-Kabbani, O.; Carbone, V.; Darmanin, C.; Oka, M.; Mitschler, A.; Podjarny, A.; Schulze-Briese, C.; Chung, R. P. J. Med. Chem. 2005, 48, 5536-5542.
(10) Petrova, T.; Steuber, H.; Hazemann, I.; Cousido-Siah, A.; Mitschler, A.; Chung, R.; Oka, M.; Klebe, G.; El-Kabbani, O.; Joachimiak, A.; Podjarny, A. J. Med. Chem. 2005, 48, 5659-5665.
(11) Asano, T.; Saito, Y.; Kawakami, M.; Yamada, N. J. Diabetes Complicat. 2002, 16, 133-138.
(12) Kim, D.; Hong, S.I.; Lee, D.S. Int. J. Mol. Sci 2006, 7, 519-536.
(13) Muzet, N.; Guillot, B.; Jelsch, C.; Howard, E.; Lecomte, C. Proc. Nat. Acad. Sci. U.S.A.
2003, 100, 8742-8747.
(14) Guillot, B.; Jelsch, C.; Podjarny, A.; Lecomte, C. Acta Cryst., 2008, D64, 567-588. (15) Zarychta, B.; Pichon-Pesme, V.; Guillot, B.; Lecomte, C.; Jelsch, C. Acta Crystallogr.
2007, A63, 108–125.
(16) Kabsch, W. J. Appl. Cryst. 1993, 26, 795-800. (17) DeTitta, G. T. J. Appl. Crystallogr. 1985, 18, 75–79. (18) Blessing, R. H. Acta Crystallogr. 1995, A51, 33–38.
(20) Guillot, B.; Viry L.; Guillot, R.; Lecomte, C.; Jelsch,C. J. Appl. Cryst. 2001, 34, 214-223.
(21) Jelsch, C.; Guillot, B.; Lagoutte, A.; Lecomte, C. J. Appl. Cryst. 2005, 38, 38-54. (22) Clementi, E.; Raimondi, D.L. J. Chem. Phys. 1963, 38, 2686.
(23) Kissel, L.; Zhou, B.; Roy, S. C.; Sen Gupta, S. K.; Pratt, R. H., Acta Crystallogr. 1995,
A51, 271-288.
(24) Flack, H. D. Acta Crystallogr. 1983, A39, 876-881.
(25) Flack, H. D.; Bernardinelli, G. J. Appl. Cryst. 2000, 33, 1143-1148 (26) Hansen, N. K.; Coppens, P. Acta Crystallogr. 1978, A34, 909-921. (27) Clementi, E.; Roetti, C. At. Data Nucl. Data Tables 1974, 14, 177-478.
(28) Allen, F. H.; Kennard, O.; Watson, D.; Brammer, L.; Orpen, A.; Taylor, R. International
Tables for Crystallography, Vol. C, Chapter 9.5, pp. 685-706. Dordrecht: Kluwer Academic Publishers, 1992.
(29) Stewart, R. F.; Davidson, E. R.; Simpson, W. T. J. Chem. Phys. 1965, 42, 3175-3187. (30) Volkov, A.; Abramov, Y.; Coppens, P. Acta Crystallogr. 2001, A57, 272-282.
(31) Sørensen, H.O.; Stewart, R.F.; McIntyre, G.J.; Larsen, S., Acta Crystallogr. 2003, A59, 540-550, supplementary materials.
(32) Schomaker, V.; Trueblood, K. N. Acta Crystallogr. 1998, B54, 507-514. (33) Madsen, A.Ø. J. Appl. Cryst. 2006, 39, 757-758.
(34) Madsen, A.Ø.; Sørensen, H.O.; Flensburg, C.; Stewart, R. F.; Larsen, S. Acta
Crystallogr. 2004, A60, 550-561.
(35) Hirshfeld, F. L. Acta Crystallogr. 1976, A32, 239-244.
(36) Etter, M. C.; MacDonald, J. C.; Bernstein, J. Acta Crystallogr. 1990, B46, 256-262. (37) Bernstein, J.; Davis, R. E.; Shimoni, L.; Chang, N.-L. Angew. Chem. Int. Ed. Engl. 1995,
34, 1555-1573.
(38) Bondi, A. J. Phys. Chem. 1964, 68, 441-452.
(39) Rowland, R. S.; Taylor, R. J. Phys. Chem. 1996, 100, 7384-7391.
(40) Espinosa, E.; Alkaorta, I.; Elguedo, J; Molins, E. J. Chem. Phys. 2002, 117, 5529-5542. (41) Bach, A.; Lentz, D.; Luger, P J. Phys. Chem. A 2001, 105, 7405- 7412.
(42) Hibbs, D. E.; Overgaard, J.; Platts, J. A.; Waller, M. P.; Hursthouse, M. B. J. Phys.
Chem. B 2004, 108, 3663-3672.
(43) Chopra, D.; Cameron, T. S.; Ferrara, J. D.; Guru Row, T. N. J. Phys. Chem. A 2006, 110, 10465-10477.
(44) Espinosa, E.; Molins, E.; Lecomte, C. Chem. Phys. Lett. 1998, 285, 170-173.
(45) Larsen, S.; Flensburg, C.; Bengacted, H. S.; Sørenson, H. O. Acta Crystallogr. 1999,
S55, 38.
(46) Pillet, S.; Souhassou, M.; Pontillon, Y.; Caneschi, A.; Gatteschi D.; Lecomte, C. New J.
(47) Bader, R. F. W. Atoms in Molecules: a Quantum Theory. The International Series: Monographs in Chemistry Oxford: Clarendon Press., 1990.
(48) Katan, C.; Rabiller, P.; Lecomte, C.; Guezo, M.; Oison, V.; Souhassou, M. J. Appl.
Cryst. 2003, 36, 65-73.
(49) Flensburg, C.; Madsen, D. Acta Crystallogr. 2000, A56, 24-28. (50) Aicken, F. M.; Popelier, P. L. A. Can. J. Chem. 2000, 78, 415-426.
(51) Volkov, A.; Gatti, C.; Abramov, Yu.; Coppens, P. Acta Crystallogr. 2000, A56, 252-258. (52) Bytheway, I.; Grimwood, D. J.; Jayatilaka, D. Acta Crystallogr. 2002, A58, 232-243. (53) Leherte, L.; Guillot, B.; Vercauteren, D. P.; Pichon-Pesme, V.; Jelsch, C.; Lagoutte, A.;
Lecomte, C. The quantum theory of atoms in molecules: from solid state to DNA and
drug design, Chapter 11, pp. 285-316, Matta C. F. & Boyd R. J., Wiley-VCH., 2007.
(54) Koch, U.; Popelier, P.L. J. Phys. Chem. 1995, 99, 9747-9754.
(55) Espinosa, E.; Lecomte, C.; Molins, E. Chem. Phys. Lett. 1999, 300, 745-748.
(56) Espinosa, E.; Souhassou, M.; Lachekar, H.; Lecomte, C. Acta Crystallogr. 1999, B55, 563-572.
(57) Steiner, T.; Koellner, G. J. Mol. Biol. 2001, 305, 535-57.
(58) Hanton, L. R.; Hunter, C. A.; Purvis, D. H. J. Chem. Soc., Chem. Commun. 1992, 1134-1136
(59) Malone, J. F.; Murray, C. M.; Charlton, M. H.; Docherty, R.; Lavery, A. J. J. Chem. Soc.,
Faraday Trans. 1997, 93, 3429-3436.
(60) Allen, F. H. Acta Crystallogr. 2002, B58, 380–388.
(61) Rohrmoser, B.; Eickerling, G.; Presnitz, M.; Scherer, W.; Eyert, V.; Hoffmann, R.; Rodewald, U; Vogt, C.; Pöttgen, R. J. Am. Chem. Soc. 2007, 129, 9356-9365. (62) Steiner, T. Cryst. Rev. 1996, 6, 1-51.
(63) Guillot, B,; Muzet, N.; Artacho, E.; Lecomte, C.; Jelsch, C. J. Phys. Chem. B 2003, 107, 9109-9121.
(64) Burnett, M. N.; Johnson, C. K. ORTEPIII 1996, Report ORNL-6895, Oak Ridge National Laboratory, Tennessee, USA.
(65) Macrae, C.F.; Edgington, P.R.; McCabe, P.; Pidcock, E.; Shields, G.P.; Taylor, R.; Towler M.; van de Streek, J. J. Appl. Cryst. 2006, 39, 453-457.
(66) DeLano, W.L. The PyMOL Molecular Graphics System, 2002 on World Wide Web
http://www.pymol.org.
(67) El-Kabbani O.; Darmanin, C.; Oka, M.; Schulze-Briese, C.; Tomizaki, T.; Hazemann, I.; Mitschler, A.; Podjarny, A. J. Med. Chem. 2004, 47, 4530-4537.
(68) Lovell S. C.; Davis I. W.; Arendall B. III; de Bakker P. I. W.; Word J. M.; Prisant M. G.; Richardson J. S.; Richardson D. C. Protein, 2003, 50, 437-450.
Chemical formula C12 H10 N3 O4 F
Space group P212121
Unit cell dimensions (Å) a = 6.0690(4), b = 12.5940(15), c = 15.4850(7)
Temperature (K) 100(2)
Radiation/ Wavelength (Å) Synchrotron / 0.450
Diffractometer Four-circle Huber, D3 beam-line, Hasylab No. measured reflections 317 438
No. unique reflections (I/σ(I) ≥ 0) 9991 Completeness to dmax = 0.495 Å 97.9 %
Rint(I)a 8.8 %
Average redundancy 31
Absorption correction Face indexing Transmission Tmax ; Tmin 0.995 ; 0.983
Atom Model Spherical
H_iso
Multipolar H_aniso No. of data / restraints 9991 / 20 9991 / 81
No. of variables 221 671
Goodness-of-fit (g.o.f.)b
0.801 0.399 Final indices (I/σ(I)>0) wR2(F)c
4.022 2.003 Largest residual electron density hole & peak (e.Å-3)
with I/σ(I)>3 and sinλ /σ ≤ 0.9 Å-1 -0.733 ; 0.855 -0.267 ; 0.224
Table 1: Diffraction data collection details and Crystallographic refinement statistics.
a Data internal agreement factor is defined as R
int(I) = (Iobs - <Iobs>) / Iobs.
b g.o.f. = [ w [F
obs - |Fcal|]2 / (n-p) ]1/2
c wR2(F) = [ w [ F
obs - k |Fcal| ]2 / w Fobs2 ]1/2
n is the number of reflections and restraints, and p is the total number of parameters refined. w
= 1/[2(F
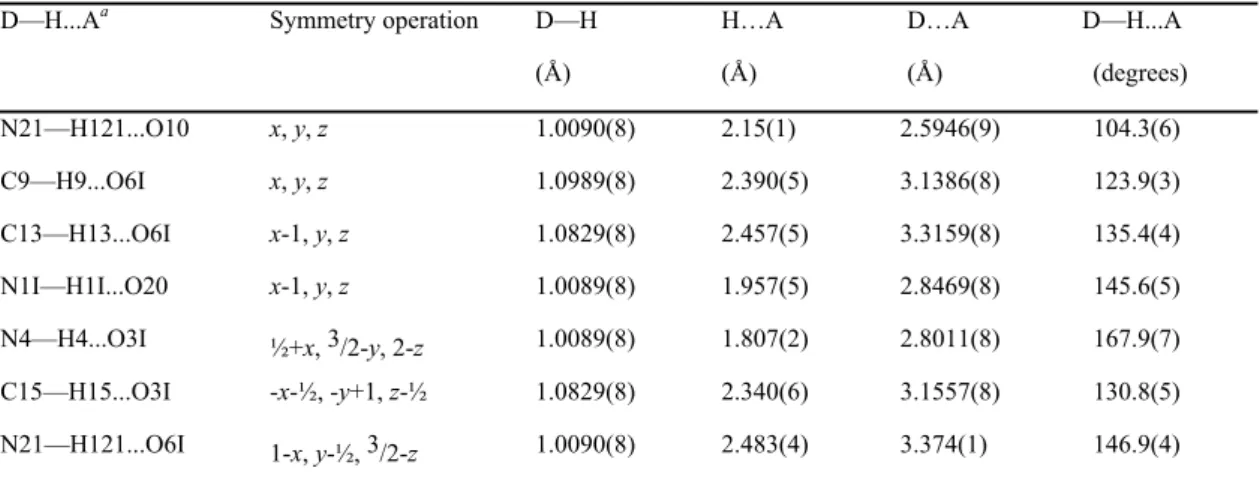
Table 2: Geometric characteristics of the intra and inter-molecular hydrogen bonds with D:
donor, A: acceptor, H: hydrogen atom.
D—H...Aa Symmetry operation D—H H…A D…A D—H...A
(Å) (Å) (Å) (degrees) N21—H121...O10 x, y, z 1.0090(8) 2.15(1) 2.5946(9) 104.3(6) C9—H9...O6I x, y, z 1.0989(8) 2.390(5) 3.1386(8) 123.9(3) C13—H13...O6I x-1, y, z 1.0829(8) 2.457(5) 3.3159(8) 135.4(4) N1I—H1I...O20 x-1, y, z 1.0089(8) 1.957(5) 2.8469(8) 145.6(5) N4—H4...O3I ½+x, 3/2-y, 2-z 1.0089(8) 1.807(2) 2.8011(8) 167.9(7) C15—H15...O3I -x-½, -y+1, z-½ 1.0829(8) 2.340(6) 3.1557(8) 130.8(5) N21—H121...O6I 1-x, y-½, 3/2-z 1.0090(8) 2.483(4) 3.374(1) 146.9(4)
Atom VAIM qpv qAIMa Atom type F17 19.03 -0.049 -0.540 O10 15.69 -0.314 -1.077 C-O-C O20 19.19 -0.333 -1.142 O3I 18.33 -0.386 -1.213 O=C O6I 18.65 -0.276 -1.125 N1I 13.79 -0.162 -0.975 >NH N4 14.74 -0.185 -1.033 N21 18.46 -0.257 -1.089 -NH2 C8I 8.46 -0.248 -0.079 >CH2 C16 13.54 0.051 0.033 C13 10.84 -0.220 0.018 >C-H C15 12.54 -0.104 0.021 C14 9.20 0.138 0.481 >C-F C12 10.13 -0.164 -0.227 >C- C7I 5.69 0.202 0.416 >C< C9 5.93 0.353 0.673 H>C-O C11 9.91 0.025 0.455 >C-O C2I 5.19 0.139 1.600 C5 5.39 0.265 1.444 >C=O C19 6.25 0.109 1.315 H221 4.48 0.238 0.444 H2N- H121 3.96 0.164 0.370 H4 3.30 0.202 0.413 H-N< H1I 3.31 0.245 0.483 H18I 6.48 0.139 0.107 H2C- H28I 7.80 0.076 0.004 H9 5.73 0.050 0.011 H-Csp3 H13 6.64 0.120 0.096 H15 5.70 0.114 0.104 H-C< H16 6.42 0.064 0.047
Table 3: Topological (AIM) charge (|e|) and volume (Å3), and
pseudo-atom charge qpv=Nval-Pval for each atom in fidarestat.
a The residual sum is
Σ
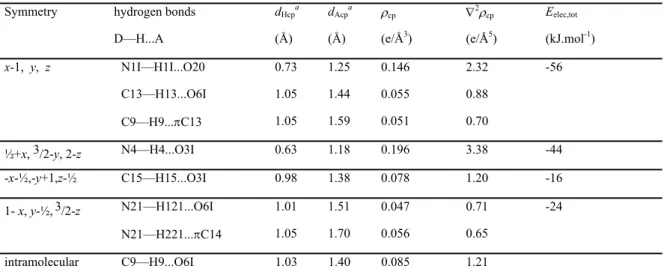
qTable 4: Topological properties at the critical point of the hydrogen bonds between molecules
in neighbouring molecules dimers found in the fidarestat crystal, and corresponding intermolecular electrostatic interaction energies.
a d
Hcp and dAcpare the distances between the bond critical point and, the hydrogen and the
acceptor atom A respectively.
Symmetry hydrogen bonds dHcpa dAcpa cp 2cp Eelec,tot
D—H...A (Å) (Å) (e/Å3) (e/Å5) (kJ.mol-1)
x-1, y, z N1I—H1I...O20 0.73 1.25 0.146 2.32 -56 C13—H13...O6I 1.05 1.44 0.055 0.88 C9—H9...C13 1.05 1.59 0.051 0.70 ½+x, 3/2-y, 2-z N4—H4...O3I 0.63 1.18 0.196 3.38 -44 -x-½,-y+1,z-½ C15—H15...O3I 0.98 1.38 0.078 1.20 -16 1- x, y-½,3/2-z N21—H121...O6I 1.01 1.51 0.047 0.71 -24 N21—H221...C14 1.05 1.70 0.056 0.65 intramolecular C9—H9...O6I 1.03 1.40 0.085 1.21
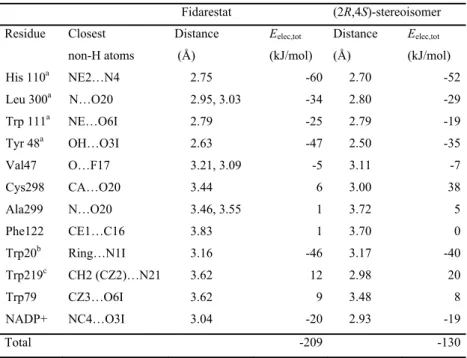
Residue Closest non-H atoms Distance (Å) Eelec,tot (kJ/mol) Distance (Å) Eelec,tot (kJ/mol) His 110a NE2…N4 2.75 -60 2.70 -52 Leu 300a N…O20 2.95, 3.03 -34 2.80 -29 Trp 111a NE…O6I 2.79 -25 2.79 -19 Tyr 48a OH…O3I 2.63 -47 2.50 -35 Val47 O…F17 3.21, 3.09 -5 3.11 -7 Cys298 CA…O20 3.44 6 3.00 38 Ala299 N…O20 3.46, 3.55 1 3.72 5 Phe122 CE1…C16 3.83 1 3.70 0 Trp20b Ring…N1I 3.16 -46 3.17 -40 Trp219c CH2 (CZ2)…N21 3.62 12 2.98 20 Trp79 CZ3…O6I 3.62 9 3.48 8 NADP+ NC4…O3I 3.04 -20 2.93 -19 Total -209 -130
Table 5: All interactions between the inhibitors and the hAR active site residues and
corresponding intermolecular electrostatic interaction energies are described. The closest non hydrogen atoms between the inhibitors and each residue are shown with the corresponding distances. For some interactions, two closest non-H atom distances are indicated because of structural disorder. a These residues are involved in H-bonds with
inhibitors. In this case, the closest heavy atoms distances correspond to Donor…Acceptor distances. b This interaction is an H-bond with a aromatic ring as acceptor. c The non-H atom of Trp219 residue is different in (2R,4S)-stereoisomer case and its label is indicated between parentheses.
plotted at 50% probability, and chemical diagram of fidarestat in frame.
Figure 3. View along the a axis of the crystal parking of the fidarestat molecule.The
Figure 4. Crystal packing diagram for fidarestat, showing the network of hydrogen bonds
(a) Dimer #1: x-1, y, z (b) Dimer #2: ½+x, 3/2-y, 2-z
(c) Dimer #3: -x-½, -y+1, z- ½ (d) Dimer #4: 1-x, y-½, 3/2-z
Figure 5. View of the four different hydrogen bonded dimers of fidarestat molecules
found in the crystal packing with their corresponding symmetry operators. The grey surfaces represent the experimental electron density iso-contour with a cut-off value of +0.05 e/Å3. Red, purple and grey dashed lines represent H-bonds, weak contacts and H…π-system bonds, respectively. Gray spheres represent intermolecular BCP’s. The view was made with program Pymol.66
(a) (b)
(c) (d)
Figure 6. Experimental static deformation electron density maps in the planes of: (a) the
carbamoyl moiety, (b) the hydantoin ring, (c) the fluorophenyl-like moiety of the chroman ring. In (d) the plane is perpendicular to the F17—C14 bond, outside of the F17—C14 segment at a distance of 0.1 Å to the fluorine atom. The vertical direction is perpendicular to the phenyl ring plane. Contours intervals are 0.05 e/Å3, positive and
Figure 8. Experimental Laplacian 2 distribution maps in the planes of the
fluorophenyl-like moiety of the chroman ring. Solid lines show negative contours and dashed lines show positive contours. Contours intervals are semi-log ±0.2, 0.4, 0.8, 2.0 … e/Å5. The positions of the bond and ring critical points are also shown.
(a)
(b)
Figure 9. Topological charge qAIM (in |e|) versus the topological volume VAIM (in Å3) for
for the hydrogen atoms (a) and for the C, N, O, F atoms (b). The atom type considered is the first atom in each chemical group name.
Figure 10. View of the hydrogen bonds with π acceptors in a trimer of fidarestat
molecules. The aromatic ring containing the C13—C14 atoms is involved on both sides in H…π-system bonds represented as grey dashed lines. The electron density cut-off value for the iso-surface is +0.05 e/Å3. The view was made with program Pymol.66
(a)
(b)
Figure 11. Gradient lines of the total electron density in the regions of the hydrogen
bonds with acceptors. In the planes defined by the atoms C13, H13 and H9 (a), and by the atoms C13, C14 and H221 (b). The most interesting CPs are indicated. The views were made using the VMoPro software.21 Intermolecular bond paths are added with bold black lines.
Figure 12. Deformation electrostatic potential ∆
(e/Å) generated by the isolated fidarestat molecule mapped on the solvent-excluded surface with a probe radius of 1.4 Å. The potential ∆ is derived from the deformation electron density ∆. The view was made with program Pymol.66
Figure 13. Main interactions between hAR active site residues and fidarestat
stereoisomers. The conformations of hAR complexed with fidarestat (in thick lines) and its hAR-(2R4S) isomer (in fine lines) are superimposed. The hydrogen bonds are represented in black dash lines, except the H…π hydrogen bond which is in red dash line. The view was made with program Pymol.66