HAL Id: hal-02199457
https://hal.archives-ouvertes.fr/hal-02199457
Submitted on 31 Jul 2019HAL is a multi-disciplinary open access archive for the deposit and dissemination of sci-entific research documents, whether they are pub-lished or not. The documents may come from teaching and research institutions in France or abroad, or from public or private research centers.
L’archive ouverte pluridisciplinaire HAL, est destinée au dépôt et à la diffusion de documents scientifiques de niveau recherche, publiés ou non, émanant des établissements d’enseignement et de recherche français ou étrangers, des laboratoires publics ou privés.
Functional adaptation of reactive saccades in humans: a
PET study
M. Desmurget, Denis Pelisson, J. Grethe, G. Alexander, C. Urquizar, C.
Prablanc, S. Grafton
To cite this version:
M. Desmurget, Denis Pelisson, J. Grethe, G. Alexander, C. Urquizar, et al.. Functional adaptation of reactive saccades in humans: a PET study. Experimental Brain Research, Springer Verlag, 2000, 132 (2), pp.243-259. �10.1007/s002210000342�. �hal-02199457�
Abstract It is known that the saccadic system shows adaptive changes when the command sent to the extraoc-ular muscles is inappropriate. Despite an abundance of supportive psychophysical investigations, the neurophys-iological substrate of this process is still debated. The present study addresses this issue using H215O positron emission tomography (PET). We contrasted three condi-tions in which healthy human subjects were required to perform saccadic eye movements toward peripheral visu-al targets. Two conditions involved a modification of the target location during the course of the initial saccade, when there is suppression of visual perception. In the RAND condition, intra-saccadic target displacement was random from trial-to-trial, precluding any systematic modification of the primary saccade amplitude. In the ADAPT condition, intra-saccadic target displacement was uniform, causing adaptive modification of the pri-mary saccade amplitude. In the third condition (station-ary, STAT), the target remained at the same location dur-ing the entire trial. Difference images reflectdur-ing regional cerebral-blood-flow changes attributable to the process of saccadic adaptation (ADAPT minus RAND; ADAPT minus STAT) showed a selective activation in the oculo-motor cerebellar vermis (OCV; lobules VI and VII). This finding is consistent with neurophysiological studies in monkeys. Additional analyses indicated that the cerebel-lar activation was not related to kinematic factors, and
that the absence of significant activation within the fron-tal eye fields (FEF) or the superior colliculus (SC) did not represent a false negative inference. Besides the con-tribution of the OCV to saccadic adaptation, we also ob-served, in the RAND condition, that the saccade ampli-tude was significantly larger when the previous trial volved a forward jump than when the previous trial in-volved a backward jump. This observation indicates that saccade accuracy is constantly monitored on a trial-to-trial basis. Behavioral measurements and PET observa-tions (RAND minus STAT) suggest that this single-trial control of saccade amplitude may be functionally dis-tinct from the process of saccadic adaptation.
Key words Saccadic adaptation · Saccade · Adaptation · PET · Cerebellum · FEF · Colliculus
Introduction
Saccades are fast eye movements that shift the point of gaze from one position to another. Although they ordi-narily occur too rapidly to be influenced by peripheral feedback loops, they exhibit a remarkable accuracy, sug-gesting that the sensory and motor components of the oculomotor system are precisely calibrated with each other. Throughout life, the adequacy of this calibration is constantly challenged by neural death, brain lesions, and biomechanical changes in the characteristics of the ocu-lomotor apparatus. This indicates that saccade precision can only be maintained through an adaptive process, which continually updates the relation between the re-quired displacement of the eyes and the oculomotor command. The existence of such a process was clearly demonstrated in patients presenting a monocular paresis of the extraocular muscles (Kommerell et al. 1976; Opti-can et al. 1985). In these patients, the normal yoking of the eyes is disrupted: while the unaffected eye exhibits normal saccadic responses, the deficient eye dramatical-ly undershoots the target. When the unaffected eye is patched, forcing the subject to view only through the de-M. Desmurget · J.S. Grethe · G.E. Alexander · S.T. Grafton
Department of Neurology, Emory University, Atlanta, GA 30322, USA
S.T. Grafton (
✉
)Department of Radiology and the PET imaging Center, Emory University, Atlanta, GA 30322, USA
M. Desmurget · D. Pélisson · C. Urquizar · C. Prablanc INSERM U534, Espace et Action, 16 av du Doyen Lépine, 69500 Bron, France
Current address: Scott T. Grafton,
Center for Cognitive Neuroscience, 6162 Moore Hall, Dartmouth College, Hanover, NH 03755, USA, e-mail: Scott.T.Grafton@dartmouth.edu, Tel.: +1-603-6460038, Fax: +1-603-6461181
Digital Object Identifier (DOI) 10.1007/s002210000342
R E S E A R C H A R T I C L E
M. Desmurget · D. Pélisson · J.S. Grethe G.E. Alexander · C. Urquizar · C. Prablanc S.T. Grafton
Functional adaptation of reactive saccades in humans: a PET study
Received: 9 September 1999 / Accepted: 27 December 1999 / Published online: 25 March 2000 © Springer-Verlag 2000
ficient eye, saccades gradually increase in size until movement accuracy is restored, which occurs after a few days of exposure. In accordance with Hering’s law of equal innervation, this adaptive increase in size is ob-served for the „normal“ eye as well, leading that eye to overshoot the target when the patch is removed. Within a few days of practice without the patch, this initial impre-cision disappears due to a progressive decrease of the saccadic gain, which progressively returns to its original value (de-adaptation).
Two main experimental approaches have been used to investigate saccadic adaptation (SA). The first approach, employed in monkeys, consists of surgically lesioning the extraocular muscles (Optican and Robinson 1980; Scudder et al. 1998). The second approach, used in both humans and monkeys, consists of changing the target lo-cation during the initial saccadic displacement. This non-invasive procedure, designated the target-jump para-digm, was first introduced by McLaughlin (1967). It in-volves three steps. First, the subject looks at a fixation point. Second, a target is presented in the peripheral vi-sual field triggering a saccade. Third, during the saccadic response, the target location is slightly modified. Be-cause the perception of small target displacements is im-paired during fast eye movements (Matin 1982), the sub-ject is not aware of this jump. As a consequence, the ex-perimentally induced post-saccadic error is interpreted by the saccadic system as a deficit of the oculomotor command. Systematically repeating the same target dis-placement from trial to trial leads to a reduction of the post-saccadic error, by way of a gradual and adaptive change in saccade amplitude. This paradigm has allowed an extensive investigation of the properties of SA in hu-mans and animals. One of the main results obtained within the last decade is that SA is spatially selective, i.e., it only transfers to a restricted range of eye displace-ments centered around the adapted saccade. With respect to this point, it was shown that adaptation of saccades in one direction did not generalize to saccades performed in a perpendicular or opposite direction (Deubel et al. 1986; Frens and Van Opstal 1994). Furthermore, it was ob-served that, for a fixed saccade direction, adaptation of movements of a given amplitude did not parametrically generalize to movements of other amplitudes (Miller et al. 1981; Frens and Van Opstal 1994; Albano 1996; Straube et al. 1997). The only positive transfer was found for saccades of similar amplitude and direction, even when triggered from different orbital positions (Frens and Van Opstal 1994; Albano 1996; Wallman and Fuchs 1998).
Although oculomotor plasticity is well documented from a behavioral perspective, its neural substrate re-mains controversial. One of the obvious anatomical can-didates that may underlie SA is the superior colliculus (SC). This structure is known to be critically involved in the generation of goal-directed saccades (for reviews, see Sparks and May 1990; Guitton 1991). Its deep layers (DLSC) contain saccade-related burst neurons (SRBNs), which are thought to encode the saccadic movement in a
topographical motor map where the displacement is rep-resented in polar coordinates (amplitude and direction). In DLSC, the SRBNs have a well-defined „movement field“, which means that they respond maximally for a given movement vector and that their firing rate decreas-es progrdecreas-essively as the movement divergdecreas-es from the opti-mal vector. It was suggested that the actual saccadic dis-placement reflects the weighted output of the cell popu-lation recruited in the SC (Lee et al. 1988). This model fits well with the observation that SA only transfers to a range of displacements centered around the adapted sac-cade (Miller et al. 1981; Frens and Van Opstal 1994; Noto et al. 1999). Indeed, if oculomotor plasticity in-volves changes in the DLSC, the number of „adapted cells“ recruited is expected to decrease when the ment to be performed deviates from the adapted move-ment. A topographical organization similar to the one observed in the SC has been described in the frontal eye field (FEF; Bruce and Golberg 1985), suggesting that this cortical structure may also play a role in SA (Frens and Van Opstal 1994; Noto et al. 1999). Such a cortical contribution would be compatible with the observation that SA occurs quickly in humans, as compared with monkeys (see below).
The hypothesis that the SC represents the anatomical substrate for oculomotor plasticity was tested by record-ing unit activity of SRBNs in the DLSC or by electrical-ly stimulating DLSC, in monkeys, after a target-jump paradigm was performed to induce SA. It was shown that the amplitude of saccades evoked by electrical stim-ulation of DLSC was not affected after eye movements had been adapted behaviorally (Fitzgibbon et al. 1986; Melis and van Gisbergen 1996). In order to account for this observation, it was initially proposed that SA oc-curred either upstream from the SC by affecting the sig-nal entering this structure, or at the level of the SC itself by controlling the visual-to-motor transformation (Fitzgibbon et al. 1986). These interpretations were chal-lenged by the subsequent demonstration that collicular motor cells showed the same pattern of discharge after saccadic adaptation even when the adapted saccade no longer terminated in the original movement field (Goldberg et al. 1993; Frens and Van Opstal 1997). This result is compatible with the idea that a corrective com-mand is added to the collicular output signal downstream from the SC. The apparent contradiction between this conclusion and that initially derived from electrical stim-ulation studies (Fitzgibbon et al. 1986; Melis and van Gisbergen 1996) can be accounted for by assuming that the corrective command is added to the collicular output only under natural circumstances when the saccade is triggered by and directed toward a visual target. Addi-tional evidence that an adaptive corrective command is added to the collicular output signal came from the find-ing that saccades induced by electrical stimulation of the SC could be adaptively modified with a target-jump par-adigm (Melis and van Gisbergen 1996).
Obviously, a major anatomical candidate that may modulate the oculomotor command sent by the SC to the
saccadic burst generator is the cerebellum. This structure is known to play an essential role in the generation of goal-directed saccades (Noda 1991; Lewis and Zee 1993). In particular, the complex formed by the fastigial nuclei and the oculomotor vermis (lobules VI and VII, Noda and Fujikado 1987) is thought to be critically involved in the control of saccade metrics (Ohtsuka and Noda 1991b; Fuchs et al. 1993; Robinson et al. 1993; Goffart and Pélisson 1998). The hypothesis that SA depends on cere-bellar integrity has been supported by lesion studies indi-cating that patients suffering from syndromes associated with cerebellar dysfunction showed impaired SA capaci-ties (Waespe and Baumgartner 1992). In addition to this point, it was also shown, in monkeys, that adaptive capa-bilities were dramatically impaired when the oculomotor cerebellar vermis (OCV) and/or the fastigial nuclei were lesioned (Optican and Robinson 1980; Goldberg et al. 1993; Takagi et al. 1998; Barash et al. 1999).
Experimental results questioning the hypothesis that SA relies exclusively on the collicular-cerebellar loop have been recently reported by Melis and van Gisbergen (1996). These authors used a target-jump paradigm to adaptively modify the amplitude of ocular saccades trig-gered by electrical stimulation of the SC. After adapta-tion, they observed only a partial transfer of these electri-cally elicited saccades to visually elicited saccades. A possible explanation for this result is that the electrically stimulated and naturally generated saccades either do not recruit the same neuronal pools or fail to recruit them with the appropriate temporal organization (Goldberg et al. 1993; Melis and van Gisbergen 1996). An alternative hypothesis, based on the existence of direct projections from both the SC and the FEF to the brainstem saccadic generator, proposes that these two structures contribute to the motor command driving the saccadic-burst generator. This idea was developed by Melis and van Gisbergen (1996), who proposed „a scheme in which saccadic eye movements are generated by two parallel pathways, one via the FEF and another via the SC, whose crude mands are weighted to determine the motor error mand to the burst generator. This crude motor error com-mand can be adjusted by a corrective side loop via the cerebellum, which is activated by both FEF and SC crude commands“ (p 1758). According to this scheme, only a limited transfer of adaptation is expected from saccades involving exclusively one parallel pathway (e.g., sac-cades evoked from electrical stimulation of the SC) to saccades resulting from the simultaneous activation of the two parallel pathways (e.g., visually elicited saccades).
As shown by the previous observations, the anatomi-cal substrate of SA is still far from elucidated. The issue may appear even more opaque, considering that most of the neurophysiological data available in the literature were obtained in monkeys and that the behavioral char-acteristics of the adaptation produced by the target-jump paradigm are very different in humans and monkeys. In particular, substantial variations exist in how human and monkey SA transfers across paradigms. In humans, sac-cade amplitude modifications are generally
circum-scribed to the adapted movement and there is no transfer from reactive to volitional saccades (Erkelens and Hulleman 1993; Deubel 1995) or from eye movements to head movements (Kröller et al. 1996). In monkeys, by contrast, the adapted movement transfers significantly to both the head (Phillips et al. 1997) and a large variety of saccades (Fuchs et al. 1996). Another major difference between humans and monkeys concerns the time course of the adaptation. While substantial adaptation requires only a few tens of trials in humans (Deubel et al. 1986; Frens and Van Opstal 1994), several hundreds of sac-cades are necessary in monkeys (Fuchs et al. 1996; Straube et al. 1997; Scudder et al. 1998). These major behavioral disparities between humans and monkeys suggest that these two species „simply employ different mechanisms of adaptation to solve apparently identical problems of saccadic gain control“ (Fuchs et al. 1996, p 2534). In particular, the much quicker adaptation ob-served in humans may suggest a greater contribution of the cortical FEF complex (Frens and Van Opstal 1994). Another explanation might be, however, that SA is high-ly dependent on the experimental design. For instance, it has been suggested that the time-course differences ob-served between humans and monkey could be related to the fact that the number of targets used to produce SA is generally higher in monkeys. As shown by several stud-ies, SA is slower to develop when the number of targets increases (Miller et al. 1981; Scudder et al. 1998).
In an attempt to identify the anatomical substrate of SA in healthy humans, we recently carried out a H215O positron emission tomography (PET) study (Desmurget et al. 1998). Two conditions were contrasted in which the subjects were required to perform saccadic eye movements toward a visual target that was displaced during the course of the initial saccade. In the „random“ condition, the target jump varied systematically in direc-tion and magnitude from trial-to-trial, preventing SA from occurring. In the „adapt“ condition, by contrast, the target jump was consistent within the whole scan, induc-ing a progressive modification of the saccade magnitude. Difference images reflecting metabolic changes attribut-able to SA showed a selective activation in the posterior cerebellar vermis. In this initial study, however, no a pri-ori hypothesis was formulated about the possible areas that might be involved in SA. As a consequence, severe statistical constraints were applied to adjust for multiple comparisons, increasing the probability of false negative inference (i.e., of concluding that an activation was not significant when it was). The drastic correction applied to the raw data may explain our failure to identify signif-icant SA-related activations in the FEF or the SC. In ad-dition to this explanation, our inability to detect an acti-vation within the FEF or the SC may have been related to the choice of a random condition as a reference task for the calculation of difference images. It is possible that intra-saccadic target jumps elicit some single-trial corrective process, as reported for arm movements dur-ing prism adaptation (Rossetti et al. 1993; Redddur-ing and Wallace 1996). According to this hypothesis, both the
FEF and the SC may be involved in SA in such a way that they are activated after every trial for which an ab-normal postsaccadic error is observed. If this is the case, regional cerebral-blood-flow (rCBF) variations in these structures would have been artificially „erased“ in our initial study due to the comparison of a systematic-jump condition with a random-jump condition.
The main aim of the present paper is both to address the previous reservations and to test for the existence of a potential single-trial error control process. To achieve these goals, we proceeded in three successive steps. First, we re-analyzed our original data by focusing on the structures that have been reported in the literature as potential loci for SA, namely the FEF, the SC, and the OCV. This a priori prediction about the areas that may be activated during the process of SA allowed us to use more powerful statistical tests, significantly decreasing
the probability of false negative inferences. Second, we analyzed the metrics of the saccades performed under the „random“ condition in order to identify potential trial-to-trial changes in saccade amplitude. Third, we contrasted the „adapt“ and „random“ conditions with a third condi-tion in which the target locacondi-tion was maintained stacondi-tion- station-ary during the entire trial.
Materials and methods
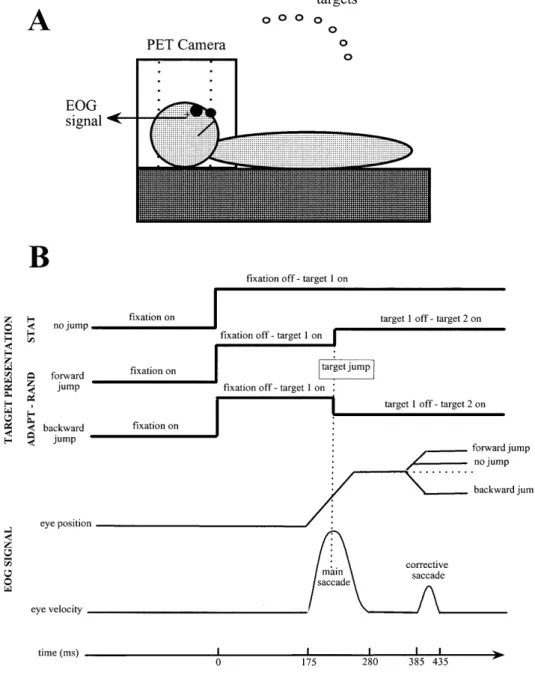
Subjects and apparatusNine right-handed naive subjects (seven males, two females), from 22 to 59 years of age (mean: 30 years; SD: 12), participated in the study after informed consent was obtained. During the experi-ment, they were supine with their head immobilized in the scan-ner. The experimental apparatus is schematized in Fig. 1A. It con-sisted of a line of red light-emitting diodes positioned on a
half-Fig. 1. Schematic
representa-tion of the experimental appa-ratus (A) and the experimental protocol (B). Time values ob-tained from a single trial are provided as an illustration of the actual timing of the oculo-motor sequence. PET Positron emission tomography,
circle (radius 55 cm). This circle was centered on the subjects’ cy-clopean eye (middle of the segment joining the two eyeballs) and adjusted to be in the same plane as the subjects’ line of sight. The diodes were located every 2.5° from –20° (left) to 32.5° (right). Eye position was recorded binocularly by a DC electro-oculo-graphic technique (EOG).
Experimental conditions
The protocol was approved by the institutional Human Investiga-tion Committee of Emory University. Three experimental condi-tions were considered and repeated four times. Each of these con-ditions involved the same four steps (Fig. 1B): (1) one of three possible fixation points (–20°, –10°, 0°) was turned on for 1.5 s; (2) the initial fixation point was turned off while the target was si-multaneously turned on; (3) depending on the experimental condi-tion, the target either remained stationary or was displaced during the ocular saccade (due to saccadic suppression, this displacement was not consciously detected by the subjects; Matin 1982); (4) the target was turned off while the next fixation point was turned on (the „target illumination phase“ lasted 1.8 s). This sequence was repeated 27 times for each scan (i.e., each scan consisted of a se-ries of 54 targets presented alternatively to the right and to the left). The three experimental conditions were as follows.
Adaptation (ADAPT)
The initial target appeared 25° to the right of the fixation point (i.e., the required initial saccadic displacement had a constant am-plitude of 25°). During the saccadic response, the target location was shifted unbeknownst to the subjects. The shift was consistent within the entire scan. Different intra-saccadic jumps were imple-mented for each replication of this condition: forward 5° (scan ADAPTF5; 20% of the amplitude of the first target step); forward 7.5° (scan ADAPTF7.5; 30% of the amplitude of the first target step); backward 5° (scan ADAPTB5); backward 7.5° (scan ADAPTB7.5).
Random (RAND)
This condition was identical to ADAPT, except that the target jump was not consistent from trial-to-trial. The stimulation pattern for each scan was defined by randomly mixing the four types of jumps used in the different replications of the ADAPT condition (forward 5°; forward 7.5°; backward 5°; backward 7.5°). When averaged over their different replications, the ADAPT and RAND conditions were balanced from the standpoint of eye kinematics (number, amplitude, and direction of saccades).
Stationary (STAT)
For this condition, the target remained stationary during the entire trial. It was presented to the right at 17.5° (scan STAT17.5), 20° (scan STAT20), 30° (scan STAT30), and 32.5° (scan STAT32.5) from the initial fixation point, which corresponded to the final locations reached in the different replications of the ADAPT condition. The target step was constant for a given scan. For each replication, the sequence of target presentation was identical to the one used in the corresponding ADAPT condition (final target). It should be stressed here that STAT and ADAPT were not strictly identical from a kinematic point of view. While the total displacement was strictly balanced in these two conditions, the relative contribution of the primary and corrective secondary saccades was different. In particular, the amplitude and, to a lesser extent, the rate of the cor-rective saccades was larger in ADAPT than in STAT (see Results). Each scan was performed in a totally dark room, preventing the subject from using any environmental landmarks. At the end of each scan the light was turned on, and the subject was encour-aged „to stay awake and to look around him“ in order to make
sure that any trace of adaptation would disappear before the begin-ning of the next scan. The inter-scan period was 10 min. The 12 different scans were randomly ordered across subjects.
Behavioral analysis
Eye movements were recorded binocularly using DC electro-oculography at a frequency of 1 kHz. During the experiment, eye velocity was extracted on-line from the position signal, using a two-point central-difference derivative algorithm (Bahill and McDonald 1983). The change in target location occurred, in RAND and ADAPT, when eye velocity reached a level equal to half of the peak velocity. The threshold for target jump was set manually on an oscilloscope at the beginning of the experiment while the subject was required to perform a series of 25° saccades. It was adjusted during the scans if necessary. The technique used for calibrating the EOG signal has been described earlier in detail (Pélisson et al. 1988). In brief, the signal was measured while the subject looked at a sequence of peripheral targets. A calibration curve was then computed by fitting a polynomial through the data. This curve was used to transform the EOG signal into a calibrated eye-position signal. The eye-position signal was numerically fil-tered at 30 Hz with a second-order Butterworth dual-pass filter. The beginning and the end of the initial saccade were automatical-ly detected using a velocity-threshold procedure (50°/s). The re-sults of this procedure were checked off-line and corrected, if nec-essary.
SA generally follows a logarithmic law (Deubel et al. 1986; Straube et al. 1997). In humans, the adaptation takes about 60–80 trials to reach a steady state (Deubel et al. 1986; Frens and Van Opstal 1994). In our experiment, however, the number of trials was limited to 27 per scan, indicating that this steady state was never reached. Since SA presents a roughly linear shape in its ini-tial phase, the time course of adaptation was assessed, for each ADAPT scan, by fitting a normal regression line between the magnitude of the rightward initial saccade and the corresponding trial number (the sum of the squared distance of the observed points to the regression line was minimized). The percentage of adaptation was computed from the slope (s) of the regression line and the magnitude of the intrasacadic jump (IJ) using the follow-ing formula [(s*27)/IJ]*100. In order to test the effect of the ex-perimental factors on the adaptation index (slope of the regression lines), an ANOVA with repeated measure was performed (n=9 subjects). The repeated-measure factors were the „jump direction“ (backward or forward) and the „jump amplitude“ (5° or 7.5°). A mean adaptation index was obtained, for each subject, by averag-ing the rectified adaptation regression slopes.
Specific analyses were performed for the RAND condition in order to address the possibility that random jumps of the target lo-cation generate trial-by-trial adaptive responses. If such were the case, the amplitude of a given saccade should depend on the na-ture on the previous trial. For instance, if the previous trial were a backward jump, the magnitude of the primary saccade should de-crease in comparison to the case where the previous trial was a forward jump. To test this hypothesis, the trials were segregated into two groups. One for which the previous jump was backward and one for which the previous jump was forward. The mean am-plitude of the primary saccade was computed for each group and each subject. Paired t statistics were then applied to test whether the primary saccadic response was significantly shorter in the backward than in the forward group.
Imaging
Imaging methods have been described in previous publications (Winstein et al. 1997; Desmurget et al. 1998). In brief, rCBF im-ages were acquired with a Siemens ECAT Exact scanner by using a modified autoradiographic method in 2D mode. Scans (90 s) were recorded every 10 min. The series of scans was made, from each subject, using bolus intravenous injections of H215O
Performance of the designated task began at the same time as scanning. Images were reconstructed by using calculated attenua-tion correcattenua-tion.
Image processing was performed on a SUN Sparc 5 station. For spatial normalization, a within-subject alignment of PET scans was performed by using an automated registration algorithm (Woods et al. 1998a). For each subject, the mean PET image was then co-registered to a population-based PET reference atlas cen-tered in Talairach coordinates (Talairach and Tournoux 1988), us-ing affine and non-linear transforms with 12 degrees of freedom (Woods et al. 1998a, 1998b). Co-registered PET images were smoothed to a final isotropic resolution of 15 mm and normalized to each other by using proportionate global scaling.
Image analysis
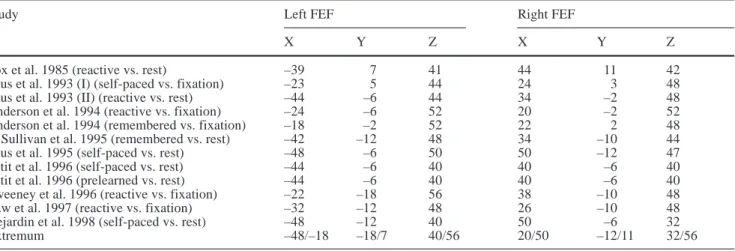
As emphasized in the introduction, the present experiment is bounded by explicit a priori hypotheses. Based on these hypothe-ses, five search regions were delimited, corresponding to the fol-lowing structures: the frontal eye field (FEF; bilaterally), the ocu-lomotor cerebellar vermis (OCV), and the superior colliculus (SC; bilaterally). In contrast to the OCV and the SC, which can be easi-ly identified with respect to structural anatomic landmarks, the FEF is not a distinct anatomical region in humans. It is most prob-ably situated around the lateral segment of the precentral sulcus, involving both the posterior extremity of the middle frontal gyrus and the anterior part of the precentral gyrus. In order to define the location of the FEF in a more predictive way, a review of PET studies involving comparison of various oculomotor tasks with a rest or a fixation condition was performed. The search volume was then defined, in Talairach coordinates (Talairach and Tournoux 1988), as the area bounded by the extreme activation loci reported in the literature. As reported in Table 1, this procedure resulted in a quite large area, including the precentral gyrus, the precentral sulcus, and its adjacent inferior and middle frontal gyri. All the ar-eas lying outside the search volume (OCV, SC, FEF) were disre-garded in the present study.
Linear-contrast analyses based on the general linear model of ANOVA were used to produce t-statistic images between behav-ioral conditions on a voxel by voxel basis (Neter et al. 1990; Woods et al. 1996). The experimental factors were task, subject, and repetition. In order to privilege sensitivity, we chose a rather lax uncorrected P value (Praw=0.01). The t-images resulting from the contrast analyses were corrected for multiple comparisons to a final resolution of P<0.05, using the method developed by Friston, which takes into account the number of resolution elements con-stituting the search volume, the size of the activation, and the de-gree of image smoothness (Friston et al. 1994). Five main con-trasts were tested, as follows.
ADAPT–RAND
This contrast was computed in order to identify the potential con-tribution of the OCV, the FEF, and the SC to the process of SA. It allowed control for movement kinematics, but may have erased the contribution of some areas showing single-trial corrective ef-fects.
Forward ADAPT–STAT
For this contrast, the ADAPT scans involving a forward intrasac-cadic jump (ADAPTF5, ADAPTF7.5) were compared with the cor-responding STAT scans (STAT30, STAT32.5). Although a general contrast involving all the repetitions of the ADAPT and STAT scans was also performed (see below), this forward comparison was carried out considering that both the ADAPTFand STAT trials generate a forward corrective saccade, whereas the ADAPTB scans generate a backward corrective saccade. Comparing trials involving backward and forward corrective saccades may have been misleading, considering that the saccadic system is laterali-zed for the SC (Sparks 1986; Sparks and May 1990) and the FEF (Rivaud et al. 1994; Sommer and Tehovnik 1997).
Kinematic contrast
As emphasized above, the ADAPT and STAT conditions present kinematic disparities. It is therefore important to determine wheth-er these disparities could explain the pattwheth-ern of activation obswheth-erved in the forward ADAPT–STAT contrast. To address this issue, a contrast analysis was performed between the large (32.5°) and small (30°) saccadic displacements [(ADAPTF7.5+STAT32.5)– (ADAPTF5+STAT30)]. It is worth mentioning that the two terms of the contrast (large versus small) vary with respect to the amplitude of the saccadic displacement and the rate of corrective saccades generated (see Results). In view of behavioral data showing that the mean adaptation index is similar in ADAPTF5and ADAPTF7.5 (see Results), one may expect the adaptation effect to be erased in the present comparison. If the areas activated in the kinematic contrast were the same as the ones activated in the forward ADAPT–STAT contrast, it would not be possible to determine whether the rCBF increase was related to SA and/or to kinematic factors. However, an absence of activation detected by the kine-matic contrast, or an absence of overlap between the areas activat-ed in the kinematic and adaptation contrasts, would support the hypothesis that the sites activated in the forward ADAPT–STAT difference are not related to kinematic disparities.
Table 1 Activation loci observed in earlier positron-emission-tomography studies in the two frontal eye fields (FEF) (adapted and ex-tended from Paus 1996).
Study Left FEF Right FEF
X Y Z X Y Z
Fox et al. 1985 (reactive vs. rest) –39 7 41 44 11 42
Paus et al. 1993 (I) (self-paced vs. fixation) –23 5 44 24 3 48
Paus et al. 1993 (II) (reactive vs. rest) –44 –6 44 34 –2 48
Anderson et al. 1994 (reactive vs. fixation) –24 –6 52 20 –2 52
Anderson et al. 1994 (remembered vs. fixation) –18 –2 52 22 2 48
O’Sullivan et al. 1995 (remembered vs. rest) –42 –12 48 34 –10 44
Paus et al. 1995 (self-paced vs. rest) –48 –6 50 50 –12 47
Petit et al. 1996 (self-paced vs. rest) –44 –6 40 40 –6 40
Petit et al. 1996 (prelearned vs. rest) –44 –6 40 40 –6 40
Sweeney et al. 1996 (reactive vs. fixation) –22 –18 56 38 –10 48
Law et al. 1997 (reactive vs. fixation) –32 –12 48 26 –10 48
Dejardin et al. 1998 (self-paced vs. rest) –48 –12 40 50 –6 32
ADAPT–STAT, RAND–STAT
In this case, all repetitions were pooled together, for each condi-tion. Because leftward corrective saccades occurred in the ADAPT and RAND conditions, but not in the STAT condition, it is not very informative to test the ADAPT–STAT and RAND– STAT contrasts independently. However, mirroring them could provide worthwhile information. Indeed, the RAND and ADAPT conditions are equivalent from a kinematic point of view. As a consequence, the existence of divergent pattern of activation in the ADAPT–STAT and RAND–STAT contrasts could identify the ex-istence of different functional subsystems in the ADAPT and RAND conditions. Also, a selective activation of a given brain ar-ea in one of these two contrasts would strongly suggest that this area was not responding to kinematic disparities.
In the present paper, it was important to rule out the possibility that non-significant activations in the FEF, the SC, or the OCV re-present false negative inferences (or type-II errors). To this end, trend analyses were performed for both the ADAPT–RAND and the forward ADAPT–STAT comparisons. The question behind these analyses can be summarized as follows: what is the likeli-hood that non-significant activations represent false negative in-ferences? To address this issue, we first determined the voxel for which rCBF variations had the highest probability of being signifi-cant within the area considered (e.g., FEF). To identify this voxel, the P value was raised gradually from the raw threshold (P=0.01) up to a maximum of 0.20. In a second step, the amplitude of rCBF increase was computed for the identified voxel by substracting the mean blood flow averaged from the RAND or STAT conditions from the mean blood flow averaged from the ADAPT condition (i.e., ADAPT minus RAND, or ADAPT minus STAT at the point of maximal significance). In a third step, the obtained values of rCBF variations (one per subject) were correlated with the behav-ioral markers. If rCBF increases were exclusively or mainly relat-ed to SA, one would expect a positive correlation basrelat-ed on the premise that the normalized increase in rCBF should be larger when the degree of adaptation is higher. In a last step, the right and left variations in rCBF were compared for both the FEF and SC, considering that the contribution of these two structures to saccade generation is lateralized (SC: Sparks 1986; Sparks and May 1990. FEF: Rivaud et al. 1994; Sommer and Tehovnik 1997).
Results
Behavioral observations: saccade characteristics
For the STAT condition, the saccadic response consisted of two phases (Fig. 2), as was expected from previous experimental observations (Becker and Fuchs 1969; Prablanc and Jeannerod 1975; Harris 1995): an initial saccade undershooting the target position and a single corrective saccade achieving accurate target acquisition. On average, the initial saccade covered 92% of the re-quired displacement.
For the RAND condition, the primary saccade repre-sented, on average, 91% of the initial target jump. This percentage was similar to the one observed in the STAT condition (paired-t=0.38, P>0.70). The mean amplitude of the first saccade was equal to 23°, indicating that the corrective saccade had a mean angular excursion of ei-ther –3° (backward 5°), -5.5° (backward 7.5°), 7° (for-ward 5°) or 9.5° (for(for-ward 7.5°). In a majority of trials, we detected only one corrective saccade (Fig. 2). This indicates that the RAND and STAT conditions differed mainly by the respective contributions of the primary
and secondary saccades. However, multiple corrective saccades were more frequent in the RAND than in the STAT condition (especially for the large forward target jumps), indicating that these two conditions also differed by the number of saccades generated.
As in the RAND trials, we detected only two saccades in a majority of ADAPT trials (Fig. 2), namely, a main initial saccade and a corrective saccade bringing the gaze on the target. In contrast to RAND, ADAPT generated a progressive change in the amplitude of the primary sac-cade across the session (Fig. 3). The mean slope of the
Fig. 2 Eye-position signals for individual saccades performed by
one subject in the different experimental conditions (STAT: solid
lines; ADAPT: dashed lines; RAND: dotted lines; see Methods
section for description of conditions). For the sake of clarity, trac-es were synchronized with rtrac-espect to movement onset. They are presented for each of the three starting points. The upper panel displays trials for which the final saccadic displacement had a magnitude of 17.5° (STAT17.5, ADAPTB7.5, RANDtrialsinvolving a 7.5° backward jump). The lower panel displays trials for which the final saccadic displacement had a magnitude of 32.5° (STAT32.5, ADAPTF7.5, RAND trials involving a 7.5° forward jump). For both panels, the initially required displacement (first target) in RAND and ADAPT had a constant magnitude of 25°. For the upper panel, the trials selected for ADAPT were recorded early in the session. In this case, no difference was observed be-tween the magnitude of the primary saccade for ADAPT and RAND. For the lower panel, trials selected for ADAPT were re-corded late in the session. In this case, the magnitude of the prima-ry saccade was slightly larger in ADAPT than in RAND due to saccadic adaptation. As shown in the figure, a single corrective saccade was observed in all conditions. Due to the target jump, however, the correction was larger in RAND and ADAPT than in STAT
normal regression lines was significantly higher than ze-ro for the two forward jump conditions (paired t-tests, P<0.01; n=9) and significantly lower than zero for the two backward jumps conditions (paired t-tests, P<0.02; n=9). As shown by a two-way ANOVA with repeated measures, the adaptation index did not depend on either the amplitude (20% jumps: 0.09, 30% jumps: 0.08; P>0.75) or the direction (forward jumps: 0.10, backward jumps: 0.07; P>0.10) of the intrasaccadic jump. On aver-age, the change in saccadic gain, computed from the re-gression slopes, represented 39% of the target jump.
Behavioral observations: trial-by-trial modification of saccade amplitude
In the RAND condition, backward and forward jumps were mixed within the session, generating systematic variations in the post-saccadic error. These variations prevented the oculomotor system from restoring the sac-cade accuracy over time. Despite this lack of long-term modification of the saccade metrics, a corrective process was present in the RAND condition. The amplitude of
the primary saccade was higher, in eight of the nine sub-jects, when the previous trial involved a forward jump than when the previous trial involved a backward jump. Statistical analyses showed that the mean difference in saccade magnitude was significant (23.2° versus 22.6°; P<0.01). It is worth noting here that the RAND condi-tion may lead to an overestimacondi-tion of the single-trial ef-fect by a factor of 2. Indeed, when the target jump is ran-dom in direction, the saccade lengthening consecutive to a forward jump combines with the saccade shortening consecutive to a backward jump. A more appropriate es-timation of the single-trial effect may, thus, be half of the global effect observed in RAND, i.e., ±0.3°. Of interest is the fact that extrapolating this trial-to-trial change of saccadic amplitude to systematic target jumps predicts that the same level of adaptation as in ADAPT should be reached in only about 10 trials (10×0.3°=3°). This sug-gests that the single-trial error-correction mechanism may be a non-additive process, functionally distinct from SA, which acts over a longer time scale. We shall return to this issue in the discussion.
To further address the issue of whether trial-by-trial modification of saccade amplitude and SA could be sub-served by common neural processes, the correlation co-efficient was computed, across subjects (n=9), between the mean adaptation index (ADAPT) and the value of the trial-by-trial change in saccade amplitude (RAND). The result failed to reveal any significant relation between these two measures (r=0.29; P>0.40), contrary to what
Fig. 3 Illustration of the variations of the saccade magnitude as a
function of the trial number for one subject and the four replica-tions of the ADAPT condition (see Methods section for descrip-tion of condidescrip-tion). Normal regression lines between saccade mag-nitude and trial number are shown in each panel (solid lines)
would have been expected if they had a common func-tional origin. In other words, the subjects who were the „best adaptors“ were not the ones who displayed the greatest trial-by-trial effect. It is worth noting that this observation does not rule out the possibility that some areas involved in SA may show trial-to-trial effects or, conversely, that some activations observed in SA are due to the trial-by-trial error correction process.
Because the value of 0.6° is close to the nominal ac-curacy of the EOG technique (Pélisson et al. 1988), it is worth mentioning that the existence of a trial-by-trial corrective process has been confirmed in a recent behav-ioral study using an ISCAN video-recording system (nominal resolution <0.10°; manuscript in preparation). In this study, seven subjects were requested to perform visually directed saccades having a constant magnitude of 25°. Every eight trials, the target jumped backward during the saccade. In the seven remaining trials, it re-mained stationary. Results indicated that the saccades performed just after the „jump“ trials had a significantly shorter amplitude than the saccades performed just be-fore the „jump“ trials, for all subjects. The mean magni-tude of the difference was around 0.2°. In a separate ses-sion, SA was induced by jumping the target backward systematically during the saccade. As in the present study, we did not observe any correlation between the
rate of adaptation and the amplitude of the trial-by-trial effect (r=0.25; P>0.55).
PET observations: ADAPT–RAND
For the sake of clarity, the main results related to PET observations have been summarized in Table 2. The OCV was the only oculomotor area presenting a signifi-cant rCBF increase when ADAPT was compared with RAND (corrected t-images; Fig. 4). The exact cerebellar site of activation was located caudally with respect to the primary fissure (stereotaxic coordinates for the voxel of highest significance: 4, –69, –19). It encompassed the cerebellar lobules VI and VII bilaterally. The metabolic increase was more marked on the right side, i.e., on the side ipsilateral to the direction of the adapted saccadic displacement. The mean rCBF increase observed in ADAPT with respect to RAND was equal to 2.3%. The vermal activation was very robust and not related to the rather lax, uncorrected P value adopted in the present ex-periment. A significant metabolic increase was still ob-served on the corrected t-images when Prawwas lowered to 0.0001. Further evidence suggesting that this increase was really related to SA was provided by the demonstra-tion that the subjects who were the „best adaptors“ were
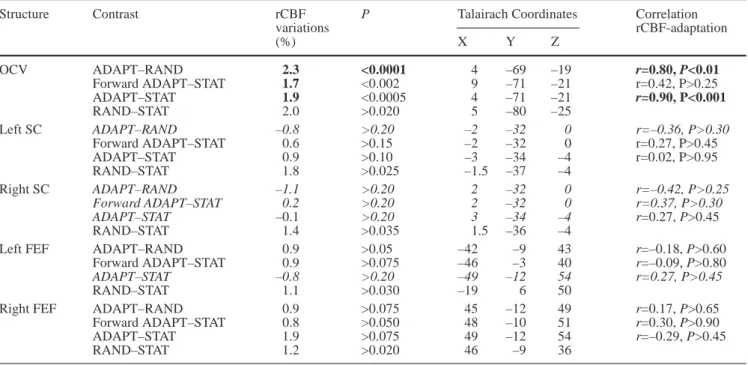
Table 2 Summary of the positron-emission-tomography observa-tions for the different contrasts. Significant correlation coefficients and increases in regional cerebral blood flow (rCBF) that were still significant after adjustments for multiple comparisons are re-ported in bold characters. Talairach coordinates and increases in rCBF were computed from the voxel of maximal significance. For the structures that did not reveal any significant activation at the highest threshold considered in this study (P=0.20; see Methods section), the increase in rCBF was determined using the Talairach coordinates obtained in the closest related contrast. These struc-tures appear in italics in the table [for the left superior-colliculus
(SC) ADAPT–RAND contrast, coordinates were inferred from the forward ADAPT–STAT contrast; for the right SC ADAPT–RAND and forward ADAPT–STAT contrasts, coordinates were deter-mined by symmetry from the left SC forward ADAPT–STAT con-trast; for the right SC ADAPT–STAT contrast, coordinates were determined by symmetry from the left SC ADAPT–STAT con-trast; for the left frontal eye fields (FEF) ADAPT–STAT contrast, coordinates were determined by symmetry from the right FEF ADAPT–STAT contrast; see Methods section for description of conditions]. OCV Oculomotor cerebellar vermis
Structure Contrast rCBF P Talairach Coordinates Correlation
variations rCBF-adaptation (%) X Y Z OCV ADAPT–RAND 2.3 <0.0001 4 –69 –19 r=0.80, P<0.01 Forward ADAPT–STAT 1.7 <0.002 9 –71 –21 r=0.42, P>0.25 ADAPT–STAT 1.9 <0.0005 4 –71 –21 r=0.90, P<0.001 RAND–STAT 2.0 >0.020 5 –80 –25 Left SC ADAPT–RAND –0.8 >0.20 –2 –32 0 r=–0.36, P>0.30 Forward ADAPT–STAT 0.6 >0.15 –2 –32 0 r=0.27, P>0.45 ADAPT–STAT 0.9 >0.10 –3 –34 –4 r=0.02, P>0.95 RAND–STAT 1.8 >0.025 –1.5 –37 –4 Right SC ADAPT–RAND –1.1 >0.20 2 –32 0 r=–0.42, P>0.25 Forward ADAPT–STAT 0.2 >0.20 2 –32 0 r=0.37, P>0.30 ADAPT–STAT –0.1 >0.20 3 –34 –4 r=0.27, P>0.45 RAND–STAT 1.4 >0.035 1.5 –36 –4
Left FEF ADAPT–RAND 0.9 >0.05 –42 –9 43 r=–0.18, P>0.60
Forward ADAPT–STAT 0.9 >0.075 –46 –3 40 r=–0.09, P>0.80
ADAPT–STAT –0.8 >0.20 –49 –12 54 r=0.27, P>0.45
RAND–STAT 1.1 >0.030 –19 6 50
Right FEF ADAPT–RAND 0.9 >0.075 45 –12 49 r=0.17, P>0.65
Forward ADAPT–STAT 0.8 >0.050 48 –10 51 r=0.30, P>0.90
ADAPT–STAT 1.9 >0.075 49 –12 54 r=–0.29, P>0.45
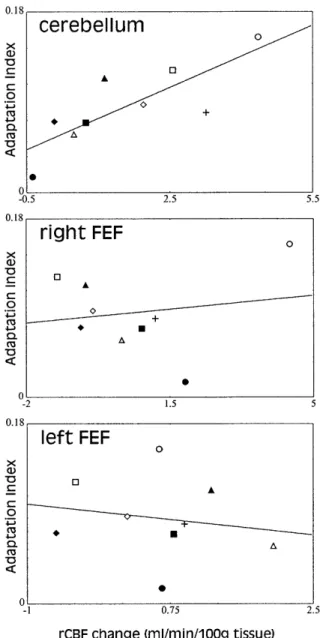
also the ones who displayed the highest rCBF increase. Indeed, a significant correlation was observed between the mean adaptation index and the rCBF increase in the OCV (r=0.80; P<0.01; Fig. 5).
No significant activation was observed within the FEF areas at the canonical threshold (corrected or uncor-rected t images). To address the possibility that this re-sult was a false-negative inference, the voxels presenting the most significant changes in rCBF were determined in both FEF by progressively increasing the P value (left FEF: –42, –9, 43; right FEF: 45, –12, 49). For the identi-fied regions, the metabolic activation presented four par-ticularities. First, the statistical probability was higher than P=0.05. Second, the rCBF increase was lower than 0.9% (left 0.89%, right 0.87%). Third, no correlation was observed between the rCBF variations in the FEF and the mean adaptation index (left: r=–0.18, P>0.60; right: r=0.17, P>0.65). This point is illustrated in Fig. 5, which shows that a strong adaptive response can be asso-ciated with either a decrease (e.g., Fig. 5, subject ■■ pre-senting the second highest adaptive effect) or an increase (e.g., Fig. 5, subject ●● presenting the highest adaptive effect) in rCBF in the FEF areas. Fourth, metabolic changes in the right and left FEF were found to be statis-tically equivalent (paired t=0.06; P>0.95). This is not consistent with the lateralized contribution of the FEF in the control of saccadic eye movements. Indeed, it has been shown that the FEF controls the amplitude of
sac-cadic displacements performed in the contralateral direc-tion (Bruce and Goldberg 1985; Bruce et al. 1985; Schall 1991; Rivaud et al. 1994; Sommer and Tehovnik 1997). Because only the amplitude of rightward saccades was modified in the present study, one may have predicted that potential rCBF changes related to SA should have occurred in the left FEF, but not in the right FEF. When considered together, all four previous observations do not substantiate the idea that the metabolic variations ob-served in the FEF were relevant in terms of SA.
Fig. 4 Implication of oculomotor cerebellar vermis (OCV) in the
process of saccadic adaptation. The figure displays the horizontal (left column), sagittal (middle column), and coronal (right column) mean difference images obtained after correction for multiple comparisons in the ADAPT–RAND, forward ADAPT–STAT, and global ADAPT–STAT contrasts (n=9 subjects; see Methods sec-tion for descripsec-tion of condisec-tions). Images are centered on the point of maximal significance observed in the ADAPT–RAND contrast. The right side is shown on the left of horizontal and coro-nal images
Fig. 5 Illustration of the inter-individual relationship linking the
mean adaptation index and the corresponding regional cerebral-blood-flow (rCBF) change attributable to the adaptation effect („ADAPT“ minus „RAND“). A correlation between these two pa-rameters was found for the cerebellum (r=0.80; P<0.01), indicat-ing that the subjects who were the best „adaptors“ also displayed the largest increases in rCBF. No correlation was observed for ei-ther frontal eye field (FEF) (left FEF: r=–0.18; right FEF: r=0.17;
P>0.60). The continuous lines shown in the figure represents the
normal regression lines. For the sake of clarity, each subject is rep-resented with specific symbols on the figure
Finally, we did not detect any significant activation in the right or left SC, even when the P value was raised to 0.20. With respect to this point, it may be worth men-tioning that a slight decrease in rCBF was in fact ob-served in both the left and right SC when ADAPT was compared with RAND (Table 2).
PET observations: forward ADAPT–STAT
The OCV was the only area which presented a signifi-cant rCBF increase when ADAPT was compared with STAT (9, –71, –21; corrected t-images, Fig. 4). This re-sult was not related to the relatively high raw P value adopted in the present experiment. Indeed, a significant activation increase was still observed, for the OCV, on the corrected t-images when Prawwas lowered to 0.002. The mean rCBF increase observed in ADAPT with re-spect to STAT was equal to 1.7%.
Two arguments suggest that the cerebellar activation observed in the forward ADAPT–STAT contrast was not associated with kinematic factors, but instead with the process of SA. First, the site of activation overlapped consistently with the one observed in the ADAPT– RAND contrast, where kinematic differences were con-trolled. Second, cerebellar activity was not responsive to small variations in saccade characteristics. Indeed, nei-ther the kinematic contrast nor the RAND–STAT con-trast (see below) showed a significant rCBF increase in the vermal area. Note that, although positive, the correla-tion coefficient between the rCBF increase and the de-gree of adaptation did not reach the statistical threshold (r=0.42, P>0.25).
As in ADAPT–RAND, no significant activation was observed within the FEF areas at the canonical threshold (corrected or uncorrected t images). To address the pos-sibility that this result was a false-negative inference, the voxels presenting the most significant changes in rCBF were determined in both FEF by progressively increas-ing the P value (left FEF: –46, -3, 40; right FEF: 48, –10, 51). For both FEF, the rCBF increase was less than 0.9% (left 0.89%, right 0.75%). The probability of the increase being significant was higher than P=0.05 in both FEF. In addition, the changes in rCBF were clearly not correlated with behavioral observations. No relation was observed between the rCBF variations in the FEF and the mean adaptation index (left: r=–0.09, P>0.80; right: r=0.3, P>0.90). As shown by further analyses, the rCBF increase was not significantly different in the two FEF (paired t=0.32, P>0.75), contrary to what would have been expected if metabolic changes were really re-lated to SA (see previous section). These observations do not support the interpretation that the metabolic varia-tions observed in the FEF were relevant in terms of SA.
A slight increase in rCBF was observed in the left SC (–2, -32, 0) when ADAPT was compared with STAT (0.64%). The probability of this increase being signifi-cant was quite low (P>0.15). No correlation was ob-served between rCBF variations in the left SC and the
mean adaptation index (r=0.27; P>0.45). The rCBF vari-ations observed in the right SC did not reach the signifi-cance level, even for the highest statistical threshold con-sidered in this study (P=0.20). This result is not surpris-ing, considering that the rCBF increase observed in the right SC was quite small (0.15% at location 2, –32, 0). As for the FEF, variations in rCBF observed within the left and right SC were not statistically different (paired t=1.2, P>0.25), as would have been expected if some metabolic changes in the left SC were related to SA. In-deed, as with the FEF, the SC is involved in the genera-tion of saccadic displacements performed in the contra-lateral direction (Sparks 1986; Sparks and May 1990).
PET observations: ADAPT–STAT, RAND–STAT
The ADAPT–STAT contrast revealed a large activation in the OCV (Fig. 4). The activation site (4, –71, –21) was close to the one observed in the ADAPT–RAND and the forward ADAPT–STAT contrasts. The mean rCBF increase observed in ADAPT with respect to STAT was equal to 1.9%. As in the ADAPT–RAND condition, a significant correlation was observed between the mean adaptation index and the rCBF increase in the OCV (r=0.90; P<0.001). No significant vermal activation was observed in the RAND–STAT comparison (mean rCBF decreased by a marginal amount in RAND with respect to STAT at location 4, –71, –21; 0.04%), suggesting that the significant activation observed in the ADAPT–STAT contrast was not related to kinematic factors.
No activation was observed in the FEF and the SC for the ADAPT–STAT contrast (corrected or uncorrected t-images). This result is congruent with our previous ob-servations showing an absence of activation within these areas for the ADAPT–RAND and forward ADAPT– STAT contrasts.
As in the ADAPT–STAT contrast, the RAND–STAT contrast failed to reveal any significant activation within the FEF or the SC (corrected or uncorrected t-images). We shall return on this point in the discussion.
Discussion
The main aim of the present paper was to address the functional anatomy of SA in humans. Based on a review of the literature, we focused on the three principal struc-tures that have been suggested as potential loci for SA, namely the FEF, the SC, and the OCV. Our results indi-cate a clear involvement of the latter area. We found no evidence to suggest that the FEF and the SC are also re-cruited during SA. Besides these main findings, we also showed that saccade metrics were controlled on a trial-by-trial basis in the RAND condition. We propose desig-nating this process single-trial error correction (STEC). Our data suggest that STEC does not rely on the cerebel-lum and is functionally different from the process of SA. From the present study, however, it remains unclear how
STEC and SA interact with each other. Also, it is not es-tablished whether the observed trial-by-trial modulation of saccade amplitude represents a general process or a specific response to the (unusual) RAND condition.
Oculomotor cerebellum mediates SA in humans
Numerous experiments involving single-unit recordings (Kase et al. 1980; Ohtsuka and Noda 1995), brain lesions (Optican and Robinson 1980; Robinson et al. 1993; Goffart and Pélisson 1998; Takagi et al. 1998; Barash et al. 1999), electrical stimulation (Ron and Robinson 1973; Keller et al. 1983; Fujikado and Noda 1987; Noda and Fujikado 1987), or imaging (Petit et al. 1993; Sweeney et al. 1996; Dejardin et al. 1998) have indicated that the OCV is critically involved in the control of sac-cadic eye movements. Human studies implicating mag-netic stimulation of the vermis in normal subjects (Hashimoto and Ohtsuka 1995) or patients with various degrees of cerebellar disorders have suggested that this region may be particularly important in the control of saccade metrics. With respect to the latter point, it was shown that large lesions of the medioposterior cerebel-lum did not prevent subjects from performing saccades, but did result in marked saccadic dysmetria (Zee et al. 1976; Lewis and Zee 1993).
Systematic microstimulation studies in monkeys have demonstrated that the portion of the cerebellar cortex in-volved in saccade control is located in lobules VI and VII (Fujikado and Noda 1987; Noda and Fujikado 1987). When these lobules are lesioned (Sato and Noda 1992; Takagi et al. 1998; Barash et al. 1999) or microstimulat-ed during saccadic displacement (Ohtsuka and Noda 1991a), monkeys consistently make dysmetric saccades. Apparently, the oculomotor vermis can exert a rather di-rect control on the brainstem saccadic generator. Micro-stimulation delivered in the OCV elicits ipsilateral sac-cades with latencies of 15 ms (Fujikado and Noda 1987). This influence seems to be routed through the fastigial complex. As shown by Noda and colleagues, the Purkinje cells of the OCV send an inhibitory projection to a re-stricted area in the caudal part of the fastigial nucleus (Yamada and Noda 1987; Ohtsuka and Noda 1991a, 1991b). This fastigial oculomotor region (FOR), which in turn projects to the thalamus (Asanuma et al. 1983), to the SC (May et al. 1990), and to specific oculomotor re-gions in the brainstem (Noda et al. 1990), seems to carry information for controlling the amplitude of the saccade. Because bilateral inactivation or lesioning of the FOR results in extreme saccadic hypermetria (Optican and Robinson 1980; Robinson et al. 1993; Straube et al. 1995), it is generally thought that this region modulates an oversized oculomotor command issued by the brain-stem saccadic generator by influencing premotor neurons of the reticular formation and/or saccadic neurons of the SC (Optican and Robinson 1980; Robinson et al. 1993; Ohtsuka and Noda 1991b; Dean et al. 1994; Schweig-hofer et al. 1996; Goffart and Pélisson 1998; Lefèvre et
al. 1998; Guillaume and Pélisson 1999). According to this view, FOR sends a corrective signal that is added to the brainstem command in order to ensure a proper match between the characteristics of the motor output and the amplitude of the required displacement.
In summary, the previous observations indicate that the nervous system can modulate the amplitude of the ocular saccade by tuning the inhibitory action exerted by the vermal Purkinje cells on the fastigial nuclei. Our ob-servations suggest that one of the functions subserved by this modulation, in humans, is to maintain proper cali-bration between the sensory and motor components of the saccadic system (in other words, to achieve SA). In support of this hypothesis, we showed that PET differ-ence images, reflecting metabolic changes attributable to the process of SA, involved a large activation within the OCV. To avoid ambiguity, it may be worth emphasizing at this point that the rCBF effects of backward and for-ward jumps do not cancel each other. If such had been the case, i.e., if backward adaptation induced a decrease in rCBF within the OCV while forward adaptation in-duced an increase, no significant activation should have been observed for the ADAPT–RAND and global ADAPT–STAT contrasts (the ADAPT condition in-volved adaptation to backward and forward jumps). The vermal activation observed for the ADAPT–RAND and global ADAPT–STAT contrasts shows that the metabolic activation in the OCV is reflective, not of the level of in-hibition itself, but of the adaptive process modulating the inhibition level exerted by the Purkinje cells. The present results are consistent with previous reports showing an impairment of SA capacities in human patients suffering from syndromes associated with cerebellar dysfunctions (Waespe and Baumgartner 1992). Also, they are in agreement with studies in monkeys showing that lesions of the OCV (Takagi et al. 1998; Barash et al. 1999) and/or the cerebellar fastigial nuclei (Optican and Robin-son 1980; Goldberg et al. 1993) prevented SA from oc-curring.
Metabolic activity does not change significantly in the FEF during SA
PET difference images, reflecting rCBF changes attribut-able to the process of SA, did not reveal significant met-abolic changes within the FEF. Further analyses were performed to determine whether this conclusion repre-sented a false-negative inference. These analyses indicat-ed that rCBF variations within either FEF were not relat-ed to the process of behavioral adaptation. They also showed that the magnitude of rCBF increases remained small in both FEF. This latter finding contrasts with the observation that the FEF are readily recruited during oc-ulomotor tasks (previous PET studies involving various oculomotor tasks have invariably shown a fairly robust saccade-related activation within the FEF areas; Table 1; Pierrot-Desiligny et al. 1995; Paus 1996). Finally, our data indicated that rCBF changes did not differ in the
right and left FEF, contrary to what would have been predicted if these areas were crucially involved in the process of SA. Indeed, the FEF has been shown to con-trol contralaterally directed saccades (Bruce and Goldberg 1985; Bruce et al. 1985; Schall 1991; Rivaud et al. 1994; Sommer and Tehovnik 1997). As a conse-quence, because only the amplitudes of rightward sac-cades were modified in the present study, one would have predicted that any SA-related changes in rCBF, for the FEF, would have engaged the left hemisphere exclu-sively and not the right one.
Neither the RAND–STAT contrast nor the ADAPT– STAT contrast revealed a significant rCBF increase within the FEF. This is puzzling, especially for the right FEF, be-cause the number of leftward corrective saccades was much larger in the RAND and ADAPT conditions (50%) than it was in the STAT condition (0%). The absence of activation within the right FEF might be related to the in-ability of the PET technique to detect blood-flow varia-tions associated with small saccadic responses (as report-ed in the Results section, leftward corrective saccades had an average amplitude of around 5° in the present study). Even if we cannot unequivocally reject this possibility, we think that it is quite unlikely. Indeed, as already men-tioned, saccade-related activations are known to be fairly robust in the FEF, even for small displacements. For in-stance, Paus et al. (1993) detected significant activations within both FEF during oculomotor tasks involving sac-cadic displacements of 5°. An alternative explanation for the absence of FEF activation in the ADAPT–STAT and RAND–STAT contrasts may be that the execution of cor-rective saccades does not significantly engage the FEF. This hypothesis is in accord with behavioral studies show-ing that corrective saccades occur at consistently shorter latencies than the primary saccades (Becker and Fuchs 1969; Prablanc and Jeannerod 1975), suggesting that they may rely more on subcortical structures. Also, it relates to a recent observation in a patient exhibiting a localized ischemic lesion in the left FEF (Rivaud et al. 1994). When this patient was required to perform memory-guided sac-cades, reflexive saccades (gap paradigm), or predictive saccades to the right, a significant hypometria was sys-tematically observed. Interestingly, in a double-step para-digm, this hypometria was present for the primary sac-cade, but not for the secondary saccade. Rivaud et al. ar-gued that the amplitude of the memory-guided saccades, the reflexive saccades, the predictive saccades, and the primary saccades in the double-step paradigm was defined in retinotopic coordinates. By contrast, they claimed that the computation of the amplitude of the secondary saccade in the double-step task was based on both retinal and ex-tra-retinal signals. Following these premises, one may hy-pothesize that the FEF is mainly involved in the tion of primary retinotopic saccades, but not in the genera-tion of secondary corrective saccades (see also, for a dis-cussion, Pierrot-Deseilligny et al. 1995). This could ex-plain why no FEF activation was observed in the present study, where kinematic differences depended mostly on secondary corrective saccades.
Recent psychophysical experiments have shown, in humans, that SA does not transfer from reactive to self-generated saccades (Erkelens and Hulleman 1993; Deubel 1995). As underlined by Deubel (1995, p 3538) „it may be tempting to speculate that the neural substrate of the reflexive system might be the rather direct retino-collicular pathways (...), while the substrate for the in-tentionally controlled saccades may include the frontal eye fields“. In agreement with this view, Straube et al. (1995) provided evidence that cerebellar lesions may af-fect reactive saccades, but not self-generated saccades. As shown by these authors, a patient presenting with bi-lateral ablation of the fastigial nuclei exhibited large def-icits when required to perform reactive saccades to jumping targets. In conformity with monkey studies (Optican and Robinson 1980; Goldberg et al. 1993), it was observed that the patient dramatically overshot the target 6 days after surgery. Interestingly, no sign of hy-permetria was observed for self-generated saccades per-formed toward stationary targets, suggesting that the cer-ebellum was not critically involved in the generation of these saccades. In parallel with this result, it has been suggested that the FEF may be more involved in the con-trol of self-generated saccades than in the concon-trol of re-flexive saccades. With respect to this hypothesis, it was shown, in monkeys, that lesions of the FEF did not dra-matically impair the accuracy of contralateral reactive saccades performed to jumping targets that remained il-luminated until foveation was achieved (Schiller et al. 1980; Lynch 1992; Sommer and Tehovnik 1997). In hu-mans, it was observed that localized FEF lesions did not consistently increase saccadic latency in a gap task (Pierrot-Deseilligny et al. 1991; Rivaud et al. 1994), con-trasting with the large impairment noted for intentional saccades, such as anti-saccades, memory-guided sac-cades, or predictive saccades. Also, in the FEF, the rCBF increase was found to be significantly greater in memo-ry-guided saccades than in reactive saccades (Sweeney et al. 1996). When considered together, the previous re-sults leave open the possibility that the FEF and the cere-bellum may be more critically involved in the generation of volitional and reactive saccades, respectively. As a consequence, one may not exclude the hypothesis that the selective cerebellar activation observed in the present study was task specific. It is possible that adaptation of self-generated saccades would have involved additional or different structures, including the FEF.
Metabolic activity does not change significantly in the SC during SA
In the present study, we did not find evidence that the SC was activated during SA. Because earlier imaging stud-ies have shown that PET cameras were not always suc-cessful at capturing kinematic-related rCBF increases within the SC (for a counter-example, see Paus et al. 1995), this result should be interpreted cautiously. How-ever, beyond this reservation, one should mention that