HAL Id: hal-01909279
https://hal.archives-ouvertes.fr/hal-01909279
Submitted on 1 Nov 2018
HAL is a multi-disciplinary open access
archive for the deposit and dissemination of sci-entific research documents, whether they are pub-lished or not. The documents may come from teaching and research institutions in France or abroad, or from public or private research centers.
L’archive ouverte pluridisciplinaire HAL, est destinée au dépôt et à la diffusion de documents scientifiques de niveau recherche, publiés ou non, émanant des établissements d’enseignement et de recherche français ou étrangers, des laboratoires publics ou privés.
Mode I fracture of tropical woods using grid method
Bernard Odounga, Rostand Moutou Pitti, Evelyne Toussaint, Michel Grediac
To cite this version:
Bernard Odounga, Rostand Moutou Pitti, Evelyne Toussaint, Michel Grediac. Mode I fracture of tropical woods using grid method. Theoretical and Applied Fracture Mechanics, Elsevier, 2018, 95, pp.1 - 17. �10.1016/j.tafmec.2018.02.006�. �hal-01909279�
Mode I fracture of tropical woods using grid method.
Bernard Odoungaa,b, Rostand Moutou Pittia,c,, Evelyne Toussainta, Michel Gr´ediaca,
aUniversit´e Clermont Auvergne, CNRS, Institut Pascal, F-63000 Clermont-Ferrand, France bUniversit´e des Sciences et Techniques de Masuku, BP 901, Franceville, Gabon
cCENAREST, IRT, BP. 14070, Libreville, Gabon
Abstract
The cracking properties in opening mode of three tropicals species from the Gabonese forest, namely Iroko (Milicia Excelsa), Okume (Aucoumea klaineana Pierre), and Padouk (Pterocarpus soyauxii), were investigated in this study. Various tests were performed at room temperature and for two different thicknesses. A full-field measurement technique, namely the grid method, was used in order to obtain the displacement and strain maps near the crack during the tests. The mechanical parameters, the specificities of the wood species, the Arcan system and the grid transfer method are first described. For all the specimens, the initial crack length was oriented along the fiber direction (RL). The instan-taneous failure tests were performed using two types of specimens: the modified Compact Tension Shear (CTS) and the Mixed Mode Crack Growth (MMCG) specimens. The im-ages of the grid were recorded and analyzed to obtain the displacement maps. The crack opening, the location of the crack tip as well as the strain fields on the surface of the specimens were deduced from these displacement maps. The experimental critical energy release rate Gc was evaluated by the compliance method in imposed displacement. In the case of instantaneous crack with CTS specimens, the comparison of the initial value of Gc for all the samples show that this quantity strongly depends on the thickness and density of the species under study. Crack propagation was observed for a thickness equal to 20 mm only. The results of the crack propagation with the MMCG specimens show the same dependence, and confirm the quasi-brittle fracture behavior of Iroko. The experimental results are scattered, but clear trends can be observed concerning the fracture parameters of the in previous studies described in the literature on wood species with wood species under study. The results are finally compared with those given densities similar to those studied here.
Keywords: Tropical woods, fracture analysis, MMCG and CTS specimens, grid method.
1. Introduction
Wood contributes to sustainably limit global warming by fixing greenhouse gases [1]. In Central Africa and more specifically in equatorial regions, the forest plays a key role in this regulation [2, 3]. In the case of Gabon, which shelters various species [4], the forest represents 85% of the territory, among which 13% represents protected national parks. This significantly contributes to the regulation of the climate change [5, 6, 7]. In addition, the recent decision of the Gabonese government to stop the exportation of tropical species has opened the way to their local expansion, and a more systematic use in local individual and industrial buildings [8, 9, 10]. However, the mechanical behavior of these species, and more specifically their failure properties, remains poorly studied in the literature, which hampers the reliable design of such structures. This may lead for instance to the sudden failure of structures during their service life, which is not acceptable. Studying the failure properties of tropical woods is therefore crucial to guide local engineers in their choice of building materials other than concrete and steel.
This paper focuses on the initiation of crack and on crack propagation at room tem-perature of the following tropical species: Okume (Aucoumea Klaineana Pierre), Iroko (Milicia Excelsa) and Padouk (Pterocarpus Soyauxii). The choice of these species is jus-tified first by the fact that they are widespread in the tropical forest. They are therefore commonly used in carpentry/paper marking, in cooperage, packaging, maritime work, and luxury furniture [11, 12, 6]. A short review of the literature shows that few authors investigated the mechanical behavior of these tropical species [13], which limits their use in structural applications. Such species however feature interesting properties. For exam-ple, they are quite homogeneous, and the studies available on their mechanical properties show that they have interesting characteristics in terms of hardness, fracture toughness, shearing and compression properties parallel to the grain. Some authors propose suitable models for the strength of some Cameroonian hardwood species in tension [14], as well as for the strength properties of branchwood and stemwood of some tropical hardwood structure species [15], but these studies do not deal with failure properties. Some other
of juvenile and adult wood in plantations is investigated more specifically in [6]. Recently, the hydro-mechanical behavior of Aucoumea Klaineana Pierre under drying process [16] and under cyclic compressive loading has been studied for different internal moisture con-tents [17, 10]. Hovewer, the fracture mechanics aspects are not discussed for the three species studied here. Note finally that the influence of the physical and mechanical char-acteristics on the behavior of some tropical woods during machining is studied in [18].
Various geometries have been proposed in the literature in order to determine the fracture parameters of non-tropical species. Among them, following the compact shear specimen developed by Richard [19], Valentin [20] proposed a new Compact Tension Shear (CTS) specimen geometry in order to study the mixed mode fracture properties of orthotropic materials such as wood. However, due to the shape and thickness of such wood specimens, the portion of the loading curve where crack propagation occurs is narrow and unstable. In order to overcome this instability issue, it is proposed in Ref. [21] a specimen featuring a new geometry inspired from that described in Ref. [22]. This new specimen is named Mixed Mode Crack Growth (MMCG) specimen. It is shown in [21] that crack growth in Abied Alba Mills is stable in opening mode with this type of specimen. With this geometry, it is also possible to obtain a stable crack process in mixed mode configuration, and to identify the most influencing parameters of wood failure [23]. The MMCG geometry was used in the present study for these reasons. Some CTS specimens were also employed to investigate the effect of the thickness on the failure properties of the three species under study.
In mechanics, proposing the appropriate model in order to track the crack tip and to measure the crack opening generally relies on specific tests for which suitable models and measuring methods are available. Full-field measurement techniques such as Digital Image Correlation (DIC) have been used for this purpose in several cases [24, 25, 26, 27, 28, 29]. Belrhiti et al. dealt with the refinement of the digital image correlation technique to study the fracture behavior of refractory materials [30]. The grid method features however a better compromise between spatial resolution and displacement resolution than DIC, as recently shown in [31]. This is illustrated in [32] for instance, where crack propagation is studied in notched aluminium specimens. This technique is therefore used here again in the case of wood specimens.
In the present work, the objective is to study the fracture behavior in the crack opening mode of Okume, Iroko and Padouk by using the grid method at room temperature. CTS and modified MMCG specimen geometries are considered in order to obtain the instantaneous crack for these species. In addition, different thicknesses are also tested to see their impact on the energy release rate at the beginning of propagation and at break, especially for MMCG specimens.
2. Materials and method
Wood specimens
Tropical climates are characterized by a high rainfall almost all the year. The dry season is short in time, and this does not allow the soil to absorb large amount of water. This also causes the dryness of the plants not to occur. It means that the trees have a continuous growth in these regions. The distinction between summer wood and winter wood is therefore not perceptible in tropical species, which is not the case in species growing in temperate-climate countries. The samples were cut approximately one meter above the roots of the tree on feet (see the blue square in Figure 1). All samples were oriented along the direction of the grain (see the direction of the red arrow in Figure 1). The three species under study also exhibit various density values, which is important here since this parameter is known to influence the fracture properties of wood. Okume belongs to the category of very light woods (relative density 0.44). Okume has a light red color, which tends towards the white in the dry state. Its grain is fine. It can reach between 60 and 120 cm in diameter. Its use class is 2 [33]. Iroko is classified as light and medium heavy (relative density 0.64). Iroko is yellow brown in color with golden reflections. Its grain is coarse and its diameter can reach 80 to 100 cm. It is classified in use class 3. Finally, Padouk falls in the categories medium heavy and heavy (relative density 0.79). Padouk is red in color. Its grain is coarse and its diameter lies between 60 and 100 cm. Its use class is 4 et 5. Figure 1 shows the aspect of the three species, from the tree to the specimens.
The moisture content (M C) of the specimens are given in Table 1. This quantity is found using the following formula:
M C(%) = mS− m0 m0
× 100% (1)
where mS is the original weight and m0 the oven-dried weight. The specimens were therefore first weighted to obtain the wet mass noted mS. These values were obtained at room temperature, T=210C ± 2 0C, and relative humidity (HR) = 42% ± 2% The other mechanical properties are collected in Ref. [11]. They were obtained for T = 220C, M C = 12% and HR = 44% (Table 1). The specimens were put in an oven set at a temperature of 1100C to determine the dry mass m
0. The standardized temperature is 1030C [34], but temperature between 1000C and 1300C are often used in practice and accepted. The temperature that we used here falls within this range. The specimens remained in the oven until the mass had completely stabilized for 4 days. The specimens were weighted three times a day to check if their weight had stabilized. The values were also measured with a hygrometer and the results obtained with this device are similar to those obtained with Equation 1.
Wood Aucoumea klaineana Milicia excelsa Pterocarpus soyauxii Species or Okume (SD) or Iroko (SD) or Padouk (SD) Average Relative Density 0.44 (0.06) 0.64 (0.06) 0.79 (0.09)
MOE (MPa) 9690 (1231) 12840 (2496) 15870 (1885) MC (%) 9.12 7.94 7.29 CSR (MPa) 36 (5) 54 (6) 65 (8) CRFS (MPa) 62 (11) 87 (15) 116 (24)
Table 1: Mechanical characteristics. MOE: longitudinal modulus of elasticity, MC: moisture content, CSR: compression stress of rupture, CRFS: static bending failure stress, SD: Standard deviation.
In Table 1, it can be observed that the internal humidity of the specimens decreases as the density increases, which seems logical. The pieces of trunks of all the species tested here were cut in Gabon beforehand and kept under equatorial atmosphere for 1 month. They were then shipped to the place were the tests were carried out (Aubiere, France). These pieces were kept at room temperature in the laboratory, under the environment described above. The samples were therefore debited in the environmental conditions of the laboratory. In this case, no drying of the samples was observed during the tests. The internal moisture content of all the specimens given in Table 1 were measured just before
Figure 1: From the tree to the specimens.
testing.
Wood CTS and modified MMCG specimens
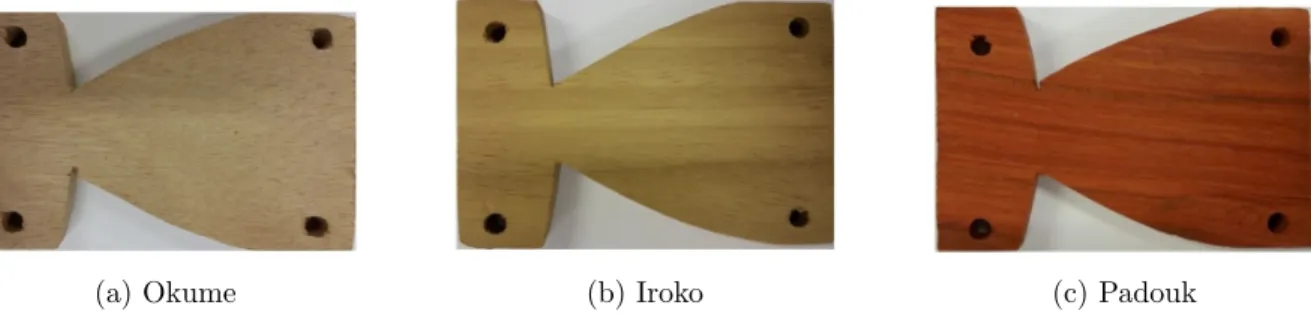
The dimensions of the CTS specimens are given in Figure 2. Two values for the thick-ness were considered, namely 12.5 mm and 20 mm, to see if this parameter influences the results. For all the specimens, a notch (25 mm in length) was machined along the fiber (RL) direction. The notch was then slitted with a cutter over a length of about 3 mm to initiate the crack so the initial length a of the crack is equal to 28 mm. Figure 3 represents an example of CTS specimen for each wood specie.
Figure 2: Dimensions of the CTS specimen (in mm).
(a) Okume (b) Iroko (c) Padouk
Figure 3: Typical CTS specimens.
Compared to the initial version of the MMCG specimen [21], the size of the specimens tested here is somewhat smaller. The reason is that we used here the same testing device as that used for the CTS specimen, thus limiting the size of the MMCG specimens (see Figure 4). For all the MMCG specimens, the initial length a of the crack was equal to (20 mm + 2 mm). Figure 5 shows typical MMCG specimens. Two values for the thickness were considered in the study, namely 15 mm and 20 mm.
The advantage of the MMCG specimen is that crack propagates in a stable manner after appearance. On the contrary, CTS specimens are generally characterized by the instantaneous crack propagation after appearance, making the phenomenon unstable. An apparent crack stability is observed if the thickness of the CTS specimen becomes signif-icant. The advantage of the MMCG specimen is also to obtain a decrease of the energy release rate during crack growth. In this case, if the material is viscoelastic, one can easily
separate time-dependent effects and fracture parameters in order to know the real impact of time on the failure of the material.
Figure 4: Dimensions of the modified MMCG specimen (in mm).
(a) Okume (b) Iroko (c) Padouk
Wood species Aucoumea klaineana (Okume) Milicia excelsa (Iroko) Pterocarpus soyauxii (Padouk) Tested CTS specimens O12.5 I12.5 P12.5 O20 I20 P20 O1M15 I1M15 P1M15 O2M15 I2M15 P2M15
Tested MMCG specimens O1M20 I3M15 P3M15
O2M20 I4M15 P1M20
O3M20 I1M20 P2M20
Table 2: Notations used in this study. where: O = Okume; I = Iroko; P = Padouk; 1,2,3,..= Test number for MMCG specimens; M = MMCG; 12.5, 15 and 20 = Thickness of the specimens.
Table 2 gives the notation and the name of the specimens tested for this paper. Six CTS specimens were tested (three species, two thickness values per specie). For the MMCG specimens, we report here only the tests for which crack propagation could really be observed and quantified, which explains why the percentage of specimens featuring a 15 mm and 20 mm thickness fluctuates from one specie to each other.
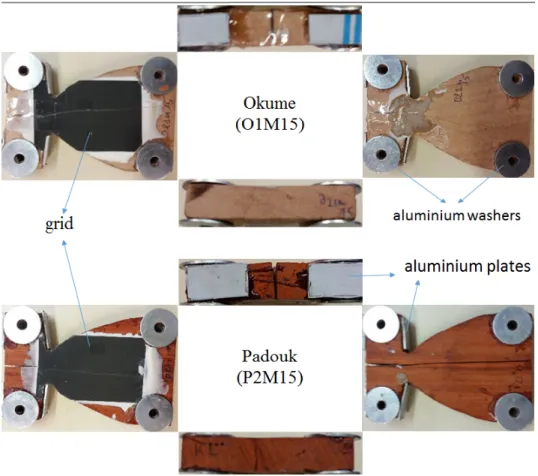
Figure 6 shows two typical examples of tested specimens. Aluminium washers were bonded to reinforce the fastening holes. They limit the risk of early failure of the speci-mens in the connexion zone. The upper part of the specispeci-mens was reinforced with small aluminum plates for the same reason. An epoxy adhesive was used to bond the washers and the small plates. A grid was transferred on the surface of each specimen in order to determine the displacement and strain fields. It is clearly visible in Figure 6. The method used to process the grid images is described in the next section. Depending on the specie and on the specimen, the orientation of the fibers is more or less visible to the naked eye. Some deviation with the theoretical orientation of the fibers can also be observed. This is visible through the slight inclination of the fibers with respect to the orientation of the initial crack.
Figure 6: Typical MMCG specimens equipped with grids.
Figure 8: MMCG specimen and Arcan fixture.
Figures 7 and 8 show the Arcan testing device designed and machined specifically for this study. It is made of high tensile strength steel (HLE), whose main characteristics are given in [35]. This Arcan device is suited to both the modified CTS and the modified MMCG specimen geometries. A finite element simulation was performed to check that the limit of elasticity in the Arcan testing device was not attained during the test. The fixing holes for the wood specimens had a diameter ϕ = 5 mm, and the loading holes (see Figure 8) a diameter φ = 7 mm. These fixing holes were drilled in order to be able to load the specimen with different orientations with respect to the vertical direction in order to activate mixed cracking modes. This orientation is described by an angle denoted β. In the present cas, only mode 1 is considered, which corresponds to the specimen and device shown in Figure 8.
Measuring displacement and strain fields using the grid method
The grid method is employed here to measure the in-plane displacement field on the front face of the specimen in order to detect and track the crack tip during the tests. This technique consists in processing images of a grid transferred onto the specimen before testing in order to determine the displacement and strain maps [36]. A bidirectional grid with a pitch value equal to 0.2 mm is first printed with a high-resolution printer (50,800 dots per inch) onto a thin polymeric sheet. This sheet is then bonded on the sample
using a thin white adhesive layer (reference: Epotecny E504). After polymerization of the adhesive layer, the polymeric sheet is peeled off and only the ink remains bonded on the white adhesive layer. The final thickness of this layer is typically equal to some tenths of mm, so it can be reasonably assumed that the grid perfectly reflects the deformation of the surface of the specimen without influencing it. Full details on the grid transfer procedure are given in [37]. Images of transferred grids are then taken with a camera during the test. The PCO Sensicam camera used in this study has a 12-bits/1040 × 1376-pixels CCD sensor (CCD=charge-coupled device). It is equipped with a 105 mm lens. The magnifica-tion (and thus the distance d between camera and specimens) was adjusted in such a way that the grid period was sampled with 5 pixels. This leads to d = 670 mm. With this setting, the crack and a portion of the specimen, which contains the crack under study, were in all the cases within the field of view of the camera. The camera captured about 1.83 frames/second during the tests. It was checked that with this configuration and with the prescribed displacement rate equal here to 0.005 mm/s, a temporal image averaging over 8 frames could be performed without inducing any blurring of the grid images. This averaging procedure is performed for noise reduction purposes, as studied in [38]. This averaging was made only for the CTS specimens, not with the MMCG specimens tests. The reason is that some dynamic events such as sudden crack propagation appeared dur-ing the tests, and the best possible temporal resolution was needed to capture such events between two consecutive images. Finally all these grid images were processed after testing using an in-house programme. The pattern being quasi-periodic, the program relies on Fourier analysis to compute the phase change of the quasi-regular marking of the surface. The reason is that the displacement field is proportional to this phase change [36]. Note that this measurement technique has been used successfully recently to measure the strain fields in wood specimens [39, 40]. Full details on this grid image processing technique are given in a recent review [31]. In this last paper, the authors compared the grid method and DIC, which is the most popular technique used in experimental mechanics. Other recent versions of the corresponding programs are available online [41].
As for DIC, the systematic error is all the higher as the frequency of the actual strain distribution is high. Further information on this phenomenon is available in [36, 42, 43]. The random error is mainly due to sensor noise propagation. The standard deviation for the noise in displacement and strain maps has been estimated in [43] with similar
experi-mental conditions (lighting, type of camera, shutter time, aperture). In [43], the standard deviation for the noise in displacement maps (Ux or Uy) due to sensor noise propagation is less than one micrometer. The same quantity for strain (εxx or εyy) typically lies between 3 and 4×10⁻⁴, depending on the lighting conditions. It is √2 times lower for εxy. This noise level is lower when grid images are averaged over time.
Figure 9: Typical examples of grid transferred on CTS and MMCG specimens.
Compliance Method
In this study, the value of Gc of the three species was calculated using the compliance method. The following equation was used for this calculation:
GC = F c2 i 2b × ( ∆C ∆a)d (2)
where F ci (i = 1, 2, 3, ...) is the so-called critical strength which indices an increase ∆a of the crack length a, and b is the thickness of the specimen. As a general remark, the compliance is defined by ∆C = Ui/F ci, where Ui is the crack opening induced by each critical load F ci. In Equation (2), ∆C is the increase in compliance corresponding to the increase in crack length ∆a. Index d in Equation 2 means that the test is carried out
with an imposed displacement. For the MMCG specimens, crack propagating stepwise, we deal with the increments ∆C and ∆a between two stable configurations of the crack. Figure 10 shows a typical strength-crack opening curve in which sudden strength drops are clearly visible. Small force changes are however not really observable in practice to the naked eye, so small drops are detected automatically by a in-house program, and the corresponding crack length increase is deduced from the displacement maps.
Figure 10: Force versus the crack opening U.
Deducing the crack opening and the location of the crack tip from the dis-placement field
Crack opening
The crack opening U involved in Equation 2 is deduced from the displacement maps by using the following procedure. Two points A and B are chosen. They are located each on one of the opposite sides of the crack (see Figure 11). These points are sufficiently far away from the crack itself to be sure that the determination of the displacement at those points is not impaired by the presence of the singularity in the displacement field
difference between the vertical displacement measured at those points can be considered as the crack opening along the vertical line defined by these points. In practice, this distance is slightly greater than one half of the width of the window of the Windowed Fourier Transform (WFT) used in the software which processes the grid images. This window is a Gaussian with a standard deviation equal to 5 pixels. It means that according to the 3-sigma rule, 5 × 3=15 pixels is the minimum distance that should be used between each point and the crack. The crack is located between these two points but its location may fluctuate from one specimen to each other. Consequently, the distance between A and B was chosen to be equal to 90 pixels to have a sufficient safety margin. Then, the crack opening is obtained according the difference introduce by the following absolute value uy(A) − uy(B).
Location of the crack tip
The location of the crack tip must be precisely estimated, the crack tip propagation being involved in Equation 2 above. It is important to mention that the precise location of the crack tip cannot be directly estimated by investigating the displacement field to the naked eye. The main reason is that the displacement field returned by the program processing the grid images is, at first approximation, the actual one convolved by the window used in the WFT [44]. A spatially correlated noise, whose covariance matrix is estimated in [44], is added to this result. The convolution causes the displacement maps to be slighthy blurred, and the crack tip is thus not clearly visible. In this context, the location of the crack tip was determined using the same procedure for all the displacement maps. Its main steps are as follows:
• a rectangular zone supposed to contain the crack tip is first defined ;
• the gradient of the displacement field along the vertical y direction, in other words the apparent value for εyy, is estimated by numerical differentiation of the displace-ment field in this zone ;
• the apparent value for εyy is expected to tend toward infinity for the points of the maps belonging to the crack, but the apparent value returned by the image differentiation of the displacement map is finite, with a value which diminishes when approaching to the crack tip. A threshold value for the apparent value of εyy
is therefore fixed, and the coordinates of the crack tip are defined by the coordinates of the point located as right as possible (the crack propagates from left to right), and for which this threshold value is attained.
Figure 11: Points A and B used for determination of the crack opening U .
The threshold value for εyy was chosen to be equal to 0.10. This choice may potentially affect the result, so other values close to 0.10 were also tested to see if the coordinates of the crack tip are really sensitive to this parameter. Figure 12 shows the coordinate of the crack tip obtained for three values of this threshold, namely 0.08, 0.10 and 0.12. A Padouk specimen (P32M20) is used for this purpose. It should be noted that the crack front is not precisely defined in quasi-fragile materials, because of the mechanism of propagation of the crack which creates a failure zone.
It can be concluded that changing this threshold value around 0.10 does not influences the results. Choosing 0.10 can therefore be considered as reliable. Figure 13 shows a typical point cloud showing the location of the crack tip for a set of images captured during a typical test on a Padouk specimen. These coordinates are obtained with the detection method described above.
It is clear in this figure that the crack propagates stepwise, since some “voids” are visible along the x-direction, between the abscissa of two consecutive locations of the
Figure 12: Abcissa of the crack tip obtained for three different threshold values of εyy.
Figure 13: Location of the crack tip.
obtained by subtracting directly the abscissa of two consecutive points in case of force drop, the vertical change in location being negligible.
Experimental setup
A 200 kN Zwick / Roel testing machine shown in Figure 14 was used to perform the tests. The camera and the Arcan fixture described above are clearly visible in this figure. The camera was fixed on a tripod in order to shot stabilized grid images during the tests. The miniature steel Arcan fixture used to load the specimens is also visible. The testing machine, driven with imposed displacements, was equipped with a force transducer. The information combined with the displacement uy obtained with the grid method gave us the force-displacement curves for each test.
Figure 14: Experimental setup.
3. Results and Discussion
The results of the tests are presented in this section. Various curves are presented and discussed. The energy release rate for both the CTS and MMCG specimens are calculated and analyzed for the three wood species.
Displacement and strain maps.
Typical vertical displacement (uy) and strain maps (εyy) obtained with the grid method at the end of the tests are shown in Figures 15 and 16 for the CTS and MMCG specimens, respectively. Displacement maps are used to determine the crack opening during the test and strain maps anable us to localize the location of the crack tip. The methodology was presented in the previous section. For the sake of clarity, only two species (Okume and Padouk) are presented in Figures 15 and 16 for the two thicknesses considered here (12.5 mm and 20 mm for CTS specimens and 15 mm and 20 mm for MMCG specimens).
Cracks are clearly visible in Figures 15 (a) and 16 (a). They correspond to discon-tinuities in the vertical displacement maps. The value of the displacement is negative because the upper jaw moves in the opposite direction of the y-axis. Consequently, the absolute value of the vertical displacement is the highest at the top zone of the maps. Generally, cracks tend to propagate along the fiber direction. This is clearly visible for the MMCG specimens which were tested in the RL plane. In practice, the crack path is very complex: when specimens are tested in the LR or LT planes, cracks always propagate
Figure 15: Typical maps for CTS specimens at the end of the tests : a) displacement maps; b) strain maps.
The strain values presented in Figures 15 (b) and 16 (b) are close to zero except in the neighborhood of the cracks. Observing the typical maps shown in Figures 15 (b) and 16 (b) enables us to highlight an interesting feature: for the CTS O12.5 and MMCG O1M 15 specimens for instance, the crack propagation is driven by the transverse tension at the front of the crack tip, where strain concentration occurs. This result in also visible for CTS P 12.5 and P 20 specimens in the corresponding strain maps showing the crack tip.
Analyzing the strain maps for several loading levels is useful to characterize the two types of cracks: instantaneous or progressive. Results for the three wood species, the two types of tested specimens and the two thicknesses for each type of test are presented in the following sections.
Load - Crack opening curves.
The global load - crack opening curves are presented in Figure 17 for the CTS spec-imens, and in Figures 18 to 20 for the MMCG specimens. The crack opening values (displacement of the two lips of the crack) are directly obtained from the displacement maps, following the methodology presented in Section “crack opening”. The
displace-Figure 16: Typical maps for MMCG specimens at the end of the tests : a) displacement maps; b) strain maps.
ment of the moving jaws is not used here because it is higher than that obtained with the displacement maps due to the clearance take-up that occurs during the test.
Two thickness values are studied: 12.5 mm and 20 mm for the CTS specimens. Table 3 presents the loading values at failure and the corresponding maximum crack opening for these two thicknesses and for the three wood species. The influence of the thickness on the loading value at failure is clearly visible. Indeed, the loading value at failure is smaller for the thin specimens than for the thick ones. The maximum crack opening also depends on the thickness of the specimen but its influence is less sensitive than for the loading value at failure. For the P 20 and O20 specimens, the crack opening evolves progressively, and several critical force Fc directly obtained from the load-crack opening curves. The maximums crack opening corresponding to the failure load for thickness values equal to 12.5 and 20 mm have been specified.
Two thicknesses are studied: 15 mm and 20 mm for the MMCG specimens. Due to the high heterogeneity of the specimens and their densities, the load values at failure are not directly related to what was obtained with the the thickness, contrary to what was obtained with the CTS specimens. Similarly, the maximum crack opening value strongly fluctuates from one specimen to another for a given specie and for a given thickness. However, the load at failure of the Padouk specimens are above 1200 N regardless of the thickness of the specimen, with two exceptions. This result underlines the influence of the
Figure 17: Load - crack opening curves for the CTS specimens.
Thickness: 12.5 mm Thickness: 20 mm
Load value at faillure Maximum crack opening Load value at faillure Maximum crack opening
(N) (mm) (N) (mm)
Okume 141 0.030 1520 0.090
Iroko 375 0.019 1991 0.019
Padouk 568 0.020 1950 0.280
Table 3: Load value at faillure and corresponding crack opening for the CTS specimens.
Figure 18: Load - crack opening curves for the MMCG Okume specimens and two thicknesses (15 mm and 20 mm).
Figure 19: Load - crack opening curves for the MMCG Iroko specimens and two thicknesses (15 mm and 20 mm).
Figure 20: Load - crack opening curves for the MMCG Padouk specimens and two thicknesses (15 mm and 20 mm).
Crack length-load analysis.
For the 12.5 mm-thick specimens, a sudden failure corresponding to a sudden drop of the load is observed. Consequently, the crack length instantaneously increases by 11 mm for the Okume specimen, 16 mm for the Iroko specimen and 32 mm for the Padouk specimen. No crack propagation is observed while the loading level increases. By contrast, the crack length increases while the loading level decreases. This result is due to the bridging of the crack caused by the wood fibers, which cannot be considered for the calculation of Gc.
The crack propagation scheme is different for the 20 mm-thick CTS specimen, more particularly for the Okume and Padouk specimens. Figure 21 presents the evolution of the crack length as a function of the load for these two specimens. The crack length slightly increases up to a load value equal to 1520 N and 1950 N for the Okume and Padouk specimens, respectively. Then the crack length suddenly increases, leading to the failure of the specimen. No crack propagation is observed for the 20 mm-thick CTS concerning the Iroko specimen. The crack developed out of the grid, in the connecting zone and the holes through which the load was applied. This is certainly due to the brittleness of Iroko.
Figure 21: Example of crack length as a function of the load for two CTS specimens (Thickness 20 mm).
Figure 22 shows an example of crack length change as a function of the load for the three species. ∆a is the crack length increment. The initial value of the crack length, denoted ai is ai = 28 mm for the CTS specimens, and ai = 22 mm for the MMCG specimens. The total crack length is equal to a = ai + ∆a for the MMCG specimens whatever the thickness. The crack length graduallly and continuously increases contrary to what happens with the CTS specimens, for which the crack suddenly propagates up to the failure of the specimen.
Figure 22: Example of crack length as a function of the load for three MMCG specimens (thickness: 15 mm and 20 mm).
Critical energy release rate
In this section, the value of Gc obtained with both the CTS and MMCG specimens are calculated, and the influence of the thickness of the specimens is highlighted.
Figure 23 presents Gc as a function of the crack length a calculated with the (compli-ance) method for the CTS specimens, for the three wood species and the two thickness values. For the 12.5 mm-thick specimens, only one value of Gc is calculated because no crack propagation was observed. The obtained values are equal to 5 J/m2, 10 J/m2 and 18 J/m2 for the Okume, Iroko and Padouk species, respectively. It is worth highlighting that Gcis directly connected to the average density given in Table 1. Indeed Gcincreases proportionaly to the density of the species. For the 20 mm-thick specimens presenting a crack propagation (O20 and P 20 specimens), the initial critical energy release rate Gic inducing the beginning of the crack propagation is equal to 3 J/m2 for the Okume spec-imen and to 282 J/m2 for the Padouk specimen. The initial energy release rate (G
ic) is the value obtained from the onset of crack propagation. Globally, Gc is much higher for Padouk than for Okume. It means that the amount of energy necessary to induce the
crack initiation and the crack propagation is higher for Padouk than for Okume as proven before. As for the 12.5 mm-thick specimens, this result is consistent with the density of the tropical species. Finally, the maximal critical energy release rate Gmc is also corre-lated to the crack opening obtained just before the failure of the O20 and P 20 specimens. The maximum critical energy release rate (Gmc) is that obtained at the failure of the specimen. Indeed, the obtained values are equal to 4.3 mm and 12.4 mm, for the Okume and Padouk specimens, respectively (see Figure 21). To conclude with the 20 mm-thick specimens, no crack propagation is observed for the I20 specimen. Consequently, only one value of Gc is obtained in this case. The obtained value is equal to 35 J/m2.
Figure 23: Critical energy release rate of Okume (O), Iroko (I) and Padouk (P) (thickness 12.5 mm and 20 mm).
The results obtained with the MMCG specimens is now presented for the three species and for the two thicknesses. Figure 24 shows the value of G as a function of the crack length for Okume. It is worth remembering that the initial crack length is equal here to 22 mm. The results for the two thicknesses are presented and analyzed. The Gic and G values of the specimens are calculated. The results are presented in Table 4.
The average value Gic for the 15 mm and 20 mm-thick specimens is equal to 6.5 J/m2 and 46 J/m2, respectively. This clearly underlines the influence of the thickness on this value. The average values of Gmc inducing the failure of the specimens for the 15 mm and 20 mm-thick specimens are equal to 317 J/m2 and 248 J/m2, respectively. These last results are difficult to interpret because of the variability and the heterogeneity of the different specimens. On the contrary, the Gic values are relatively close to each other. Consequently, the influence of the thickness of the specimens on this quantity is clearly visible. The greater the thickness, the greater the initial value for Gc.
Figure 24: Critical energy release rate Gc as a function of the crack length for Okume (O).
O1M15 O2M15 O1M20 O2M20 O3M20 Gic 9 4 55 47 36
Gmc 188 446 137 520 88
Table 4: Individual values of Okume: Gicis the initial critical energy release rate; Gmcis the maximaum
critical energy release rate.
The same analysis can be performed for both the Iroko and Padouk specimens. Fig-ures 25 and 26 present G as a function of the crack length for the Iroko and Padouk
specimens. Gic is given in Tables 5 and 6 for Iroko and Padouk, respectively. Concerning Iroko, the average values of Gic for the 15 mm and 20 mm-thick specimens are equal to 19 J/m2 and 37 J/m2, respectively. This shows the influence of the thickness. The same remark as for Okume can be drawn concerning the significant fluctuations of Gmc for the 15 mm thick specimens.
Figure 25: Critical energy release rate Gc as a function of the crack length for Iroko (I).
I1M15 I2M15 I3M15 I4M15 I1M20 Gic 14 18 24 20 37
Gmc 575 120 192 116 66
Table 5: Individual values of Iroko: Gic is the initial critical energy release rate; Gmc is the maximum
critical energy release rate.
Finally, the Padouk specimens are analyzed in terms of Gc values. In Table 6, the average value of Gic is equal to 12 J/m2 and 35 J/m2 for the 15 mm and 20 mm thick specimens, respectively. The initial value of Gc for specimen P 2M 15 (1 J/m2) may look strange. A detailed analysis of the orientation of the crack revealed an inclination of the
Okume can be drawn concerning the significant fluctuations of the maximal value of G for both the 15 mm and 20 mm thick specimens.
Figure 26: Critical energy release rate Gc as a function of the crack length for Padouk (P).
P1M15 P2M15 P3M15 P1M20 P2M20 Gic 15 1 21 34 36
Gmc 271 415 80 514 109
Table 6: Individual values of Padouk: Gicis the initial critical energy release rate; Gmcis the maximum
Discussion
Table 7 compares the different values obtained with the values from the bibliography.
Designation Orientation Relative density Gmc(J/m2) Standard deviation (SD)
Spruce [45, 46] RL 0.40 - 0.50 159 - 345 60 / 186 Pine [46] RL 0.40 - 0.50 346 ≈ 90 Oak [46] RL 0.70 - 0.80 234 ≈ 110 Okume RL 0.39 - 0.50 248(2)/ 317(1) 129 / 160 Iroko RL 0.56 - 0.70 251(1) 200 Padouk RL 0.70 - 0.88 255(1)/ 312(2) 175 / 200
Table 7: Comparison of the means of Gmcfor MMCG specimen with the literature: thickness 15 mm (1)
and 20 mm (2).
The literature is silent about cracking of tropical species. However, cracking studies on temperate species are available especially in opening mode. In order to propose an objective comparison, the discussion focuses here on tempered species featuring the same density as well as a crack orientation along the RL direction [47]. Indeed, Voichita Bu-cur [45] studied the spruce. He tested the specimens along the RL direction. Reiter et al. [46], also cited by [45], performed tests on cubic specimens along the RL direction. According to the principle of the Wedge Splitting test (WS), these tests were carried out on Spruce, Pine, and Oak specimens. The experimental tests were carried out in the same conditions (air-conditioned room at 200C and 65% relative humidity). The specific breaking energy or maximal critical energy release rate Gf (average values and standard deviation of six measurements for each softwood and hardwood) is considered. Hence, the mean of Gmc for Okume, Iroko and Padouk (given in Tables 4, 5 and 6 respectively) are reported in Table 7 in bold and compared with Spruce, Pine and Oak respectively. The comparison shows that small deviations were obtained between the Okume and Spruce values for the two thicknesses considerred here. For the 15 mm-thick Okume specimens, a 8% difference with the values obtained with Spruce is observed. A 8% difference is observed between 15 mm-thick Padouk specimens and the Oak specimens. Only the stan-dard deviation in terms of Gc values at minimum and maximum failure is observed. We have approximately the same conclusion for the Iroko specie. The scatter of the results is
certainly caused by the very nature of the material. Indeed the crack path is more regular with tempered species than with tropical species because of the annual rings, which exist in tempered species. Annual rings behave as channels for crack propagation and thus make crack paths more regular and predictable. The measurement technique used here (the grid method) does not feature a higher measurement error than similar techniques used to measure displacement and strain fields on wood specimens, such as DIC [28, 31]. In numerous studies dealing with fracture mechanics of tempered wood species, the Gc value increases with crack extension up to a plateau value (see [48, 49]). Then, a stability range is observed before a sudden increase and the final collapse of specimen. This observation depends on the shape of the specimen, the length of the stability range, the orientation of the annual rings and the microstructure of the specie. For the MMCG specimens made of the tropical specie studied in this work, the stability range is narrow compared to what is observed with the tempered species investigated in [20, 21, 23, 48, 49] and [50]. Consequently, the collapse occurs suddenly before reaching the plateau value. In addition, the phenomenon of fiber bridging in this type of materials is more pronounced because of the fact that annual growth rings do not exist. This can lead to the increase of the observed R-curves.
4. Conclusion
In this study, fracture tests were performed on three tropical species: Iroko (Milicia Excelsa), Okume (Aucoumea klaineana Pierre) and Padouk (Pterocarpus soyauxii). A grid was transfered on each specimen to follow the crack tip. A new Arcan system was designed to test both the CTS and modified MMCG specimens. The opening and the crack tip location were detected from the displacement maps obtained by the grid tech-nique. The obtained values made it possible to use the empirical compliance method in order to calculate the critical energy release rate of each wood specie for different thick-nesses. For both the CTS and MMCG specimens, it is clear that the thickness, and the density have an influence on the toughness. Indeed it is shown that the critical energy release rate increases when the density increases in both the stationary and the crack growth processes. The crack length increment could not be measured for Iroko because of the quasi-brittle behavior of this specie compared to Okume and Padouk. The mean value Gmc for the three tested species were compared with those of various tempered species
featuring the same density.
In future studies, it would be necessary to investigate the thickness value of the CTS specimen necessary to observe the crack growth process. Further tests should also be performed in the other preferential directions of the wood for both the CTS and MMCG specimens. At the end, the mixed mode configuration should be applied at room temper-ature and for different moisture contents in order to know the real fracture toughness of tropical wood under indoor and outdoor conditions of tropical environments.
Acknowledgements
This work is partially funded by ANR (CLIMBOIS grant 13-JS09-0003-01) and by the Gabonese government.
References
[1] J.-C. Hourcade, P.-R. Shukla, Cancuns paradigm shift and cop 21: to go beyond rhetoric (2015).
[2] M. De Ridder, V. Trouet, J. Van den Bulcke, W. Hubau, J. Van Acker, H. Beeck-man, A tree-ring based comparison of terminalia superba climate–growth rela-tionships in west and central africa, Trees 27 (5) (2013) 1225–1238.
[3] G. N. Ajonina, J. Kairo, G. Grimsditch, T. Sembres, G. Chuyong, E. Diyouke, Assessment of mangrove carbon stocks in cameroon, gabon, the republic of congo (roc) and the democratic republic of congo (drc) including their potential for reducing emissions from deforestation and forest degradation (redd+), in: The Land/Ocean Interactions in the Coastal Zone of West and Central Africa, Springer, 2014, pp. 177–189.
[4] R. Safou-Tchiama, B. de J´eso, A. G. Akagah, G. S`ebe, M. P´etraud, A pre-liminary survey of the interfacial bonding of some tropical hardwoods towards succinic anhydride and 2-octen-1-yl succinic anhydride molecules: Impact of lignin and carbohydrate polymers structure on the chemical reactivity, Indus-trial Crops and Products 26 (2) (2007) 173–184.
[5] V. Medjibe, F. E. Putz, C. Romero, Certified and uncertified logging conces-sions compared in gabon: changes in stand structure, tree species, and biomass, Environmental management 51 (3) (2013) 524–540.
[6] M. J. Medzegue, S. Grelier, B. MBatchi, M. Nziengui, A. Stokes, Radial growth and characterization of juvenile and adult wood in plantation grown okoum´e (aucoumea klaineana pierre) from gabon, Annals of forest science 64 (8) (2007) 815–824.
[7] D. Iponga Midoko, C. Mikolo-Yobo, G. Lescuyer, F. Assoumou Mba, P. Levang, J. Chupezi Tieguhong, A. Ngoye, Evaluation of the contribution of ntfps gath-ering: to rural peoples livelihoods around two timber concessions in gabon, Agroforestry Systems (2016) 1–12doi:10.1007/s10457-016-0022-0.
[8] C. F. Pambou Nziengui, R. Moutou Pitti, E. Fournely, G. Godi, F. Dubois, Me-chanical characterization of european species: Picea-alba mill and douglas-fir, In: Insights and Innovations in Structural Engineering, Mechanics and Com-putation, Taylor & Francis Group, DOI: 10.1201/9781315641645-282 (2016) 17081712doi:10.1201/9781315641645-282.
[9] B. Odounga, R. Moutou Pitti, E. Toussaint, M. Gr´ediac, Experimental fracture analysis of tropical species using the grid method, in: Fracture, Fatigue, Failure and Damage Evolution, Springer 8, 2017, pp. 9–14.
[10] C. F. Pambou Nziengui, S. Ikogou, R. Moutou Pitti, Impact of cyclic compressive loading and moisture content on the mechanical behavior of aucoumea klaineana pierre., Wood Material Science & Engineering. DOI: 10.1080/17480272.2017.1307281.
[11] CIRAD, Agricultural Research for Development (1998) Tropical specie reports. Tropix 7-C (1998).
[12] C. Bouet, La saga de lokoum´e au gabon, Cah. O.R.S.T.O.M. sr. Sci. Hum. 17(3-4) (1980) 269–272.
of structural timber and species conservation in the forest of the congo basin, African Journal of Environmental Science and Technology 5 (2) (2011) 111–125.
[14] A. Foudjet, J. A. Fotsing, Statistical model of the strength of some cameroonian hardwood species in tension, Computers in industry 20 (1) (1992) 103–107.
[15] R. Okai, K. Frimpong-Mensah, D. Yeboah, Characterization of strength prop-erties of branchwood and stemwood of some tropical hardwood species, Wood science and technology 38 (2) (2004) 163–171.
[16] S. Ikogou, R. Moutou Pitti, S. Ekomy Ango, Hydro-mechanical behaviour of aucoumea klaineana under drying process, in: Workshop COST Action FP1303, Madrid, Spain, 2016, pp. 24–25.
[17] S. Ikogou, C. F. Pambou Nziengui, R. Moutou Pitti, S. Ekomy Ango, Experimen-tal characterization of gaboon species under cyclic compressive loading, World Conference on Timber Engineering (WCTE), Vienna, Austria.
[18] F. Eyma, P.-J. M´eausoone, P. Martin, Study of the properties of thirteen tropical wood species to improve the prediction of cutting forces in mode b., Annals of forest science 61 (1) (2004) 55–64.
[19] H. Richard, A new compact shear specimen, International Journal of Fracture 17 (5) (1981) R105–R107.
[20] G. Valentin, P. Caumes, Crack propagation in mixed mode in wood: a new specimen, Wood Science and Technology 23 (1) (1989) 43–53.
[21] R. Moutou Pitti, F. Dubois, O. Pop, A proposed mixed-mode fracture specimen for wood under creep loadings, International journal of fracture 167 (2) (2011) 195–209.
[22] F. Dubois, C. Chazal, C. Petit, Viscoelastic crack growth process in wood tim-bers: An approach by the finite element method for mode i fracture, Interna-tional journal of fracture 113 (4) (2002) 367–388.
[23] R. Moutou Pitti, A. Chateauneuf, Statistical and reliability analysis for mixed-mode fracture tests applied to wood material, Wood science and technology
[24] D. Choi, J. Thorpe, R. Hanna, Image analysis to measure strain in wood and paper, Wood Science and Technology 25 (4) (1991) 251–262.
[25] S. Vasic, A. Ceccotti, Influence of intermediate deformation rates in softwoods characterized with fracture resistance r-curves, Wood science and technology 43 (7-8) (2009) 591–614.
[26] O. Pop, M. Meite, F. Dubois, J. Absi, Identification algorithm for fracture pa-rameters by combining dic and fem approaches, International journal of fracture 170 (2) (2011) 101–114.
[27] O. Pop, F. Dubois, J. Absi, J-integral evaluation in cracked wood specimen using the mark tracking method, Wood science and technology 47 (2) (2013) 257–267.
[28] M. M´eit´e, F. Dubois, O. Pop, J. Absi, Mixed mode fracture properties char-acterization for wood by digital images correlation and finite element method coupling, Engineering Fracture Mechanics 105 (2013) 86–100.
[29] A. Jamaaoui, O. Pop, F. Dubois, G. Costa, Wedge splitting test on douglas genotypes using an integrated mixed-mode approach, Theoretical and Applied Fracture Mechanics.
[30] Y. Belrhiti, O. Pop, A. Germaneau, P. Doumalin, J. Dupr, M. Huger, T. Chotard, Refinement of digital image correlation technique to investigate the fracture behaviour of refractory materials, IOP Conference Series: Materials Science and Engineering 119 (1) (2016) 012010.
URL http://stacks.iop.org/1757-899X/119/i=1/a=012010
[31] M. Gr´ediac, B. Blaysat, F. Sur, A critical comparison of some metrological parameters characterizing local digital image correlation and grid method, Ex-perimental Mechanics. DOI: 10.1007/s11340-017-0279-xdoi:10.1007/s11340-017-0279-x.
[32] R. Moutou Pitti, C. Badulescu, M. Gr´ediac, Characterization of a cracked spec-imen with full-field measurements: direct determination of the crack tip and energy release rate calculation, International Journal of Fracture 187 (1) (2014)
109–121. doi:10.1007/s10704-013-9921-5.
URL https://doi.org/10.1007/s10704-013-9921-5
[33] CEN (European Commitee for Standardization), Durability of wood and wood-based products - use classes: definitions, application to solid wood and wood-based products. https://www.en-standard.eu/csn-en-335-durability- of-wood-and-wood-based-products-use-classes-definitions-application-to-solid-wood-and-wood-based-products/ (2013).
[34] S. Merakeb, Mod´elisation des structures en bois en environnement variable, Ph.D. thesis, Universit´e de Limoges, 46 (2006).
[35] E. Standard, Profils en acier hle - profilage froid, outillage et galets de profilage. http://www.profilage.net/profiles-en-acier-hle.html. (1995).
[36] M. Gr´ediac, F. Sur, B. Blaysat, The grid method for in-plane displacement and strain measurement : a review and analysis, Strain 52 (3) (2016) 205–243.
[37] J.-L. Piro, M. Gr´ediac, Producing and transferring low-spatial-frequency grids for measuring displacement fields with Moir and grid methods, Experimental Techniques 28 (4) (2004) 23–26. doi:10.1111/j.1747-1567.2004.tb00173.x.
[38] F. Sur, M. Gr´ediac, On noise reduction in strain maps obtained with the grid method by averaging images affected by vibrations, Optics and Lasers in Engi-neering 66 (2015) 210–222.
[39] D. Dang, R. Moutou Pitti, E. Toussaint, M. Gr´ediac, Inverse identification of early and late wood hydric properties using full-field measurements, Wood Material Science & engineering. DOI: 10.1080/17480272.2016.1263973doi:10.1080/17480272.2016.1263973.
[40] E. Toussaint, E. Fournely, R. Moutou Pitti, M. Gr´ediac, Studying the mechani-cal behavior of notched wood beams using full-field measurements, Engineering Structures 113 (2016) 277–286.
[42] H. Schreier, M. Sutton, Systematic errors in digital image correlation due to undermatched subset shape functions, Experimental Mechanics 42 (3) (2002) 303–310.
[43] M. Gr´ediac, F. Sur, Effect of sensor noise on the resolution and spatial resolution of the displacement and strain maps obtained with the grid method, Strain 50 (1) (2014) 1–27.
[44] F. Sur, M. Gr´ediac, Towards deconvolution to enhance the grid method for in-plane strain measurement, Inverse Problems and Imaging 8 (1) (2014) 259–291.
[45] V. Bucur, Initiation and Growth of Delamination in Wood and Wood-Based Composites, a Fracture Mechanics Approach, Springer Netherlands, Dordrecht, (2011), pp. 51–100. doi:10.1007/978-90-481-9550-3 4.
URL https://doi.org/10.1007/978-90-481-9550-3 4
[46] A. Reiter, S. Stanzl-Tschegg, T. EK, Mode I fracture and acoustic emission of softwood and hardwood., Wood Sci Technol 34 (5) (2000) 417–430.
[47] A.P., Schniewind and J.C., Centeno, Fracture toughness and duration of load factor. I. Six principal systems of crack propagation and the duration factor for cracks propagating parallel to grain., Wood Fiber 34 (2) (1973) 152158.
[48] N. A. Phan, S. Morel, M. Chaplain, Mixed-mode fracture in a quasi-brittle material: R-curve and fracture criterion Application to wood, Engineering Fracture Mechanics 156 (Supplement C) (2016) 96 – 113. doi:https://doi.org/10.1016/j.engfracmech.2016.02.006.
URL http://www.sciencedirect.com/science/article/pii/S001379441630008X
[49] H. Yoshihara, Initiation and propagation fracture toughness of solid wood under the mixed Mode I/II condition examined by mixed-mode bend-ing test, Engineering Fracture Mechanics 104 (Complete) (2013) 1–15. doi:10.1016/j.engfracmech.2013.03.023.
[50] M.F.S.F. de Moura and J.M.Q. Oliveira and J.J.L. Morais and J. Xavier, Mixed-mode I/II wood fracture characterization using the mixed-mode bending test, Engineering Fracture Mechanics 77 (1) (2010) 144 – 152.
doi:https://doi.org/10.1016/j.engfracmech.2009.09.014.