HAL Id: hal-01913691
https://hal.sorbonne-universite.fr/hal-01913691
Submitted on 6 Nov 2018
HAL is a multi-disciplinary open access archive for the deposit and dissemination of sci-entific research documents, whether they are pub-lished or not. The documents may come from teaching and research institutions in France or abroad, or from public or private research centers.
L’archive ouverte pluridisciplinaire HAL, est destinée au dépôt et à la diffusion de documents scientifiques de niveau recherche, publiés ou non, émanant des établissements d’enseignement et de recherche français ou étrangers, des laboratoires publics ou privés.
(RAID) score and its measurement equivalence in three
countries: validation study using Rasch Models
Ricardo J.O. Ferreira, Laure Gossec, Cátia Duarte, Joanne Nicklin, Sarah
Hewlett, J.A.P da Silva, Mwidimi Ndosi
To cite this version:
Ricardo J.O. Ferreira, Laure Gossec, Cátia Duarte, Joanne Nicklin, Sarah Hewlett, et al.. The Por-tuguese Rheumatoid Arthritis Impact of Disease (RAID) score and its measurement equivalence in three countries: validation study using Rasch Models. Quality of Life Research, Springer Verlag, 2018, 27 (11), pp.2909 - 2921. �10.1007/s11136-018-1959-4�. �hal-01913691�
https://doi.org/10.1007/s11136-018-1959-4
The Portuguese Rheumatoid Arthritis Impact of Disease (RAID) score
and its measurement equivalence in three countries: validation study
using Rasch Models
Ricardo J. O. Ferreira1,2 · Laure Gossec3,4 · Cátia Duarte1,5 · Joanne K. Nicklin6 · Sarah Hewlett6,7 ·
J. A. P. da Silva1,5 · Mwidimi Ndosi6,7
Accepted: 28 July 2018 / Published online: 1 August 2018 © The Author(s) 2018
Abstract
Purpose The Rheumatoid Arthritis Impact of Disease (RAID) score assesses seven impact domains of interest for people with RA. This study aimed to test patients’ understanding of the Portuguese RAID and evaluate its cross-cultural validity for use in Portugal.
Methods This was a mixed methods study comprising two phases: (i) cognitive debriefing to determine patient’s comprehen-sion of the Portuguese RAID and (ii) cross-cultural validation using Rasch analysis. Construct validity was determined by fit to the model, invariance culture (compared with France and UK datasets) and evidence of convergent and divergent validity.
Results Patients’ input (n = 38) led to minor changes in the phrasing of two items to ensure conceptual equivalence between
the Portuguese and the original RAID. In Rasch analysis (n = 288), two items ‘Sleep’ and ‘Physical well-being’ in the Portuguese dataset did not adequately fit the model specifications, suggesting multidimensionality (sleep—not necessarily associated with RA) and redundancy (physical well-being overlapping with functional disability). Despite the imperfections, the scale had high internal consistency, evidence of convergent and divergent validity and invariance to culture (compared to France n = 195 and UK n = 205 datasets). The scale was well targeted for patients with different levels of disease impact.
Conclusions The RAID has been successfully adapted into Portuguese and it can be used with confidence in clinical prac-tice. Further research will be required to ensure it captures the full range of sleep problems in RA. Meanwhile, data across the three countries (Portugal, France and the UK) are comparable except for the two items (sleep and physical well-being).
Keywords Rheumatoid arthritis · Health-related quality of life · Patient-reported outcome measures · Validation studies · Cross-Cultural comparison · Disease impact
Introduction
Rheumatoid arthritis (RA) is the most common and seri-ous inflammatory arthritis [1]. The clinical presentation of RA is not circumscribed to joint inflammation, its main
Electronic supplementary material The online version of this article (https ://doi.org/10.1007/s1113 6-018-1959-4) contains supplementary material, which is available to authorized users. * Mwidimi Ndosi
mwidimi.ndosi@uwe.ac.uk
1 Rheumatology Department, Centro Hospitalar e
Universitário de Coimbra, Coimbra, Portugal
2 Health Sciences Research Unit: Nursing (UICiSA:E), Escola
Superior de Enfermagem de Coimbra, Coimbra, Portugal
3 Sorbonne Universités, UPMC Univ. Paris 06, Institut Pierre
Louis d’Epidémiologie et de Santé Publique, GRC-UPMC 08, Paris, France
4 Rheumatology Department, AP–HP, Pitié-Salpetrière
Hospital, Paris, France
5 Coimbra Institute for Clinical and Biomedical Research
(iCBR), Faculty of Medicine, University of Coimbra, Coimbra, Portugal
6 Department of Nursing and Midwifery, University
of the West of England, Bristol, UK
7 Academic Rheumatology Unit, University Hospitals Bristol,
characteristic, but having a systemic involvement. Its symp-toms such as pain, fatigue, morning joint stiffness, sleep disturbances, or depression highly affect patient’s quality of life [2, 3]. Because of this, the patient’s perceptions of the impact of the disease are of upmost importance.
Different patient-reported outcomes (PROs) have been developed to assess the patient’s perspective and are included as endpoint for clinical trials [4, 5]. The “Rheu-matoid Arthritis Impact of Disease” (RAID) score is one of these PROs. It was developed in English, through a Euro-pean League Against Rheumatism (EULAR) initiative, aim-ing at combinaim-ing the most important domains for patients in one single measure [6, 7]. Several methodological steps were followed and are detailed elsewhere [6, 7]. Briefly, the first step was to identify important health domains affected by RA through a focus group with ten patients from ten European countries. These domains were then ranked by 96 patients based on their personal experiences and the seven highest-ranked domains were selected (pain, functional dis-ability assessment, fatigue, sleep, physical well-being, emo-tional well-being and coping with disease). The wording and the scaling of the domains resulted in seven numerical rating scales (NRS), from 0 (best status) to 10 (worst status). The relative weights for each domain were then defined based on patient priorities (pain weighs 21%, functional disability 16%, fatigue 15%, and the remaining 12%). Finally, a lon-gitudinal observational study of 570 patients from 12 Euro-pean countries revealed its construct validity, reliability and sensitivity to change [6, 7]. Later studies supported these psychometric properties and acceptability to patients, who also commented on its ease of completion [8–10].
The RAID score has now been used in clinical trials [11], registries [8] and also in national audits [12], both as a global score and for individualized goal setting in clini-cal practice, using its seven items individually instead of its global weighted score [13–16]. This assumes validity and reliability of the global score and of each item of RAID, although the latter had not been established until now. The number of translations of the RAID (over 70 languages) [17] also demonstrates the interest in its use. A Portuguese translation for Portugal and for Brazil was performed by a specialized company (Mapi Institute) in 2012 [17]. How-ever, the Portuguese RAID required further input from patients in Portugal and robust psychometric evaluation of the individual items as well as the global score in order to ensure valid measurements at the individual and group lev-els. In addition, the evidence of measurement comparability (psychometric equivalence) between the Portuguese RAID and the original RAID score needed to be demonstrated in order to allow data-pooling and comparison across coun-tries. Modern psychometric methods such as Rasch analysis allow for detailed evaluation of psychometric properties of a scale, thus validating the adapted version, as well as testing
measurement comparability across scales [18]. The aim of this study was therefore to test patients’ understanding of the Portuguese RAID and evaluate its cross-cultural validity using Rasch analysis.
Participants and methods
Study design
This was a mixed methods study comprising two phases: (1) cognitive debriefing [19] with patients to assess face validity of the existing Portuguese version of RAID and (2) cross-cultural validation of the Portuguese RAID to assess its construct validity, reliability and cross-cultural invariance.
Participants
Consecutive adults with a definite diagnosis of RA [20, 21] attending a rheumatology outpatient department in Portu-gal were included. Patients were excluded only if they were unable to respond to the questionnaires unaided.
In parallel, anonymized datasets of patients with RA from the UK and France [22] were used to test the RAID’s cross-cultural invariance.
Data collection
In Phase 1 (Cognitive debriefing), Portuguese patients with diverse demographic and clinical characteristics were invited to individual interviews or focus groups (with 3–4 patients). The previously translated Portuguese RAID was used; this score is freely available and not copyrighted [17]. Patients were firstly asked to complete the Portuguese RAID unaided; then they were asked to assess possible difficulties and to probe what they thought was meant by each domain with questions such as “What do you think this item means? What
did you think or consider before giving a number/answer to it?”. All interviews were conducted, audio-recorded and
transcribed verbatim by same researcher (RF).
In Phase 2 (validation study), a consecutive sample of patients completed a questionnaire that included the RAID, demographic data (gender, age, educational background), self-reported disease duration and other PROs to enable test-ing the RAID’s convergent and divergent validity: Health Assessment Questionnaire Disability Index (HAQ-DI) [23], Functional Assessment of Chronic Illness Therapy-Fatigue (FACIT) [24], patient global assessment (PGA) of disease activity (0–100 mm visual analogue scale (VAS)) [25], Hos-pital Anxiety and Depression Scale (HADS) [26], quality of life (EQ-5D) [27], Subjective Happiness Scale (SHS) [28], and Ten-Item Personality Inventory (TIPI) [29]. Physician global assessment (PhGA) of disease activity (0–100 mm
VAS) and treatment were retrieved from medical records. Patients were considered as experienced on NRS if they had responded to a scale with NRS format in rheumatology more than once in the last year, otherwise, they were considered not experienced.
Data analysis
Qualitative data from phase 1 were analysed using induc-tive and realistic thematic analysis according to Braun and Clarke [30] guidelines and managed using ATLAS.ti 8, Ber-lin: Scientific Software Development GmbH. Two authors (RF, CD) independently analysed all the transcripts. Team discussions showed that they reached similar conclusions.
In phase 2 of this study, Rasch analysis was used to test whether the Portuguese RAID had retained its psychomet-ric properties following the adaptation process. The Rasch model provides a mathematical framework against which data from questionnaires can be formally assessed to deter-mine how they conform to propreties of fundamental meas-urement [31]. Fit to the model implies construct validity, reliability, unidimensionality and statistical sufficiency of the total score from the scale. Consequently, interval esti-mates can be derived from the scale for use in parametric analyses [32, 33].
The raw scores of each of the seven RAID items were used in all analyses, not the weighted scores. For Rasch analysis, RUMM2030 software (Perth, WA: RUMM Labo-ratory Pty Ltd) was used with Master’s Partial Credit Model parameterization [34]. The software uses pairwise condi-tional maximum likelihood for estimating item parameters. Model fit is tested by Chi-square-based fit statistics com-paring the difference between observed responses and the expected values using standardized residuals (null hypoth-esis being no significant difference between the observed and the values expected by the model). Fit to the model is supported by (i) item-person interaction statistics, expressed as a Z score with a mean of zero (range − 2.5 to 2.5) and standard deviation (SD) of one and (ii) non-significant Chi-square probability. Additionally, an important aspect of measurement, the invariance of the tool to different levels of the construct being measured, is tested by (iii) item-trait Chi-square interaction statistic with a non-significant prob-ability indicating the invariance of the tool, in this case, the invariance of the RAID to different levels of RA impact. A more detailed description of the Rasch analysis approach, its use in rheumatology and the interpretation of fit statistics is given elsewhere [31] .
In addition to the fit statistics, three further tests were con-ducted within the framework of Rasch analysis, to assess the properties of the RAID. These are threshold ordering, unidi-mensionality and invariance of the scale to culture. Each RAID item has 11 response categories, which reflect an ordered
continuum of higher impact of the domain (from 0 to 10). The ‘threshold’ is the point between two adjacent categories, where either response is equally probable [35]. When data fit the Rasch model, thresholds should be correctly ordered and this is tested statistically and presented graphically. Disordered thresholds mean that participants have difficulty to consist-ently discriminate between response categories [31]. Although fit to the model implies that the scale is unidimensional, the principal component analysis and t test-based method, first proposed by Smith [36], were used as a unidimesionality con-firmatory test. For this test, first two sets of items hypothesized to represent low levels and high levels of the trait/construct (disease impact) are defined based on the correlation between items and the first residual factor, then an independent t test is used to compare the difference in these estimates for each person. Unidimensionality is confirmed if ≤ 5% of the t tests are significant or if lower bound of a binomial 95% CI of the observed proportion overlap 5% [36]. Differential item func-tioning (DIF) analysis within RUMM2030 software is based on a two-way analysis of variance (ANOVA) of residuals across each level of person factor (age group, gender, educa-tion background, disease duraeduca-tion, culture) and across different levels of trait (disease impact). The presence of uniform DIF is suggested if the p value of the main effects (person factor e.g. age, culture) is significant. If the p value of the interaction effect (person factor X level of trait) is significant, this sug-gests a non-uniform DIF [37]. The absence of DIF by country implies cross-cultural invariance [22].
To assess the convergent and divergent validity, Pearson’s correlation coefficients between the RAID items and the other measures were calculated and interpreted as good, |r ≥ 0.60|; moderate, |r = 0.40–0.59| and poor |r < 0.40| correlation [38]. The hypotheses tested were that individual items of the RAID score would have (i) good correlation with corresponding measures of physical function, fatigue and psychological distress (i.e. RAID items 2 and 5 with HAQ-DI, RAID item 3 with FACIT, and RAID items 6 with HADS) as well as good correlations of all RAID items and global measures such as health-related quality of life (EQ-5D) and patient global assessment (PGA) of disease activity; and (ii) poor correla-tion with measures of unrelated constructs such as happiness (SHS), personality traits (TIPI) and physician global assess-ment (PhGA).
A p value of 0.05 was considered significant except where a Bonferroni adjustment was applied to account for multiple test-ing i.e. 0.05/number of tests. Misstest-ing data were not imputed. Analyses were conducted using IBM® SPSS® Version 20.0. Armonk, NY: IBM Corp. and RUMM2030 software, Perth, WA: RUMM Laboratory Pty Ltd.
Results
Patient characteristics
In total, 38 patients were included in Phase 1 and 288 in Phase 2. Their demographic and clinical characteristics are summarized in Table 1. Most patients were women, with low education background and with long standing disease duration.
Phase 1: cognitive debriefing
Few issues were raised about understanding of some termi-nologies used in four items (items 3, 4, 5 and 6); however, only two items (item 3 and item 4) were subject to minor changes:
Item 3—“Fatigue. Circle the number that best describes how much fatigue you felt due to your RA during the last week”. Some patients did not know the meaning of “Fadiga” (Fatigue); the term “Cansaço” (tiredness) was known by everyone:
“I understand what fatigue is but tiredness I would have understood better.” (Patient 7)
After discussion, it was agreed to add the second term to the head of the item—“Fadiga/Cansaço”.
Item 4—“Sleep: circle the number that best describes the sleep difficulties (i.e. resting at night) you felt due to your RA during the last week”. In the Portuguese version the term “difficulties” was translated into “distúrbios” (disturbances). For some patients this term was difficult to understand, as it may be understood as “disease/diagnose” or as “difficulty to sleep” and the problem could be “sleep too much”:
“Sometimes I sleep bad because of other problems, related to me, not related to the pain, thank God. (...) Maybe it would be better to use «loss of sleep» or other simpler word [instead of disturbances]...” (Patient 5) “Maybe «changes», although disturbances is under-standable...” (Patient 7), “or «difficulties»...” (Patient 6)
It was agreed to change the term “distúrbios” to “dificul-dades” (difficulties).
Item 5—“Physical well-being: Considering your arthritis overall, how would you rate your level of physical well-being during the past week?”. For most patients to be in a good state of physical well-being (“Bem-estar físico”) was described as: not having pain, followed in terms of fre-quency by being able to walk, and in lesser extent, being able to perform domestic/work tasks and few patients referred to other meanings. Among patients, the concept mean-ing appeared to overlap with item 2 (functional disability assessment/“Avaliação de deficiência funcional”), which assesses the difficulty in doing daily physical activities. The researchers considered this as a conceptual problem rather than a translation issue. Supplementary Table S1 presents patient’s quotes related to the four items.
Beyond the terminologies used in the four items, the anchors of the NRS were also discussed because at least two patients assumed that ten correspond to better health condi-tion, disregarding what was written in the NRS’s anchors. One patient made an analogy with the grades of a school’s test:
“Yes, it is like the grades: 5 is nothing but 10 is already a good mark. Because of that people may think that 10 is good.” (Patient 15).
Since this was a major change, without enough support, no changes were done to these anchors.
Phase 2: cross‑cultural validation
FIT to the model
Table 2 presents item fit statistics for each country and for the pooled data. Table 3 presents item-person fit statistics, person separation reliability and unidimensionality of the RAID. Two items (sleep and physical well-being) had fit residual values outside the acceptable (− 2.5 to 2.5) range;
Table 1 Characteristics of patients included in the Portuguese dataset
bDMARD biological disease-modifying antirheumatic drugs, DAS28(CRP)4v Disease activity assessment using 28-joint counts, C-reactive protein and four variables, HAQ-DI Health Assessment
Questionnaire Disability Index, na not assessed, NRS Numeric Rating Scale, PGA Patient Global Assessment, SD standard deviation
a Missing data in 6 (2.1%) patients
Variable Phase 1 (n = 38) Phase 2 (n = 288) Gender (female) [n (%)] 32 (84.2) 236 (81.9) Age [years, mean (SD)] 58.6 (10.4) 59.8 (12.4) Education background [n (%)]
≤ 4 years 22 (57.9) 139 (48.3)
5–9 years 4 (10.5) 66 (22.9)
10–12 years 7 (18.4) 49 (17.0)
> 12 years 5 (13.2) 34 (11.8)
Disease duration [years, mean
(SD)] 15.7 (11.3) 11.8 (8.9)
Treated with bDAMRDS [n
(%)] 25 (65.8) 87 (30.2) DAS28(CRP)4v [mean (SD)] na 2.9 (1.0) Experienced with NRS [n (%)] 26 (68.4) 149 (51.7) HAQ-DI remission (≤ 0.5) [n (%)]a na 77 (27.3) PGA (0–100) [mean (SD)] na 44.5 (26.8)
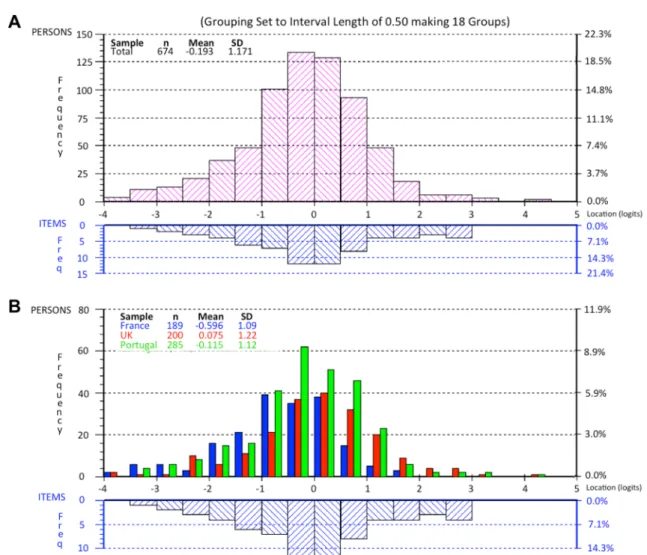
Table 2 Item fit statistics for each country dataset and the pooled data
Country RAID Item Location SE Fit residuala DF X2 p valueb
A: Fit statistics for the original 7-item structure
Portugal (n = 288) Pain − 0.072 0.045 0.622 5 2.506 0.776 Functional disability − 0.162 0.044 − 1.464 5 2.300 0.806 Fatigue − 0.188 0.043 0.211 5 2.638 0.756 Sleep 0.265 0.041 4.218 5 15.840 0.007 Physical WB − 0.202 0.046 − 4.239 5 14.213 0.014 Emotional WB 0.058 0.043 − 0.120 5 2.074 0.839 Coping 0.300 0.043 − 0.154 5 0.931 0.968 UK (n = 205) Pain − 0.018 0.049 − 0.456 3 2.245 0.523 Functional disability 0.041 0.048 − 0.848 3 1.936 0.586 Fatigue − 0.358 0.049 1.986 3 6.374 0.095 Sleep 0.074 0.042 2.298 3 2.753 0.431 Physical WB − 0.138 0.051 − 2.316 3 5.325 0.149 Emotional WB 0.044 0.047 1.483 3 6.003 0.111 Coping 0.354 0.049 − 0.583 3 2.295 0.513 France (n = 195) Pain 0.071 0.051 0.126 3 0.387 0.943 Functional disability 0.312 0.051 − 1.856 3 5.280 0.152 Fatigue − 0.348 0.048 − 0.053 3 1.529 0.676 Sleep 0.123 0.045 4.030 3 11.879 0.008 Physical WB − 0.306 0.052 − 1.452 3 3.850 0.278 Emotional WB − 0.058 0.049 1.280 3 1.032 0.793 Coping 0.206 0.051 − 0.741 3 1.731 0.630 Pooled (n = 688) Pain − 0.022 0.028 − 0.341 9 4.393 0.8837 Functional disability − 0.003 0.027 − 2.747 9 11.875 0.2205 Fatigue − 0.274 0.027 1.121 9 9.124 0.4259 Sleep 0.161 0.024 6.000 9 26.725 0.0016 Physical WB − 0.193 0.028 − 4.912 9 27.081 0.0014 Emotional WB 0.032 0.027 1.520 9 10.735 0.2943 Coping 0.300 0.027 − 1.079 9 4.943 0.8392
Expected values for perfect fit Within ± 2.5 > 0.0071
B: Fit statistics after combining functional disability and physical well-being—6-item structure
Portugal (n = 288) Pain − 0.091 0.043 0.101 233.670 2.779 0.734 Funct. Dis./Phys.WB − 0.204 0.030 − 3.680 233.670 5.365 0.373 Fatigue − 0.205 0.042 − 0.263 233.670 2.902 0.715 Sleep 0.222 0.039 3.552 233.670 10.222 0.069 – Emotional WB 0.027 0.042 − 0.536 233.670 2.768 0.736 Coping 0.251 0.041 − 0.559 233.670 1.432 0.921 UK (n = 205) Pain − 0.024 0.048 − 0.675 162.83 2.529 0.470 Funct. dis./phys. WB − 0.058 0.033 − 2.770 162.83 1.130 0.770 Fatigue − 0.341 0.048 1.713 162.83 5.853 0.119 Sleep 0.064 0.041 1.928 162.83 1.384 0.709 – Emotional WB 0.031 0.046 1.196 162.83 5.467 0.141 Coping 0.328 0.047 − 0.764 162.83 2.766 0.429
Sleep fit residual = 4.218, p = 0.007, suggesting that this item may be measuring a slightly different dimension and Physical well-being fit residual = − 4.239, p = 0.014, sug-gesting redundancy of this item (corroborates the findings of our qualitative study—patient interpretation of physical well-being overlapped with functional disability). To test
the extent to which lack of fit was caused by this redundancy an attempt was made to combine the Functional disability and Physical well-being items into a testlet to address the local dependence (Table 2b). This resulted in better fit sta-tistics for both items (Functional disability/Physical well-being fit residuals − 3.680, p = 0.373, and sleep fit residual
DF Degree of Freedom, WB Well-being, RAID Rheumatoid Arthritis Disease Impact
a Large positive values suggest multidimensionality and large negative values suggests local response dependence (item redundancy)
b Bonferroni adjusted p value for model fit (i.e. 0.05/7 tests = 0.0071 and 005/6 tests = 0.0083); Figures in bold represent values bellow adjusted p
value threshold, indicating misfit of the item to the model
Table 2 (continued)
Country RAID Item Location SE Fit residuala DF X2 p valueb
France (n = 195) Pain 0.077 0.050 0.003 153.67 0.410 0.938 Funct. dis./phys. WB − 0.016 0.035 − 4.556 153.67 6.770 0.080 Fatigue − 0.327 0.047 − 0.186 153.67 1.412 0.703 Sleep 0.127 0.044 3.742 153.67 9.773 0.021 – Emotional WB − 0.055 0.048 1.144 153.67 0.837 0.840 Coping 0.194 0.050 − 0.822 153.67 1.878 0.598 Pooled (n = 688) Pain − 0.033 0.027 − 0.812 557.83 5.114 0.824 Funct. dis./phys.WB − 0.117 0.019 − 6.655 557.83 17.664 0.039 Fatigue − 0.272 0.026 0.634 557.83 9.237 0.416 Sleep 0.14 0.024 5.249 557.83 18.287 0.032 – Emotional WB 0.014 0.026 1.005 557.83 9.678 0.377 Coping 0.268 0.026 − 1.456 557.83 6.057 0.734
Expected values for perfect fit Within ± 2.5 > 0.0083
Table 3 Summary item-person fit statistics for each country-specific and the pooled datasets
CI confidence interval, DF degrees of freedom, SD standard deviation
a p value > 0.05 for model fit
b PSI Person separation index (internal consistence) value > 0.70 is acceptable for group use and > 0.85 for individual use
c Unidimensionality is supported if ≤ 5% (0.05) of independent t tests are significant or if lower-bound of a binomial 95% CI of the observed
pro-portion overlap 5% (0.05)
Country Item fit residual Person fit
residual Item-trait–Chi-square interaction Person separation reliability (PSI)b Proportion of independent t tests (binomial 95% CI)c
Mean SD Mean SD Value (DF) p valuea
A: Item-person fit statistics of the scale in original structure (7 items)
Portugal (n = 288) − 0.132 2.525 − 0.674 1.601 40.501 (35) 0.240 0.940 0.070 (0.045–0.095) UK (n = 205) 0.223 1.718 − 0.441 1.372 40.501 (35) 0.173 0.932 0.085 (0.055–0.115) France (n = 195) 0.191 1.989 − 0.712 1.571 25.690 (21) 0.219 0.914 0.090 (0.059–0.121) Pooled (n = 688) − 0.063 3.476 − 0.652 1.551 94.876 (63) 0.006 0.932 0.072 (0.056–0.089) B: Item-person fit statistics of the scale with combined Functional Disability and Physical well-being (6-items)
Portugal (n = 288) − 0.231 2.303 − 0.660 1.484 25.468 (30) 0.702 0.934 0.063 (0.038–0.088) UK (n = 205) 0.105 1.829 − 0.440 1.277 19.130 (18) 0.384 0.927 0.060 (0.030–0.090) France (n = 195) − 0.113 2.709 − 0.672 1.431 21.080 (18) 0.275 0.910 0.074 (0.043–0.105) Pooled (n = 688) − 0.339 3.882 − 0.632 1.435 66.037 (54) 0.126 0.928 0.067 (0.050–0.083) Expected values for perfect fit 0 1 0 1 > 0.05 > 0.85b Lower bound CI < 0.05
3.552, p = 0.069). The item-trait Chi-square probabilities in each country data were also non-significant but the item fit residual for Portugal dataset remained higher (SD = 2.303) than expected (SD = 1) (Table 3b). This suggests that local dependency was not the only cause for lack of fit.
Threshold ordering and targeting
The thresholds for all seven items were ordered, suggest-ing that the proposed NRS response structure was work-ing as intended (Fig. 1). This is also shown in the category
probability curves (Fig. 2). The scale was well targeted for patients with different severity levels of RA impact (Fig. 3).
Unidimensionality and internal consistency
The reliability of Portuguese RAID was excellent (PSI = 0.940) and the strict unidimensionality test revealed the proportion of significant t tests to be 0.070 (95% CI 0.045–0.095), supporting the unidimensionality of the scale (Table 3).
Fig. 1 Threshold map for Portuguese RAID. The items are in ranked order of difficulty according to Rasch model (n = 288). RAID items were answered in a numerical rating scale from 0 to 10, values repre-sented here as response categories from 1 to 11. It would be expected
that as the person’s disease impact increases, they would be more likely to obtain a higher score and that this would increase systemati-cally in a logical progression
Fig. 2 Category probability curve for item 1 (Pain) of Portuguese RAID (n = 288). The x-axis represents the construct, with the pain increasing to the right. The y-axis shows the probability of scoring
the categories: Each of the 11 categories emerged as the most likely to be selected at some point upon the underlying pain scale, showing logical progressive order
Invariance
There was no DIF by country on any of the RAID items; therefore, cross-cultural validity of the RAID is supported (Table 4). Furthermore, the scale was invariant to age, gen-der, education background, disease duration and functional capacity.
Convergent validity
As hypothesized, the correlation of RAID items with other PROs (Table 5) was good (r ≥ 0.60), namely between HAQ-DI and “RAID Functional disability” and “RAID Physical well-being” (r = 0.66 and r = 0.67, respectively),
FACIT and “RAID Fatigue” (r = − 0.65) [also good corre-lations with “RAID Physical well-being” and “RAID emo-tional well-being”, r = − 0.60 for both], HADS depres-sion and “RAID emotional well-being” (r = 0.61), and between PGA and between EQ-5D with all RAID items, except with “RAID sleep” which had moderate correla-tions (r = 0.57 and r = − 0.52, respectively). The remain-ing correlations between RAID items and the other PROs were moderate (0.40 ≤ r < 0.60), as expected.
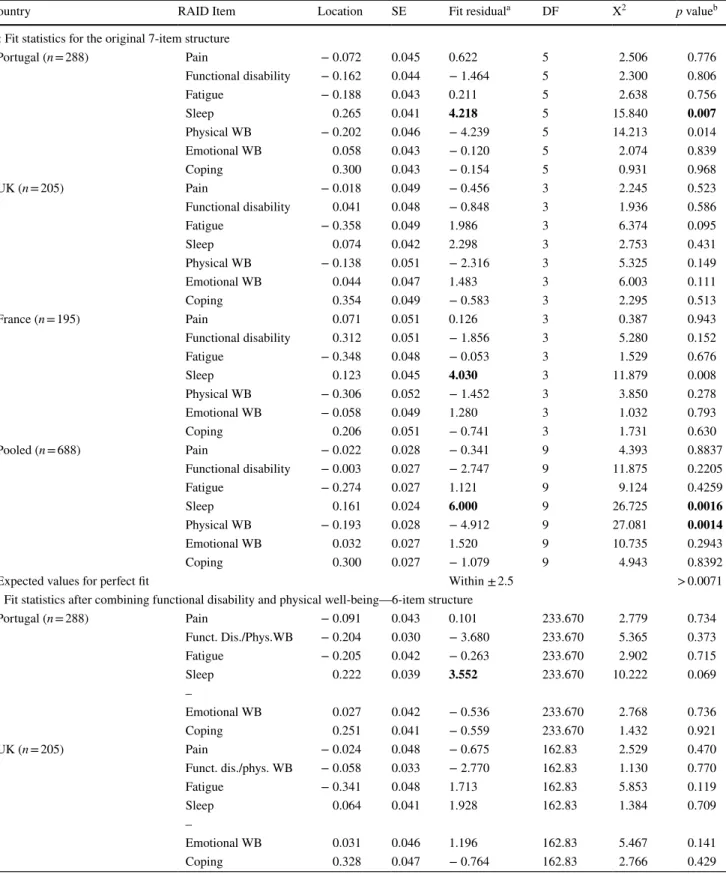
Fig. 3 Person-item threshold distribution for the 7 items of the Rheu-matoid Arthritis Impact of Disease (RAID) score. These graphs pre-sent the distribution of items: the x-axis is the logit score and repre-sents the interval scaling of the items according to the Rasch model, with − 4 being no impact and 5 being high impact of disease. The lower part of each histogram is where individual items are located along the scale; the top part of histogram represents the number of
people and their total RAID logit score. a Represents the pooled anal-ysis of all patients, showing very good fit between person and items.
b. Represents the persons divided by the three countries, also with
very good fit. French patients have more impact of the disease as the central part of the distributions goes more into the left than the other two countries. In both diagrams the extremes (n = 14) were omitted
Divergent validity
The correlations of RAID items with PhGA, with happiness (SHS) and with Personality traits (TIPI) were, as expected, poor (r < 0.40) or not statistically significant (Table 5).
Discussion
This study aimed to incorporate patient perspective in the adaptation of the Portuguese RAID, an impact questionnaire for RA, and to validate it for use in Portugal using modern statistical approaches.
The Portuguese version of the RAID, as well as many of its translations to other languages, was carried out by Mapi Institute, an organization specialized in PROs research.
However, the Portuguese RAID required further input from a wider group of patients before the statistical evaluation of the underlying construct was carried out [19]. Our qualita-tive study (phase I) added more patients’ perspecqualita-tive into the Portuguese RAID, making it more meaningful to them. As a result, minor changes were performed in Fatigue and Sleep items to ensure that patients understand the concepts intended by the items and thus give accurate responses.
The cognitive debriefing also revealed that some patients may not read the item anchors which might led them to inter-pret 10 as good when it means bad. This misunderstanding has also been found in other studies regarding VAS inter-pretation by patients with chronic conditions [39–41]. This problem might have been resolved by adding smiley faces at the extremes like in pain assessment for children or elderly persons, but it would have been a major change to the tool
Table 4 Cross-cultural DIF of the RAID items by age and by country
WB Well-Being
a Categorized as < 60 years and ≥ 60 years old
b Bonferroni adjusted p value for model fit: 0.05/7 tests = 0.0071
Dataset RAID domain Agea Country
Mean square F (DF) p valueb Mean square F (DF) p valueb
Portugal (n = 288) Pain 0.05 0.06 (1) 0.81 Not applicable
Functional disability 0.37 0.49 (1) 0.48 Fatigue 0.01 0.01 (1) 0.93 Sleep 0.45 0.34 (1) 0.56 Physical WB 0.13 0.24 (1) 0.62 Emotional WB 1.90 2.29 (1) 0.13 Coping 2.11 2.55 (1) 0.11
UK (n = 205) Pain 0.50 0.62 (1) 0.43 Not applicable
Functional disability 0.63 0.81 (1) 0.37 Fatigue 1.43 1.32 (1) 0.25 Sleep 0.14 0.12 (1) 0.73 Physical WB 0.12 0.19 (1) 0.66 Emotional WB 0.19 0.19 (1) 0.66 Coping 3.78 4.85 (1) 0.03
France (n = 195) Pain 1.30 1.52 (1) 0.22 Not applicable
Functional disability 3.32 5.53 (1) 0.02 Fatigue 1.40 1.64 (1) 0.20 Sleep 0.00 0.00 (1) 0.96 Physical WB 0.02 0.03 (1) 0.87 Emotional WB 4.70 4.93 (1) 0.03 Coping 0.21 0.28 (1) 0.60 Pooled (n = 688) Pain 0.07 0.09 (1) 0.770 0.90 1.07 (2) 0.343 Functional disability 4.70 6.66 (1) 0.010 2.90 4.21 (2) 0.015 Fatigue 1.64 1.80 (1) 0.180 3.85 4.22 (2) 0.015 Sleep 2.26 1.72 (1) 0.190 1.25 0.98 (2) 0.376 Physical WB 0.02 0.03 (1) 0.966 1.19 0.32 (2) 0.727 Emotional WB 3.15 3.37 (1) 0.067 0.21 0.23 (2) 0.797 Coping 8.35 10.55 (1) 0.001 1.11 1.41 (2) 0.246
that is already established. Providing a brief explanation about the anchors of the scale may therefore be important especially for first time users or for those patients with low literacy or low educational level [39, 42].
The results of Rasch analysis highlighted two issues (i) redundancy of Physical well-being (overlapping with func-tional disability) and (ii) the possibility that Sleep item measures a slightly different dimension. These issues were not observed in the UK dataset (the original RAID was developed in English) suggesting that the problem may not be inherent to RAID itself but reflecting imperfections of the cross-cultural adaptations. Addressing the redundancy by combining the two locally dependent items (physical well-being and functional disability) improved the scale per-formance, including fit residuals for the sleep item. Future developments need to address the phrasing of physical well-being to avoid confusion with functional disability. As sleep item still displayed higher SD than expected by Rasch model, the improvement (seen by combining functional dis-ability and physical well-being) was not sufficient enough to justify changing the RAID structure into a 6-item ques-tionnaire, although this presented a better fit to the model. Dimensionality of the sleep item needs further explora-tion. Sleep problems include difficulties in initiating sleep,
maintaining sleep, early awakening and non-restorative sleep [43]. Given the broad range of sleep problems, it is possible that some patients do not necessarily associate them with RA impact: “Sometimes I sleep bad because of other
prob-lems”, a patient said. A qualitative study of the Dutch RAID
found that sleep was hardly mentioned in the focus groups with patients [44]. It may be helpful to investigate whether conceptual equivalence issues exist in the Portuguese trans-lation and/or adding explanation to the item to help patients associate sleep problems with RA impact.
Despite lack of adequate fit to the Rasch model, construct validity of the Portuguese RAID is supported by (i) high internal consistency (PSI > 0.85) suggesting enough reli-ability for use at the individual level (ii) good targeting for patients with different levels of disease impact (iii) good correlations (convergent validity) between RAID items and other tools measuring the same concepts i.e. HAQ-DI, FACIT, HADS, EQ-5D, PGA; and (iv) poor correlations (divergent validity) between RAID items and tools measur-ing different concepts i.e. PhGA, happiness and personality traits. The first study to test RAID performance in clini-cal practice (N = 1086) was conducted in Norway,[8] and used weighted RAID global score and showed good cor-relation with PGA, Rheumatoid Arthritis Disease Activity
Table 5 Pearson’s correlations between the RAID (transformed scores) and other outcomes in the Portuguese dataset (n = 288) to demonstrate criterion-related validity
Values represent: r (p value)
EQ-5D EuroQol-5D, FACIT Functional Assessment of Chronic Illness Therapy-Fatigue, HADS Hospital Anxiety and Depression Scale, HAQ-DI Health Assessment Questionnaire Disability Index, PGA Patient Global Assessment, PhGA Physician Global Assessment, RAID Rheumatoid
Arthritis Disease Impact, SHS Subjective Happiness Scale, TIPI Ten Item Personality Inventory, WB Well-Being
a Correlations were categorized as moderate if 0.40 ≤ r < 0.60 [38] b Correlations were categorized as good if r ≥ 0.60 [38]
Other measures Pain Functional
dis-ability Fatigue Sleep Physical WB Emotional WB Coping
With expected good correlations (convergent validity)
HAQ-DI 0.56a (< 0.001) 0.66b (< 0.001) 0.61b (< 0.001) 0.58a (< 0.001) 0.67b (< 0.001) 0.59a (< 0.001) 0.61b (< 0.001) FACIT − 0.50a (< 0.001) − 0.51a (< 0.001) − 0.65b (< 0.001) − 0.55a (< 0.001) − 0.60b (< 0.001) − 0.60b (< 0.001) − 0.58a (< 0.001) HADS—anxiety 0.42a (< 0.001) 0.45a (< 0.001) 0.51a (< 0.001) 0.49a (< 0.001) 0.51a (< 0.001) 0.54a (< 0.001) 0.50a (< 0.001) HADS—depres-sion 0.47 a (< 0.001) 0.53a (< 0.001) 0.54a (< 0.001) 0.50a (< 0.001) 0.55a (< 0.001) 0.61b (< 0.001) 0.59a(< 0.001) EQ-5D − 0.61b (< 0.001) − 0.69b (< 0.001) − 0.66b (< 0.001) − 0.52a (< 0.001) − 0.71b (< 0.001) − 0.64b (< 0.001) − 0.62b (< 0.001) PGA 0.65b (< 0.001) 0.69b (< 0.001) 0.66b (< 0.001) 0.57a (< 0.001) 0.70b (< 0.001) 0.64b (< 0.001) 0.69b (< 0.001) Without expected good correlations (divergent validity)
PhGA 0.18 (0.002) 0.17 (0.004) 0.13 (0.029) 0.11 (0.051) -0.04 (0.527) 0.16 (0.007) 0.12 (0.042) SHS − 0.26 (< 0.001) − 0.24 (< 0.001) − 0.32 (< 0.001) − 0.30 (< 0.001) − 0.31 (< 0.001) − 0.38 (< 0.001) − 0.37 (< 0.001) TIPI—extraversion − 0.21 (0.001) − 0.23 (< 0.001) − 0.24 (< 0.001) − 0.23 (< 0.001) − 0.22 (< 0.001) − 0.22 (< 0.001) − 0.22 (< 0.001) TIPI—agreeable-ness 0.00 (0.978) − 0.02 (0.724) − 0.51 (0.396) − 0.05 (0.428) − 0.04 (0.527) − 0.09 (0.120) − 0.11 (0.070) TIPI—conscien-tiousness − 0.00 (0.910) − 0.09 (0.125) − 0.09 (0.129) − 0.11 (0.070) − 0.09 (0.144) − 0.14 (0.020) − 0.11 (0.065) TIPI—emotional stability − 0.21 (< 0.001) − 0.27 (< 0.001) − 0.26(< 0.001) − 0.25 (< 0.001) − 0.32 (< 0.001) − 0.32 (< 0.001) − 0.26 (< 0.001) TIPI—openness to experiences − 0.11 (0.064) − 0.14 (0.017) − 0.20 (0.001) − 0.09 (0.144) − 0.20 (0.001) − 0.17 (0.004) − 0.21 (< 0.001)
Index (RADAI), Short-Form (SF)-36 general health, SF-6D and EQ-5D (rp was 0.82, 0.82, − 0.66, − 0.77 and − 0.73,
respectively) [8]. In our study of convergent validity look-ing at individual RAID items, only the Sleep item showed a moderate correlation with global measures of health (PGA
rp = 57, and EQ5D rp = − 0.52), the rest of items had good
correlations. Indeed, in the above-mentioned Norwegian study [8] the weighted RAID global score also had a moder-ate correlation (rp = 0.59) with the Sleep Medical Outcome Study (MOS) subscale. It should be noted that specific sleep measures have been shown to have higher correlations with the individual RAID item measuring sleep (rp = 0.73–0.78) [45]. Our study did not use specific sleep measures hence the modest correlations.
This study has three limitations. First, lack of adequate fit to Rasch model observed in the Sleep and Physical Well-being items in the Portugal datasets meant that we could not calibrate a stable interval scale from our data (statisti-cal sufficiency of the total score and interval-level s(statisti-caling depends on adequate fit to the model) [31]. New datasets will therefore need to be tested for fit if an interval-level scale is desired. The lack of fit may be related to either un-resolved conceptual equivalence issues in the translation (explained above) or the restrictive nature of Rasch model. Rasch model specifies that all items contributing to the scale have uniform discrimination—i.e. all items have parallel item characteris-tic curves. The model detects even minor variations in items discrimination across different levels of RA impact. It would be useful in future studies to assess the performance the RAID using other item response models (2-parameter logis-tic or 3-parameter logislogis-tic models) which can accommodate a degree of variation in item discrimination [46]. However, fit to these alternative models imply less precise interval scale estimates than those derived from Rasch model. It may as well be useful to explore how well the RAID works as an ordinal measure of disease impact using non-parametric item response models such as Mokken scaling [47]. Second, the Portuguese dataset was compared with only two coun-tries, France and the UK. While our data have demonstrated comparability of measures across the three countries, the evidence supporting cross-cultural equivalence would have been stronger if fit to Rasch model was adequate. We there-fore downgrade our conclusions to apply to the fitting items only (excluding physical well-being and sleep). Further research will be required to assess measurement equivalence of the Portuguese RAID and other adapted versions data are compared. Lastly, it is important to note that all our analy-ses were based on unweighted RAID scores as completed by patients. The RAID scoring involves applying different weights to different items to obtain clinically meaningful measures [6, 7].
The strengths of this study include the following: the recruitment of enough Portuguese patients in both phases,
with good diversity, including patients who are not used to completing NRS. The use of Rasch model in our analysis enabled a robust assessment of psychometric properties of the RAID including different aspects of construct validity and response bias, although this may also mean a highly strict criteria for measurement validity above that required for clinical use. Availability of datasets from the UK and France allowed assessment psychometric equivalence between the Portuguese RAID, the original RAID and the French version.
Beyond research, this study has important clinical impli-cations. As RAID is a valid measure of the impact of disease in RA, without which many PROs would be required, this study provides Portuguese patients with a measure that is meaningful to them. It will help clinicians and other health professionals assess how RA impacts on patients. Also, the RAID has been incorporated into the Portuguese National Registry [48] which will help inform the impact of RA at the population level and provide data for further research.
In conclusion, cross-cultural adaptation and validation of the RAID score into Portuguese for Portugal has been achieved using cognitive debriefing and Rasch models. Although further research will be required to address issues observed in the Sleep and Physical well-being items, the Portuguese RAID has enough construct validity and reli-ability for clinical use at individual patient and group level.
Acknowledgements The authors would like to thank the following people for their contribution in data collection: Cristiana Silva, Gisela Eugénio, Jorge Silva, Maria João Salvador, Sara Serra, Margarida Coutinho, João Rovisco, Mariana Santiago, Armando Malcata, Luís Sousa Inês, Carlos Costa, Diogo Jesus, Pedro Carvalho, Marília Rod-rigues, Tânia Santiago (Coimbra). The authors also wish to thank the investigators from the France and the UK study for supplying us with the anonymized datasets.
Compliance with ethical standards
Conflict of interest All authors declare that they have no conflicts of interest.
Ethical approval Ethical approval for this study was obtained from Centro Hospitalar e Universitário de Coimbra (CHUC-093-16) and from University of Coimbra’s Faculty of Medicine (CE-037/2015) eth-ics committees. The UK and France datasets had ethical approvals from respective countries [22].
Informed consent All patients signed an informed consent form.
Research involving human participants All procedures performed in studies involving human participants were in accordance with the ethi-cal standards of the institutional and/or national research committee and with the 1964 Helsinki declaration and its later amendments or comparable ethical standards.
Open Access This article is distributed under the terms of the Crea-tive Commons Attribution 4.0 International License (http://creat iveco mmons .org/licen ses/by/4.0/), which permits unrestricted use,
distribution, and reproduction in any medium, provided you give appro-priate credit to the original author(s) and the source, provide a link to the Creative Commons license, and indicate if changes were made.
References
1. Nam, J. L., Catrina, A. I., & Emery, P. (2015). Early arthritis. In J. W. J. Bijlsma & E. Hachula (Eds.), Textbook on rheumatic
diseases (2nd edn., pp. 205–228). London: BMJ Publishing Group
Ltd.
2. Taylor, P. C., Moore, A., Vasilescu, R., Alvir, J., & Tarallo, M. (2016). A structured literature review of the burden of illness and unmet needs in patients with rheumatoid arthritis: A current per-spective. Rheumatology International, 36(5), 685–695. https :// doi.org/10.1007/s0029 6-015-3415-x.
3. Cutolo, M., Kitas, G. D., & van Riel, P. L. (2014). Burden of disease in treated rheumatoid arthritis patients: Going beyond the joint. Seminars in Arthritis and Rheumatism, 43(4), 479–488.
https ://doi.org/10.1016/j.semar thrit .2013.08.004.
4. Kalyoncu, U., Dougados, M., Daures, J. P., & Gossec, L. (2009). Reporting of patient-reported outcomes in recent trials in rheu-matoid arthritis: A systematic literature review. Annals of the
Rheumatic Diseases, 68(2), 183–190. https ://doi.org/10.1136/ ard.2007.08484 8.
5. Gossec, L., Dougados, M., & Dixon, W. (2015). Patient-reported outcomes as end points in clinical trials in rheumatoid arthri-tis. RMD Open, 1(1), e000019. https ://doi.org/10.1136/rmdop en-2014-00001 9.
6. Gossec, L., Dougados, M., Rincheval, N., Balanescu, A., Boumpas, D. T., Canadelo, S., et al. (2009). Elaboration of the preliminary Rheumatoid Arthritis Impact of Disease (RAID) score: A EULAR initiative. Annals of the Rheumatic Diseases,
68(11), 1680–1685. https ://doi.org/10.1136/ard.2008.10027 1. 7. Gossec, L., Paternotte, S., Aanerud, G. J., Balanescu, A.,
Boumpas, D. T., Carmona, L., et al. (2011). Finalisation and validation of the rheumatoid arthritis impact of disease score, a patient-derived composite measure of impact of rheumatoid arthritis: A EULAR initiative. Annals of the Rheumatic Diseases,
70(6), 935–942. https ://doi.org/10.1136/ard.2010.14290 1. 8. Heiberg, T., Austad, C., Kvien, T. K., & Uhlig, T. (2011).
Per-formance of the Rheumatoid Arthritis Impact of Disease (RAID) score in relation to other patient-reported outcomes in a register of patients with rheumatoid arthritis. Annals of the Rheumatic
Dis-eases, 70(6), 1080–1082. https ://doi.org/10.1136/ard.2010.14303 2.
9. Salaffi, F., Di Carlo, M., Vojinovic, J., Tincani, A., Sulli, A., Soldano, S., et al. (2017). Validity of the Rheumatoid Arthritis Impact of Disease (RAID) score and definition of cut-off points for disease activity states in a population-based European cohort of patients with rheumatoid arthritis. Joint, Bone, Spine. https :// doi.org/10.1016/j.jbspi n.2017.05.020.
10. Dougados, M., Brault, Y., Logeart, I., van der Heijde, D., Gossec, L., & Kvien, T. (2012). Defining cut-off values for disease activ-ity states and improvement scores for patient-reported outcomes: The example of the Rheumatoid Arthritis Impact of Disease (RAID). Arthritis Research and Therapy, 14(3), R129. https :// doi.org/10.1186/ar385 9.
11. Strand, V., Reaney, M., Chen, C. I., Proudfoot, C. W., Guillon-neau, S., Bauer, D., et al. (2017). Sarilumab improves patient-reported outcomes in rheumatoid arthritis patients with inadequate response/intolerance to tumour necrosis factor inhibitors. RMD
Open, 3(1), e000416. https ://doi.org/10.1136/rmdop en-2016-00041 6.
12. Ledingham, J. M., Snowden, N., Rivett, A., Galloway, J., Ide, Z., Firth, J., et al. (2017). Patient- and clinician-reported outcomes for patients with new presentation of inflammatory arthritis: Observa-tions from the National Clinical Audit for Rheumatoid and Early Inflammatory Arthritis. Rheumatology, 56(2), 231–238. https :// doi.org/10.1093/rheum atolo gy/kew30 9.
13. Ferreira, R. J. O., Dougados, M., Kirwan, J., Duarte, C., de Wit, M., Soubrier, M., et al. (2017). Drivers of patient global assessment in patients with rheumatoid arthritis who are close to remission: An analysis of 1588 patients. Rheumatology, 56(9), 1573–1578. https ://doi.org/10.1093/rheum atolo gy/kex21 1. 14. Boers, M. (2011). RAID: A valid tool to quantify the impact of
rheumatoid arthritis. But what impact will it have on the core set for trials? Annals of the Rheumatic Diseases, 70(6), 884–885.
https ://doi.org/10.1136/ard.2010.14537 5.
15. Gullick, N. J., & Scott, D. L. (2011). Rheumatoid arthritis: Clini-cal utility of the RAID (RA impact of disease) score. Nature
Reviews Rheumatology, 7(9), 499–500.
16. Ferreira, R. J. O., Duarte, C., Ndosi, M., de Wit, M., Gossec, L., & da Silva, J. A. P. (2018). Suppressing inflammation in rheu-matoid arthritis: Does patient global assessment blur the target? A practice–based call for a paradigm change. Arthritis Care and
Research, 70(3), 369–378. https ://doi.org/10.1002/acr.23284 . 17. EULAR (2011). EULAR RAID and PsAID Score. Retrieved 26
November, 2016 from https ://www.eular .org/tools _produ cts_.cfm. 18. Tennant, A., Penta, M., Tesio, L., Grimby, G., Thonnard, J. L.,
Slade, A., et al. (2004). Assessing and adjusting for cross-cultural validity of impairment and activity limitation scales through dif-ferential item functioning within the framework of the Rasch model: The PRO-ESOR project. Medical Care, 42(1 Suppl), I37–48. https ://doi.org/10.1097/01.mlr.00001 03529 .63132 .77. 19. Hewlett, S., Nicklin, J., Bode, C., Carmona, L., Dures, E.,
Engel-brecht, M., et al. (2016). Translating patient reported outcome measures: Methodological issues explored using cognitive inter-viewing with three rheumatoid arthritis measures in six Euro-pean languages. Rheumatology, 55(6), 1009–1016. https ://doi. org/10.1093/rheum atolo gy/kew01 1.
20. Arnett, F. C., Edworthy, S. M., Bloch, D. A., McShane, D. J., Fries, J. F., Cooper, N. S., et al. (1988). The American Rheuma-tism Association 1987 revised criteria for the classification of rheumatoid arthritis. Arthritis and Rheumatism, 31(3), 315–324. 21. Aletaha, D., Neogi, T., Silman, A. J., Funovits, J., Felson, D.
T., Bingham, C. O. 3rd, et al (2010). 2010 rheumatoid arthritis classification criteria: An American College of Rheumatology/ European League against rheumatism collaborative initiative.
Annals of the Rheumatic Diseases, 69(9), 1580–1588. https ://doi. org/10.1136/ard.2010.13846 1.
22. Hewlett, S., Kirwan, J., Bode, C., Cramp, F., Carmona, L., Dures, E., et al. (2018). The revised bristol rheumatoid arthritis fatigue measures and the Rheumatoid arthritis impact of Disease scale: Validation in six countries. Rheumatology, 57(2), 300–308. https ://doi.org/10.1093/rheum atolo gy/kex37 0.
23. Fries, J. F., Spitz, P., Kraines, R. G., & Holman, H. R. (1980). Measurement of patient outcome in arthritis. Arthritis and
Rheu-matism, 23(2), 137–145.
24. Cella, D., Yount, S., Sorensen, M., Chartash, E., Sengupta, N., & Grober, J. (2005). Validation of the functional assessment of chronic illness therapy fatigue scale relative to other instrumenta-tion in patients with rheumatoid arthritis. Journal of
Rheumatol-ogy, 32(5), 811–819.
25. Felson, D. T., Smolen, J. S., Wells, G., Zhang, B., van Tuyl, L. H., Funovits, J., et al. (2011). American College of Rheumatol-ogy/European League against Rheumatism provisional definition of remission in rheumatoid arthritis for clinical trials. Annals of
the Rheumatic Diseases, 70(3), 404–413. https ://doi.org/10.1136/ ard.2011.14976 5.
26. Zigmond, A. S., & Snaith, R. P. (1983). The hospital anxiety and depression scale. Acta Psychiatrica Scandinavica, 67(6), 361–370.
27. Ferreira, L. N., Ferreira, P. L., Pereira, L. N., & Oppe, M. (2014). The valuation of the EQ-5D in Portugal. Quality of Life Research,
23(2), 413–423. https ://doi.org/10.1007/s1113 6-013-0448-z. 28. Lyubomirsky, S., & Lepper, H. S. A measure of subjective
happi-ness: Preliminary reliability and construct validation. Social
Indi-cators Research, 46(2), 137–155, https ://doi.org/10.1023/a:10068 24100 041.
29. Gosling, S., Rentfrow, P., & Swann, W. (2003). A very brief meas-ure of the Big-Five personality domains. Journal of Research
in Personality, 37(6), 504–528. https ://doi.org/10.1016/s0092 -6566(03)00046 -1.
30. Braun, V., & Clarke, V. (2006). Using thematic analysis in psy-chology. Qualitative Research in Psychology, 3(2), 77–101. https ://doi.org/10.1191/14780 88706 qp063 oa.
31. Tennant, A., & Conaghan, P. (2007). The Rasch Measurement Model in Rheumatology: What is it and why use it? When should it be applied, and what should one look for in a Rasch paper.
Arthritis and Rheumatism, 57(8), 1358–1362.
32. Newby, V. A., Conner, G. R., Grant, C. P., & Bunderson, C. V. (2009). The Rasch model and additive conjoint measurement.
Journal of Applied Measurement, 10(4), 348–354.
33. Wright, B. D., & Linacre, J. M. (1989). Observations are always ordinal; measurements, however, must be interval. Archives of
Physical Medicine and Rehabilitation, 70(12), 857–860.
34. Masters, G. N. (1982). A rasch model for partial credit scoring.
Psychometrika, 47(2), 149–174. https ://doi.org/10.1007/bf022 96272 .
35. Hendriks, J., Fyfe, S., Styles, I., Skinner, S. R., & Merriman, G. (2012). Scale construction utilising the Rasch unidimensional measurement model: A measurement of adolescent attitudes towards abortion. Australasian Medical Journal, 5(5), 251–261.
https ://doi.org/10.4066/amj.2012.952.
36. Smith, E. (2002). Detecting and evaluation the impact of mul-tidimensionality using item fit statistics and principal compo-nent analysis of residuals. Journal of Applied Measurement, 3, 205–231.
37. Hagquist, C., & Andrich, D. (2017). Recent advances in analysis of differential item functioning in health research using the Rasch model. Health and Quality of Life Outcomes, 15(1), 181. https :// doi.org/10.1186/s1295 5-017-0755-0.
38. Landis, J. R., & Koch, G. G. (1977). The measurement of observer agreement for categorical data. Biometrics, 33(1), 159–174.
39. Henriques, M., Duarte, C., Ndosi, M., Marques, A., da Silva, J. A. P., & Ferreira, R. J. O. (2017). It can’t be zero”: a qualita-tive study of patients’ perspecqualita-tive on patient global assessment in rheumatoid arthritis [abstract]. Annals of the Rheumatic Diseases,
76(Suppl 2), 112. https ://doi.org/10.1136/annrh eumdi s-2017-eular .6214.
40. Van Tubergen, A., Debats, I., Ryser, L., Londono, J., Burgos-Var-gas, R., Cardiel, M. H., et al. (2002). Use of a numerical rating scale as an answer modality in ankylosing spondylitis-specific questionnaires. Arthritis and Rheumatism, 47(3), 242–248. https ://doi.org/10.1002/art.10397 .
41. Robinson-Papp, J., George, M. C., Dorfman, D., & Simpson, D. M. (2015). Barriers to chronic pain measurement: A qualitative study of patient perspectives. Pain Medicine, 16(7), 1256–1264.
https ://doi.org/10.1111/pme.12717 .
42. Hirsh, J., Wood, P., Keniston, A., Peng, M., Ramaswami, S., Caplan, L., et al. (2018). Limited health literacy predicts patient confusion about patient global assessments of disease activity and rheumatoid arthritis model disease states. Arthritis Care and
Research (Hoboken). https ://doi.org/10.1002/acr.23692 . 43. Abad, V. C., Sarinas, P. S., & Guilleminault, C. (2008). Sleep
and rheumatologic disorders. Sleep Medicine Reviews, 12(3), 211–228. https ://doi.org/10.1016/j.smrv.2007.09.001.
44. Ter Wee, M. M., van Tuyl, L. H., Blomjous, B. S., Lems, W. F., Boers, M., & Terwee, C. B. (2016). Content validity of the Dutch Rheumatoid Arthritis Impact of Disease (RAID) score: Results of focus group discussions in established rheumatoid arthritis patients and comparison with the International Classification of Functioning, Disability and Health core set for rheumatoid arthritis. Arthritis Research and Therapy, 18, 22. https ://doi. org/10.1186/s1307 5-015-0911-z.
45. Austad, C., Kvien, T. K., Olsen, I. C., & Uhlig, T. (2017). Sleep disturbance in patients with rheumatoid arthritis is related to fatigue, disease activity, and other patient-reported outcomes.
Scandinavian Journal of Rheumatology, 46(2), 95–103. https :// doi.org/10.3109/03009 742.2016.11684 82.
46. Pelton, T. W. (2002). The accuracy of unidimensional
measure-ment models in the presence of deviations from the underlying assumptions. Brigham: Brigham Young University; 2002.
47. Mokken, R. J. (1971). A theory and procedure of scale analysis:
With applications in political research (Vol. 1). The Hague:
Wal-ter de GruyWal-ter.
48. Canhão, H., Faustino, A., Martins, F., & Fonseca, J. E. (2011). Reuma.pt - the rheumatic diseases portuguese register. Acta