Communication management 2.0
The development of three socio-cognitive
models for brand page usage
Christopher Hendrik Ruehl
Department for Communication and Media Research, University of Fribourg, Fribourg, Switzerland, and
Diana Ingenhoff
Department for Communication Studies, University of Fribourg, Fribourg, Switzerland
Abstract
Purpose– The purpose of this paper is to investigate how and why individuals use corporate pages on Facebook with the aim of developing a usage-specific inventory of incentive factors which describe brand page utilization for consumption, participation and production behavior.
Design/methodology/approach– A combined perspective of uses-and-gratifications (U&G) and social cognitive theory (SCT) was applied to develop three models of brand page behavior. Based on a literature review, an online survey (N¼ 215) was conducted. Exploratory factor analyses identified motivational factors based on SCT incentive dimensions, which were cross-validated using confirmatory factor analysis (CFA). Findings– Results indicate that consumption behavior can best be explained by activity, self-reactive-novel and monetary incentives. Status incentives, practical-novel and self-reactive-idealistic incentives drive participation. Production behavior is best explained by social, self-reactive and status incentives. Practical implications– The models’ strategic implications for integrated communication management are discussed.
Originality/value– The results suggest interconnections of incentive dimensions unique to brand page usage, which have not yet been explored in any research.
Keywords Social media, Public relations, Communication management, Communication strategy Paper type Research paper
1. Introduction
Today, many of the communication processes of our daily lives take place in the digital environment of the Web 2.0, also called the social web. Some of the most prominent applications on the social web are social networking sites (SNSs), such as Facebook. SNS can be described as virtual communities, which enable users to build up and maintain their own personalized networks for information sharing and communication with others (Ellison and Boyd, 2013).
Early research on the use of SNS often focused on digital natives (DNs), who grew up with internet technology and naturally acquired usage competencies with new media. However, in recent years we have also seen a trend of people born before 1985 increasingly using Web 2.0 applications (Braun, 2013).
In 2007, Facebook opened its services to organizations, making it possible not only for individuals but also corporations to maintain profile pages, also called brand pages. Such pages have been described as specialized, non-geographically bound community sites, for individuals who are interested in a company or brand (Muniz and O’Guinn, 2001). By“liking” brand pages on Facebook, users can become fans and followers of a company’s products and services ( Jahn and Kunz, 2012).
In this paper, we take an integrated communication perspective and view corporate communication activities not as being part of either PR or marketing communications, which need to be analyzed separately from one another, but rather complementary to one another. Thus, the goal is to investigate shared, strategic elements in corporate
Published in "Journal of Communication Management" 21(2), 2017, 170-185 which should be cited to refer to this work
communication that aim to add value to the relationship between a corporation and its stakeholders (Bruhn, 2008; Einwiller and Boenigk, 2011). In SNS research, the integrated perspective becomes especially valuable, since many communication activities on brand pages provide a mixture of PR and marketing communication. However, until now, investigations taking an integrated approach to corporate SNS communication are rare. Only a few studies so far have developed our understanding of consumers’ actual usage of brand pages in the field of PR (Vorvoreanu, 2009; Men and Tsai, 2012, 2013; Tsai and Men, 2012, 2014) as well as marketing (Davis et al., 2014; Enginkaya and Yilmaz, 2014; Jahn and Kunz, 2012; Nambisan and Baron, 2007; Singh et al., 2012). Studies in both fields emphasize the great potential of SNS for (dialogic) communication with the community and other (potential) stakeholder groups. However, they often take a qualitative approach with rather small sample sizes.
In addition, we can identify studies investigating individuals’ general motives for SNS usage (Bicen and Cavus, 2011; Bonds-Raacke and Raacke, 2010; Boyd, 2008; Cheung et al., 2011; Dunne et al., 2010; Foregger, 2008; Jers, 2012; Nadkarni and Hofmann, 2012; Pai and Arnott, 2013; Quan-Haase and Young, 2010; Raacke and Bonds-Raacke, 2008; Shao, 2009; Smock et al., 2011; Subrahmanyama et al., 2008; Wang et al., 2012). These findings can also help to conceptualize items for studying brand pages when translated to a corporate context. We are therefore faced with a lack of knowledge from which to gain a broader and more quantifiable understanding about why and how SNS stakeholders use corporate Facebook pages.
Our study addresses this gap by developing a usage-specific inventory of incentive factors to describe brand page utilization in the form of different models for brand page use. The interdisciplinary models conceptualize and test the incentives that lead users to read, participate in and produce content on brand pages. They build on two theoretical pillars: First, a combined theoretic approach of uses-and-gratifications (U&G) (Blumler and Katz, 1974) and social cognitive theory (SCT) (Bandura, 1986). Second, Shao’s (2009) user typology of three different types of Web 2.0 usage behavior. From our literature review, we derive various motivations for brand page usage from the fields of PR, marketing and general Web 2.0 usage, to be employed in an online survey. Factor analyses allow us to tie the usage motives to their respective SCT incentive dimensions and Web 2.0 usage behavior. Afterwards, we will discuss the implications of our findings for communication management.
2. Literature review
2.1 The advancement of U&G with SCT
Today, the U&G approach (Blumler and Katz, 1974) remains one of the most commonly used theoretical perspectives for investigating individuals’ new media behavior (Rubin, 2009). With special regard to internet and social web research, however, scholars have started to point out that existing U&G studies often fail to adequately explain motivations for Web (2.0) usage (overview in Jers, 2012; LaRose and Eastin, 2004). In order to overcome these problems, LaRose et al. (2001, 2003) drew on the application of SCT to mass communication (Bandura, 2009) to theoretically advance the U&G approach with SCT. The basic assumption in the theoretical advancement is that gratifications sought in U&G (Greenberg, 1974) can be described by the concept of expected outcomes in SCT (Bandura, 1997), since both concepts describe symbolic representations of objectives to be attained through intentional media use, before the actual outcomes of such use are known. Due to the theoretical compatibility of the approaches, the combined conceptualization provides a theoretical foundation for U&G, which has been argued for in the past (Rubin, 2009).
In recent years, the socio-cognitive approach to U&G (SC-U&G) has been further advanced and empirically applied by scholars, yielding higher media usage explanation rates than most traditional gratification studies (LaRose and Eastin, 2004; Lee and Ma, 2012).
SCT describes six incentive dimensions under which behavioral motives can be grouped. These include monetary incentives, which contain financially beneficial outcome expectations, such as saving or generating money. Status incentives refer to motives of social power, social recognition and privileges associated with expertise or hierarchy positions. Therefore, status also includes image cultivation and impression management motivations.
As experiences often occur in conjunction with social interactions, the latter themselves can become primary incentives for opinion exchange and discussion. The basic difference between status and social incentives lies in the assumption that status incentives always require a competence or power level to be exposed, whereas social rewards can also result from actions that win approval without necessarily altering the hierarchy of individuals in a group.
Self-reactive incentives refer to expected outcomes that help individuals to regulate their inner mood or mental state, i.e. to balance their emotions and have expected pleasing effects. Behavior aimed at meeting an individual’s personal values or desired (social) standards is also included here. Activity incentives aim to satisfy the wish to take part in enjoyable activities and mainly include entertainment gratifications (Peters et al., 2006).
Sensory incentives point to the wish to expose oneself to novel or pleasing content or obtain new information. Since pleasing content can also work to gratify self-reactive incentives as well as activity incentives, research has narrowed sensory incentives mainly to the search for novel information (LaRose and Eastin, 2004) in order to increase the explanatory power of the dimension.
Recent studies ( Jers, 2012) have further identified two additional SC dimensions for social web behavior: First, idealistic incentives describe behavior motivated by individuals’ personal ideals and values, i.e. altruistic behavior, and second, practical incentives, which can be described as meta-outcome expectations, since they are likely to catalyze outcome expectations rather than posing unique incentives by themselves, for instance, laziness, comfort or flexibility.
2.2 Web 2.0 usage types and motives for brand page usage
Due to the interdependencies of social web usage motivations as usage unfolds over time, most studies addressing usage types conceptualize behavior rather broadly, i.e. dichotomously between active and passive usage (Miller and Lammas, 2010), or equate active usage with engagement ( Jahn and Kunz, 2012; Nadeem et al., 2015; Tsai and Men, 2014; Vorvoreanu, 2009). As social media allow a variety of potential behaviors, scholars have further aimed to identify specific behavioral categories for the social web, i.e. content searching, sharing or playing activities (Bolton et al., 2013). Shao was among the first to look at social media usage on a continuum of audience activity from low to high, which better accounts for the dynamics of usage and interlocking behavioral incentives. With respect to the level of user interaction with a platform, he differentiated between consuming, participating and producing usage (Shao, 2009).
For this study, we build on Shao’s latter conceptualization of Web 2.0 usage. With respect to the above three user types, our model development aims to describe each usage as appropriately as possible, drawing on different usage incentives brought forward in the literature.
The lowest interaction level, consumption, describes media use limited to viewing/ watching and reading content. Vorvoreanu (2009) found that the majority of students she interviewed had negative feelings about organizations being on Facebook and preferred the network to be exclusively for communication with friends and family. However, students were willing to accept corporations in return for rewards, i.e. coupons or discounts (also Davis et al., 2014; Enginkaya and Yilmaz, 2014; Men and Tsai, 2013; Quan-Haase and Young, 2010). Davis et al. (2014) further describe the wish to take part in competitions and win prizes as being among the core drivers of brand consumption. These motives
are closely related to findings by Enginkaya and Yilmaz (2014), who showed that students visited brand pages because they wanted to take part in free games or quizzes (also Bicen and Cavus, 2011; Cheung et al., 2011; Pai and Arnott, 2013; Smock et al., 2011).
Both PR (Men and Tsai, 2013; Tsai and Men, 2014; Vorvoreanu, 2009) and marketing-oriented research (Davis et al., 2014; Enginkaya and Yilmaz, 2014; Jahn and Kunz, 2012; Nambisan and Baron, 2007; Singh et al., 2012) describe the primary reasons for people to consume corporate brand pages as being to obtain product, promotional and corporate information, as well as to form a general opinion about a corporation (Davis et al., 2014; Singh et al., 2012; Tsai and Men, 2014).
In addition, product- and service information-seeking was more relevant to Western publics, whereas Asian users were more interested in information and posts unrelated to the brand (Men and Tsai, 2012, 2013; see also Tsai and Men, 2013, 2014). The same studies suggest that individuals generally visit brand pages for reasons of entertainment and to pass the time, but also to see corporate pictures and video clips (for PR research, for marketing, also see: Davis et al., 2014; Enginkaya and Yilmaz, 2014; Jahn and Kunz, 2012; Nambisan and Baron, 2007; for general SNS usage: Bicen and Cavus, 2011; Cheung et al., 2011; Dunne et al., 2010; Foregger, 2008; Jers, 2012; Pai and Arnott, 2013; Quan-Haase and Young, 2010; Raacke and Bonds-Raacke, 2008; Smock et al., 2011; Wang et al., 2012). Furthermore, young people use brand pages to seek unique company information, which they cannot find anywhere else, as well as information that they can trust on brand pages (Enginkaya and Yilmaz, 2014).
Next, participation describes basic user-to-user and user-to-content interaction, such as rating or sharing the content of a page with others (Bolton et al., 2013). Basic forms of user-to-user interaction (i.e. networking, becoming a fan/follower of a corporation) are included in this type as well ( Jahn and Kunz, 2012; Nadeem et al., 2015; Tsai and Men, 2014; Vorvoreanu, 2009). Research shows that users are likely to establish a network connection with a corporation, i.e.“like” a brand page, primarily to serve their self-presentational and image management needs (Men and Tsai, 2012; Vorvoreanu, 2009). People want to convey a certain image of themselves ( Jahn and Kunz, 2012; Men and Tsai, 2013; Quan-Haase and Young, 2010), or think that others will perceive them as being likeable when connected to a certain brand ( Jahn and Kunz, 2012; Nadkarni and Hofmann, 2012). Scholars point out that young people in particular want to let others know which products and services they use (Enginkaya and Yilmaz, 2014; Jahn and Kunz, 2012), as well as which products and services suit their lifestyle (Smock et al., 2011).
Businesses are befriended because individuals like the corporation, and/or feel close to the corporation (expression of belonging) (Davis et al., 2014; Jahn and Kunz, 2012; Lee et al., 2013; Men and Tsai, 2013). The need to belong was further identified as a general motivation to use SNS, since individuals want to be part of a social group and share some values with this group (Bicen and Cavus, 2011; Bonds-Raacke and Raacke, 2010; Boyd, 2008; Jers, 2012; Nadkarni and Hofmann, 2012; Raacke and Bonds-Raacke, 2008). In addition, to support a corporation by“liking” their page is a consistent motivation put forward in PR and marketing research (Jahn and Kunz, 2012; Men and Tsai, 2013; Vorvoreanu, 2009).
Quan-Haase and Young (2010) found that students looked for social information to feel involved with what’s going on with other people. This leads us to further separate three distinct components: First, Facebook allows respondents to obtain real-time information from their network without actively looking for such information. Second, by establishing a connection, users can choose which new posts from their network will automatically appear in the newsfeed. Third, the connection allows users to keep updated on social news, which they might not be looking for otherwise.
In marketing, functional aspects (i.e. having the possibility of addressing a brand spontaneously or keeping up with news) were also found to play a major role in maintaining
a network connection ( Jahn and Kunz, 2012). Thus, the mere need to sustain a relationship with a corporation in an easy manner can further be identified as a basic relationship-management incentive. In addition, users generally connect with others in order to maintain a relationship over distance or time (Foregger, 2008; Raacke and Bonds-Raacke, 2008; Smock et al., 2011), or simply because it is easy (Dunne et al., 2010; Foregger, 2008; Subrahmanyama et al., 2008), both of which support the above argument.
Finally, the highest interaction level is production, which describes all publication activities by individuals that result in publicly accessible text and images, as well as audio and video content on a page. One of the most prominent reasons for producing content on corporate pages is to request specific information from a company. This can be either general (new) product or service information, customer support inquiries or information about the company itself (non-product/service-related information) (Vorvoreanu, 2009). Furthermore, information exchange with other users serves as a major incentive to post content on a brand page, i.e. putting questions to the community, commenting on questions posed by other users or just engaging in general discussions with the community. Likewise, the motive to react to postings by the company provides an interaction incentive (Men and Tsai, 2012, 2013).
The provision of feedback to the company and community in the form of product reviews and praise, but also criticism, is an objective pursued by many users (Enginkaya and Yilmaz, 2014; Men and Tsai, 2013). Publicly criticizing a corporation seems to reduce stress and frustration among users and allow them to feel good/better ( Jers, 2012; Men and Tsai, 2012; Nadkarni and Hofmann, 2012). Publicly visible statements gratify some people’s need for public attention (Davis et al., 2014), their need to exert influence on others (Men and Tsai, 2013) and the wish to appear competent (Nadkarni and Hofmann, 2012; Shao, 2009). Furthermore, people produce content on Facebook because they want to show that they are not shy to interact publicly with corporations – especially when criticizing a company (Pai and Arnott, 2013) – and to receive appreciation for one’s contributions (Davis et al., 2014; Shao, 2009). Pai and Arnott (2013) found that users prefer such channels for messaging as they expect to receive answers more promptly than through other forms of communication. Likewise, users were found to be less inhibited to communicate with strangers on Facebook than through other channels (Quan-Haase and Young, 2010), which might arguably also hold for corporate communication.
Overall, most authors have concluded that users generally show little interest in producing content on corporate Facebook pages (Men and Tsai, 2013). Instead, people telephone and e-mail to engage in dialogue with organizations (Vorvoreanu, 2009). The most commonly performed behavior is consumption, followed by networking or post-sharing motivations.
These findings lead us to the following research questions:
RQ1. Which incentive dimensions best describe users’ motives to consume corporate Facebook pages?
RQ2. Which incentive dimensions best describe users’ motives to participate on corporate Facebook pages?
RQ3. Which incentive dimensions best describe users’ motives to produce content on corporate Facebook pages?
3. Method
We conducted an online survey using the snowball sampling technique, in which the survey URL was communicated to 20 members of our university department. The members spread the link in their Facebook networks and asked people to participate, as well as to repost the
URL further among their network. Since the method relies on referrals from initially sampled respondents to other persons within their friend network, snowball sampling allows us to reach a rather undefined, geographically widely spread range of users all of whom are active on Facebook for participation in our study. This further allows us to recruit members of an unknown population for study participation, which is not easily definable through listings or other accessible information (Johnson, 2014). In addition, the network connections that exist between individuals are likely to positively affect participation (Faugier and Sargeant, 1997).
At the beginning of the survey, participants were asked four filter questions to determine their brand page usage and indicate the number of corporations with whom they were connected. News pages, such as Euronews, CNN News, etc., were excluded from the investigation. Questions about the incentives for brand page usage were formulated using SCT question wording, which asks for a respondent’s agreement about the likelihood of a certain outcome resulting from brand page usage (LaRose and Eastin, 2004), i.e.“When I read/look at the postings of corporations on Facebook, it is likely that […]” Agreement with the statements made in the survey were measured on a seven-point Likert scale from “(1) fully agree” to “(7) completely disagree.” Such question wording has resulted in good reliability values for factor items above 0.7 ( Jers, 2012; LaRose and Eastin, 2004). The items applied in the study are taken from the investigations included in the literature review and are stated in Tables I-III. At the end, respondents were asked to include some demographic data.
To answer our research questions, the response data were first analyzed using exploratory factor analysis (EFA) to reveal the underlying incentive dimensions of SCT fitting the items applied for each user type (Mertler and Vannatta, 2013). The composition of items among the factors was reviewed to identify the SCT incentive dimensions which best describe the items on each factor. To assess the validity of the proposed factor solution resulting from the EFA beyond mere researcher interpretation, we analyzed reliability measures for different sub-sets in our data, i.e. gender, age group and level of education. For age group, we differentiated between DNs and generation X (GenX). DNs are commonly described as persons born from 1985 onwards (Bennett et al., 2008), whereas respondents born before that date are referred to as generation X. In a second step, confirmatory factor analysis (CFA) was applied to the overall data set to validate the derived models.
4. Results
4.1 Basic sample statistics
In total, 271 people participated in the online survey. After data cleaning, 215 (N: nfemale¼ 146, nmale¼ 69) valid data sets were identified. On average, respondents used
Facebook up to one hour a day and consumed corporate pages several times a week. The average brand page user is 30 years old (nDN¼ 152; nGenX¼ 63), connected
with 27 corporations, hits the “like” button on brand pages several times a year, and produces content on such pages less than once a year. The sample consists of 114 (53.0 percent) respondents with formally low education (compulsory education¼ 4, apprenticeship¼ 26, vocational diploma ¼ 84) and 101 (46.9 percent) formally highly educated (advanced vocational education¼ 15, university diploma ¼ 86) users. Initial data analysis revealed that 174 persons (80.9 percent) consumed corporate pages, 149 persons (68.2 percent) participated with brands and 58 persons (26.9 percent) had already posted on corporate pages.
All item distributions were assessed and items which showed low communalities (o0.3) in the initial EFA were excluded from further analysis. The remaining items were
reanalyzed using EFA (maximum-likelihood method, varimax rotation, factor eigenvalueW1.0).
4.2 Results of the EFA
4.2.1 Factor solution for consumption items. Table I shows the results of the EFA for the consuming user type. The analysis suggests a three-factor solution explaining 62.23 percent of the total variance in the data. The first factor explains 37.13 percent of the variance, and includes the incentives that point to rather enjoyable activities, and thus describe activity incentives. The second factor explains 16.02 percent of the variance and includes four items, which point to a mixture of novelty seeking as well as self-reactive incentives for opinion forming. Factor three comprises motivational items which describe monetary incentives and explain 9.09 percent of the total variance.
Cronbach’s α shows very good reliability measures for all consumption factors. α values for gender, age group and level of education also indicate very good reliability among the sample sub-groups (Table I), which allows us to accept the factor solution as it is.
4.2.2 Factor solution for participation items. The EFA of the items for participation show similarly distinct results: SPSS suggests a three-factor solution in which factor one points to image and impression management motives, representing status incentives. This factor explains most of the variance in participation with 44.02 percent. The second factor explains 14.83 percent of the variance and points to a mixture of practical and novel motivations. Finally, the third factor explains 9.07 percent of the variance in the data set and contains a mixture of self-reactive and idealistic motives. In total, the three factors make up 67.93 percent of variance in participation and show good reliability values overall, as well as for the different sub-groups (Table II).
Factor
Item (expected outcome) Mean SD 1 2 3 Communalities
I want to feel entertained 3.62 1.517 0.847 0.353 0.020 0.842 I want to have fun 3.04 1.577 0.890 0.132 0.104 0.820 I want to pass time 4.07 1.704 0.623 0.218 0.216 0.482 I want to see corporate pictures or video clips 3.95 1.790 0.472 0.259 0.158 0.315 I want to form an opinion about a corporation’s
products and services 3.86 1.621 0.214 0.870 0.038 0.804 I want to form a general opinion about the corporation 3.69 1.684 0.158 0.876 0.044 0.794 I want to find information, which I can’t find
anywhere else 3.39 1.621 0.279 0.505 0.094 0.341 I want to find information that I can trust 2.73 1.518 0.279 0.507 0.123 0.412 I want to receive vouchers, discount coupons or
special offers for products and services 3.19 1.840 0.173 0.074 0.843 0.747 I want to take part in a competition 3.07 1.826 0.163 0.074 0.877 0.801 I want to play a game or quiz for free 2.34 1.570 0.050 0.061 0.693 0.487 Variance explained (%) 37.13 16.02 9.09
Cronbach’s alpha total 0.838 0.831 0.856 Alpha male respondents 0.844 0.856 0.852 Alpha female respondents 0.859 0.856 0.859
α DN 0.855 0.853 0.854
α GenX 0.851 0.865 0.868
α FLE 0.921 0.824 0.709
α FHE 0.907 0.903 0.870
Note: The highest factor loadings per item in bold Table I.
EFA results for consumption items
4.2.3 Factor solution for production items. The third usage type is again best explained by a three-factor solution accounting for 64.3 percent of variance in the data. The first factor consists of ten items, which can theoretically be assigned to the social incentive dimension, the self-reactive dimension and the status dimension. However, these only make up 17.96 percent of the variance. In contrast, the second factor explains 37.39 percent of the variance by including four items, which point to social interaction motives. Two items show cross-loadings of 0.540 with factor two and 0.633 with factor one, making a distinct allocation of these items to one factor difficult. The last factor accounts for 8.93 percent of the variance and includes two self-reactive motives, as well as one status incentive (Table III).
From the above, it becomes apparent that the resulting factor matrix does not allow us to allocate the items on each factor to one distinct SCT dimension. In order to still be able to draw conclusions about the applicability of the SCT dimensions to production behavior, we tested the reliability of the items relating to the same incentive dimensions as outlined above. Cronbach’s α for the social dimension for all items relating to self-reactive incentives, as well as those relating to status incentives, all show good values (Table III) after their theoretical attribution. The item-factor solution can also be reproduced for the three sample sub-groups.
From the above analysis, we can conclude that our theoretical assignment of each item to a respective SCT dimension results in acceptable reliability values for each item package. We therefore accept the theoretically driven item allocation to be used for confirmatory testing.
Factor
Item (expected outcome) Mean SD 1 2 3 Communalities
I want to convey a certain image/impression of myself 3.03 1.762 0.834 0.174 0.208 0.769 Others will think of me as being likeable 2.41 1.533 0.853 0.180 0.087 0.768 I want to let others know which products and
services suit my lifestyle 2.97 1.787 0.819 0.205 0.114 0.726 I want to let others know which products and
services I buy 2.69 1.679 0.793 0.108 0.226 0.691 I want to sustain a relationship with the corporation
in an easy manner 3.11 1.602 0.315 0.536 0.233 0.441 I want to receive real-time information from
corporations 3.91 1.755 0.194 0.899 0.117 0.860 I want to keep updated on news about the corporation,
which I would not be looking for otherwise 4.11 1.736 0.121 0.806 0.312 0.762 I want to have new posts on a corporation’s page
appear in my news feed 3.89 1.773 0.129 0.677 0.324 0.580 I feel close to the corporation 4.14 1.473 0.140 0.243 0.554 0.386 I like the corporation/think of it as being
sympathetic 5.0 1.242 0.123 0.233 0.914 0.904 I want to support the corporation 4.53 1.436 0.241 0.234 0.688 0.586 Variance explained (%) 44.02 14.83 9.07
Cronbach’s alpha total 0.915 0.867 0.786 Alpha male respondents 0.921 0.762 0.704 Alpha female respondents 0.901 0.887 0.805
α DN 0.914 0.860 0.767
α GenX 0.916 0.891 0.857
α FLE 0.921 0.824 0.709
α FHE 0.907 0.903 0.870
Note: The highest factor loadings per item in bold
Table II. EFA results for participation items
4.3 Results of the CFA
Based on the EFA results, we conducted CFA to test the hypothesized three SCT models of brand page usage. In predominantly exploratory research, it has been argued that factor loadings should be interpreted less rigidly than in solely confirmatory research since explorative research is mostly concerned with the identification of theoretically derived structures in the data material (Browne, 2001). Therefore, we will accept item loadings of⩾ 0.5 in our analysis.
4.3.1 Results and assessment of factor solution for consumption usage. The initial CFA for the three-factor model results in a null (default) model with 41 degrees of freedom (df) and a significantχ2value (114.444), meaning that other models might explain the data just as well as our model does (see Table IV). Likewise, the adjusted goodness-of-fit index (AGFI), which measures the amount of variance and covariance in the sample data which is
Factor
Item (expected outcome) Mean SD 1 2 3 Communalities
I reduce strain and stress/frustration 2.5 1.636 0.598 0.115 0.274 0.446 I feel good/better by doing so 2.71 1.59 0.683 0.332 0.174 0.609 I am less inhibited to contact the corporation
through Facebook than through other channels 3.14 1.616 0.446 0.157 0.479 0.453 I expect to receive a prompt answer 3.97 1.863 0.296 0.095 0.950 0.999 I comment on pictures and videos 3.38 1.599 0.432 0.333 −0.074 0.303 I exchange opinions/views/information with
other users 2.9 1.619 0.633 0.540 0.67 0.698 I request concrete information from the company
(i.e. product/service information) 3.53 1.779 −0.159 0.596 0.293 0.466 I provide feedback about a corporation’s products
and services (reviews, praise, criticism, etc.) 4.02 1.701 0.178 0.776 0.254 0.697 I react to the posts of corporations (statements,
questions, etc.) 2.88 1.365 0.381 0.634 0.025 0.548 I want to catch other people’s attention 2.26 1.65 0.826 0.133 0.078 0.706 I want my posts to be appreciated by others 2.47 1.657 0.933 0.026 0.144 0.883 I want to influence the corporation and/or
other users 3.33 1.995 0.640 0.088 0.409 0.585 I want others to think I am a competent person 2.48 1.828 0.930 0.088 0.091 0.881 I want to show others that I am not shy to publicly
communicate with corporations 2.47 1.657 0.834 0.173 0.060 0.729 Variance explained (%) 17.96 37.39 8.93
Cronbach’s alpha total 0.782 0.759 0.924 Alpha male respondents 0.657 0.792 0.880 Alpha female respondents 0.818 0.754 0.884
α DN 0.761 0.721 0.885
α GenX 0.811 0.822 0.903
α FLE 0.816 0.723 0.914
α FHE 0.771 0.801 0.865
Note: The highest factor loadings per item in bold Table III.
EFA results for production items
Model df χ2 χ2/df AGFI ECVI RMSEA
Null 41 114.444*** 2.791 0.830 0.951 0.102 Nested model 17 41.250 2.426 0.884 0.458 0.091 Note: ***po0.001
Table IV. CFA results for consuming usage
jointly explained by the model, shows a rather low value of 0.830 (should be⩾ 0.9). The expected cross-validation index (ECVI), which assesses the likelihood that the model will hold in other similar-sized samples from the same population, was higher (0.951) in the default model than the same index for the saturated model (0.763), as well as the independence model (6.124). Since ECVI values can take any form, default model values lower than these for the saturated and independence model are generally accepted as good values (Byrne, 2010), indicating that our model needs modification. Finally, the root mean square error of approximation (RMSEA), which assesses how well the model would fit the real population covariance matrix if it was available, was rather high (0.102), indicating poor model fit (o0.1). Most consumption items showed satisfactory factor loadings ofW0.5, except the three items pictures/video clips (Factor 1), information which I cannot find anywhere else (Factor 2) and information that I can trust (Factor 2).
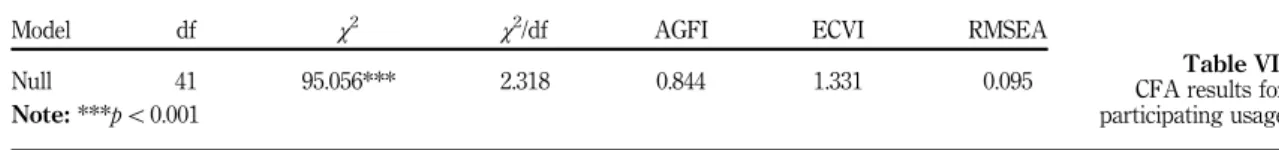
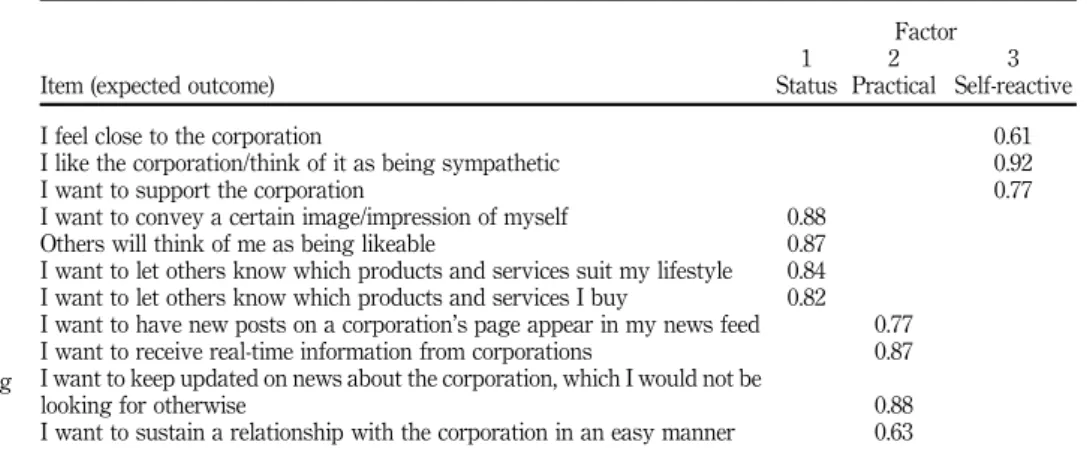
4.3.2 Model modification for consumption usage. After the exclusion of the three items with low factor loadings, the nested model shows acceptable factor loadings for all items (see Table V). The model shows 41 df and a non-significantχ2of 41.25, indicating a better sample fit than the null model. In addition, the AGFI value positively increased to 0.884. The ECVI value for our default model is still higher than the respective value for the saturated model (0.416), but the difference between the two models has decreased. Additionally, RMSEA has decreased to a mediocre fit value of 0.091. Both values suggest that the nested model fits our sample data much better than the null model (see Table IV). 4.3.3 Results and assessment of factor solution for participation usage. The CFA for the participation model results in a null model with 41 df and a significantχ2value of 95.056. With 0.844, AGFI just fails the cut-off value of 0.9 for good model fit. Likewise, the ECVI value of our default model is slightly higher than that of the saturated model (1.048), but is far removed from the independence model (7.337). Therefore, the null model’s AGFI and ECVI values can be deemed acceptable. Another aspect supporting the acceptance of the null model is the RMSEA value of 0.095 indicating mediocre fit (see Table VI). All item-factor loadings of the null model show acceptable values of⩾ 0.61 (see Table VII). Therefore, the null model proves sufficient to be accepted in our exploratory study.
Factor
Item (expected outcome)
1. Activity 2. Self-reactive-novel 3. Monetary
I want to feel entertained 0.97
I want to have fun 0.83
I want to pass time 0.65
I want to receive vouchers, discount coupons or special
offers for products and services 0.85
I want to take part in a competition 0.91 I want to form an opinion about a corporation’s products
and services 0.84
I want to form a general opinion about the corporation 0.95
I want to play a game or quiz for free 0.69
Table V. CFA for consuming usage (standardized loadings)
Model df χ2 χ2/df AGFI ECVI RMSEA
Null 41 95.056*** 2.318 0.844 1.331 0.095 Note: ***po0.001
Table VI. CFA results for participating usage
4.3.4 Results and assessment of factor solution for production usage. The three-factor model for production results in a null model with 62 df and a significantχ2of 129.735. Both the AGFI (0.643) and the ECVI (null: 3.294; saturated: 3.193; independent: 10.326) values indicate insufficient model fit. Similarly, the RMSEA shows a rather bad fit value of 0.138 (see Table VIII and IX).
Four items applied in the CFA did not yield loadings ofW0.5, namely, to request concrete information from the company (Factor 2), to be less inhibited to contact the corporation through Facebook than through other channels (Factor 1), to receive a prompt answer
Factor
Item (expected outcome)
1 Status 2 Practical 3 Self-reactive
I feel close to the corporation 0.61
I like the corporation/think of it as being sympathetic 0.92
I want to support the corporation 0.77
I want to convey a certain image/impression of myself 0.88 Others will think of me as being likeable 0.87 I want to let others know which products and services suit my lifestyle 0.84 I want to let others know which products and services I buy 0.82 I want to have new posts on a corporation’s page appear in my news feed 0.77 I want to receive real-time information from corporations 0.87 I want to keep updated on news about the corporation, which I would not be
looking for otherwise 0.88
I want to sustain a relationship with the corporation in an easy manner 0.63 Table VII.
CFA for participating usage (standardized loadings)
Model df χ2
χ2/df AGFI ECVI RMSEA
Null 62 129.735*** 2.093 0.643 3.294 0.138 Nested model 32 50.264 1.571 0.775 1.689 0.100 Note: ***po0.001
Table VIII. CFA results for production usage
Factor
Item (expected outcome)
1 Self-reactive 2 Social 3 Status
I provide feedback about a corporation’s products and services (reviews,
praise, criticism, etc.) 0.58
I react to the posts of corporations (statements, questions, etc.) 0.63
I comment on pictures and videos 0.61
I exchange opinions/views/information with other users 0.94 I reduce strain and stress/frustration 0.73
I feel good/better by doing so 0.97
I want to catch other people’s attention 0.83 I want my posts to be appreciated by others 0.92 I want others to think I am a competent person. 0.96 I want to show others that I am not shy to publicly communicate
with corporations 0.86
Table IX. CFA results for production usage (standardized loadings)
(Factor 1) as well as to influence the corporation and/or other users (Factor 3). These items were excluded from the analysis in further model modification.
4.3.5 Model modification for production usage. The nested model shows a much lower number of 32 df and a non-significantχ2value of 50.264, indicating much better model fit to our data. The nested model also explains a higher amount of the (co-)variance in respect to df than the null model (AGFI¼ 0.775). ECVI shows a good fit of 1.689, being lower than the respective saturated model (1.930) and independence model (8.279) values. In addition, RMSEA (0.1) indicates mediocre model fit (see Table VIII). All items now show good factor loadings of⩾ 0.58, thus suggesting that the nested model can be reasonably accepted.
5. Discussion
5.1 Summary and theoretical implications of the findings
This study applied a combined perspective of SC-U&G to develop and test three models for brand page usage. Our literature review analyzed the motives for (corporate) Facebook use from an integrated perspective and with regard to three Web 2.0 usage types. Data obtained from an online questionnaire were analyzed using EFA and CFA for model construction and testing. The results show that consumption behavior (RQ1) is driven mostly by activity incentives followed by self-reactive-novel (sensory) incentives and monetary incentives. The motivations included in the activity dimension are in line with generally acknowledged consumption motives, as well as SCT incentives of traditional media, general internet and social media usage (LaRose and Eastin, 2004; Shao, 2009). It seems logical that the self-reactive and novel items form one factor together, since the need for new information can be accompanied by the feeling of emotional imbalance. However, this combination has not thus far been described in Web 2.0 research, pointing to a potential specific configuration of motivations for brand page use in our study. This result does not come as a surprise with regard to Bandura’s (1986) original work, in which he described sensory motives as a broader category containing novel and pleasing behavioral intentions. Our results therefore suggest a return toward Bandura’s initial conceptualization of sensory incentives. The manifestation of a distinct factor of monetary incentives emphasizes the importance of financial motivations, which have received little attention until now in existing Web 2.0 research (Vorvoreanu, 2009).
Status incentives drive participation (RQ2), followed by practical-novel incentives and self-reactive-idealistic incentives. These findings are in line with earlier studies that describe Facebook as a tool to manage one’s online identity (Bouvier, 2012; Boyd, 2008). “Liking” brand pages seems to offer a practical and easy way to cater for individuals’ information needs, combining motivations that were previously investigated separately from each other ( Jers, 2012).
Initial EFA for production (RQ3) did not result in a theoretically sound factor solution, but the theoretical reallocation of the items in combination with reliability testing resolved these difficulties. A possible explanation for this might lie in the rather low number of respondents who indicated production use of corporate pages (nprod¼ 58).
Our results suggest that the theoretical framework of SCT and U&G offers a suitable foundation for the development of the usage models for brand page behavior. Furthermore, we revealed unique configurations of incentive dimensions for each user type, which also held true for different sample sub-groups, such as gender, age group and level of formal education. Following this path, brand page usage differs from general SNS usage in the sense that novel incentives were found to be intertwined with self-reactive (consumption) or practical (participation) usage motivations. Likewise, self-reactive motives seem to be intertwined with idealistic motives (participation).
5.2 Limitations and future research
The applied sampling technique is based on a convenient selection of participants, implying a limited representativeness. Therefore, statistical inferences from the sample to the entire brand page user population are not adequate (Biernacki and Waldorf, 1981). However, to explore the constructional characteristics of brand page usage, this technique seems suitable.
After the theoretical foundation and initial testing of our user-centric models, future research should apply the models to other samples to further test and refine the usage incentives put forward.
Since our models are derived from findings obtained from research in different cultural areas, future research should further investigate motives for brand page use in a comparative manner to see if cultural contexts have an influence on usage incentives. Also, our models could be further developed by including antecedents which might affect brand page usage, i.e. purchase intention and shareholder type, as well as investigating the actual impact of each factor.
5.3 Implications for integrated communication management
Our findings point to the fact that brand pages pose relevant communication channels for integrated communication management. Corporations should not be surprised, however, if participation and production on their pages remain rather low, since the vast majority of users only read content, with fewer interaction incentives. When producing content, users seek to interact with the brand, as well as with other individuals. This requires the careful attention of social media managers in order to closely assess when company involvement is asked for, and when the page provides a mere platform for stakeholder exchange. Once addressing the corporation directly, users expect a prompt response to, as well as appreciation for their inquiries.
It can be argued that a brand page is only worth the organizational investment if the communicative needs of stakeholders using the offering are known. Likewise, communication management scholarship is still in search of effective instruments to measure and evaluate social media PR’s contribution to image creation and profit maximization. The development of our incentive-driven usage models can inform measurement and evaluation-oriented research. Therefore, the instrument is suitable for the continuous (re-)evaluation of user brand page preferences in market-oriented research.
References
Bandura, A. (1986), Social Foundations of Thought and Action. A Social-Cognitive Theory, Prentice Hall, Englewood Cliffs, NJ.
Bandura, A. (1997), Self-efficacy: The Exercise of Control, Freeman, New York, NY.
Bandura, A. (2009),“Social cognitive theory of mass communication”, in Bryant, J. and Oliver, M.B. (Eds), Media Effects: Advances in Theory and Research, Routledge, New York, NY and London, pp. 94-124.
Bennett, S., Maton, K. and Kervin, L. (2008), “The ‘digital natives’ debate: a critical review of the evidence”, British Journal of Educational Technology, Vol. 39 No. 5, pp. 775-786.
Bicen, H. and Cavus, N. (2011), “Social network sites usage habits of undergraduate students”, Procedia– Social and Behavioral Sciences, Vol. 28 No. 1, pp. 943-947.
Biernacki, P. and Waldorf, D. (1981),“Snowball sampling: problems and techniques of chain referral sampling”, Sociological Methods & Research, Vol. 10 No. 2, pp. 141-163.
Blumler, J.E. and Katz, E. (1974), The Uses of Mass Communications: Current Perspectives on Gratifications Research, Sage, Beverly Hills, CA and London.
Bolton, R.N., Parasuraman, A., Hoefnagels, A., Migchels, N., Kabadayi, S., Gruber, T. and Solnet, D. (2013), “Understanding generation Y and their use of social media”, Journal of Service Management, Vol. 24 No. 3, pp. 245-267.
Bonds-Raacke, J. and Raacke, J. (2010), “MySpace and Facebook: identifying dimensions of uses and gratifications for friend networking sites”, Individual Differences Research, Vol. 8 No. 1, pp. 27-33.
Bouvier, G. (2012),“How Facebook users select identity categories for self-presentation”, Journal of Multicultural Discourses, Vol. 7 No. 1, pp. 37-57.
Boyd, D.M. (2008), “Why youth love social networking sites”, in Buckingham, D. (Ed.), Youth, Identity, and Digital Media, Massachusetts Institute of Technology Press, Cambridge, MA, pp. 119-142.
Braun, M.T. (2013),“Obstacles to social networking website use among older adults”, Computers in Human Behavior, Vol. 29 No. 3, pp. 673-680.
Browne, M.W. (2001),“An overview of analytic rotation in exploratory factor analysis”, Multivariate Behavioral Research, Vol. 36 No. 1, pp. 111-150.
Bruhn, M. (2008),“Planning integrated marketing communications”, in Sievert, H. and Bell, D. (Eds), Communication and Leadership in the 21st Century, Bertelsmann Stiftung, Güthersloh, pp. 13-34.
Byrne, B.M. (2010), Structural Equation Modeling with AMOS, Routledge, New York, NY and London.
Cheung, C.M.K., Chiu, P.-Y. and Lee, M.K.O. (2011),“Online social networks: why do students use Facebook?”, Computers in Human Behavior, Vol. 27 No. 4, pp. 1337-1343.
Davis, R., Piven, I. and Breazeale, M. (2014),“Conceptualizing the brand in social media community: the five sources model”, Journal of Retailing and Consumer Services, Vol. 21 No. 4, pp. 468-481. Dunne, Á., Lawlor, M.-A. and Rowley, J. (2010),“Young people’s use of online social networking sites”,
Journal of Research in Interactive Marketing, Vol. 4 No. 1, pp. 46-58.
Einwiller, S.A. and Boenigk, M. (2011), “Examining the link between integrated communication management and communication effectiveness in medium-sizes enterprises”, Journal of Marketing Communications, Vol. 18 No. 5, pp. 335-361.
Ellison, N.B. and Boyd, D.M. (2013),“Sociality through social network sites”, in Dutton, W.H. (Ed.), The Oxford Handbook of Internet Studies, Oxford University Press, Oxford, pp. 151-172.
Enginkaya, E. and Yilmaz, H. (2014),“What drives consumers to interact with brands through social media?”, Procedia – Social and Behavioral Sciences, Vol. 148 No. 1, pp. 219-226.
Faugier, J. and Sargeant, M. (1997), “Sampling hard to reach populations”, Journal of Advanced Nursing, Vol. 26 No. 4, pp. 790-797.
Foregger, S.K. (2008), Uses and Gratifications of Facebook.com, ProQuest, Ann Arbor, MI.
Greenberg, B.S. (1974),“Gratifications of television viewing and their correlates for British children”, in Blumler, J.E. and Katz, E. (Eds), The Uses of Mass Communication, Sage, Beverly Hills, CA and London, pp. 71-92.
Jahn, B. and Kunz, W. (2012),“How to transform consumers into fans of your brand”, Journal of Service Management, Vol. 23 No. 3, pp. 344-361.
Jers, C. (2012), Konsumieren, partizipieren und produzieren im Web 2.0, Herbert von Halem Verlag, Köln.
Johnson, T.P. (2014), Snowball Sampling: Introduction, Wiley StatsRef, Wiley and Sons, Chichester. LaRose, R. and Eastin, M.S. (2004), “A social cognitive theory of internet U&G: toward a new
model of media attendance”, Journal of Broadcasting & Electronic Media, Vol. 48 No. 3, pp. 358-377.
LaRose, R.L., Lin, C.A. and Eastin, M.S. (2003), “Unregulated internet usage: addiction, habit, or deficient self-regulation?”, Media Psychology, Vol. 5 No. 3, pp. 225-253.
LaRose, R.L., Mastro, D. and Eastin, M.S. (2001), “Understanding internet usage: a social-cognitive approach to U&G”, Social Science Computer Review, Vol. 19 No. 4, pp. 395-413.
Lee, C.S. and Ma, L. (2012), “News sharing in social media: the effect of gratifications and prior experience”, Computers in Human Behavior, Vol. 28 No. 2, pp. 331-339.
Lee, K., Oh, W.-Y. and Kim, N. (2013),“Social media for socially responsible firms: analysis of fortune 500’s Twitter profiles and their CSR/CSIR ratings”, Journal of Business Ethics, Vol. 18 No. 4, pp. 791-806.
Men, L.R. and Tsai, W.-H.S. (2012), “How companies cultivate relationships with publics on social network sites: evidence from China and the United States”, Public Relations Review, Vol. 38 No. 5, pp. 723-730.
Men, L.R. and Tsai, W.-H.S. (2013), “Beyond liking or following: understanding public engagement on social networking sites in China”, Public Relations Review, Vol. 39 No. 1, pp. 13-22.
Mertler, C.A. and Vannatta, R. (2013), Advanced and Multivariate Statistical Methods, Routledge, New York, NY and London.
Miller, R. and Lammas, N. (2010),“Social media and its implications for viral marketing”, Asia Pacific Public Relations Journal, Vol. 11 No. 1, pp. 1-9.
Muniz, A.J. and O’Guinn, T. (2001), “Brand community”, Journal of Consumer Research, Vol. 27 No. 4, pp. 412-432.
Nadeem, W., Andreini, D., Salo, J. and Laukkanen, T. (2015),“Engaging consumers online through websites and social media”, International Journal of Information Management, Vol. 35 No. 4, pp. 432-442.
Nadkarni, A. and Hofmann, S.G. (2012),“Why do people use Facebook?”, Personality and Individual Differences, Vol. 52 No. 3, pp. 243-249.
Nambisan, S. and Baron, R.A. (2007), “Interactions in virtual customer environments”, Journal of Interactive Marketing, Vol. 21 No. 2, pp. 42-62.
Pai, P. and Arnott, D.C. (2013), “User adoption of social networking sites”, Computers in Human Behavior, Vol. 29 No. 3, pp. 1039-1053.
Peters, O., Rickes, M., Jöckel, S., von Criegern, C. and van Deursen, A. (2006),“Explaining and analyzing audiences”, Communications, Vol. 31 No. 3, pp. 279-308.
Quan-Haase, A. and Young, A.L. (2010), “Uses and gratifications of social media: a comparison of Facebook and instant messaging”, Bulletin of Science, Technology & Society, Vol. 30 No. 5, pp. 350-361.
Raacke, J. and Bonds-Raacke, J. (2008),“MySpace and Facebook: applying the U&G theory to exploring friend-networking sites”, CyberPsychology & Behavior, Vol. 11 No. 2, pp. 169-174.
Rubin, A.M. (2009),“Uses and gratifications: an evolving perspective of media effects”, in Nabi, R.L. and Oliver, M.B. (Eds), The SAGE Handbook of Media Processes and Effects, SAGE, Thousand Oaks, CA, pp. 147-159.
Shao, G. (2009), “Understanding the appeal of user-generated media: a uses and gratification perspective”, Internet Research, Vol. 19 No. 1, pp. 7-25.
Singh, N., Lehnert, K. and Bostick, K. (2012),“Global social media usage”, Thunderbird International Business Review, Vol. 54 No. 5, pp. 683-700.
Smock, A.D., Ellison, N.B., Cliff Lampe, C. and Wohn, D.Y. (2011),“Facebook as a toolkit”, Computers in Human Behavior, Vol. 27 No. 6, pp. 2322-2329.
Subrahmanyama, K., Reich, S.M., Waechter, N. and Espinoza, G. (2008),“Online and offline social networks”, Journal of Applied Developmental Psychology, Vol. 29 No. 6, pp. 420-433.
Tsai, W.H. and Men, L.R. (2012), “Cultural values reflected in corporate pages on popular social network sites in China and the United States”, Journal of Research in Interactive Marketing, Vol. 6 No. 1, pp. 42-58.
Tsai, W.-H.S. and Men, L.R. (2013),“Motivations and antecedents of consumer engagement with brand pages on social networking sites”, Journal of Interactive Advertising, Vol. 13 No. 2, pp. 76-87. Tsai, W.-H.S. and Men, L.R. (2014),“Consumer engagement with brands on social network sites”,
Journal of Marketing Communications, Vol. 23 No. 1, pp. 1-20.
Vorvoreanu, M. (2009),“Perceptions of corporations on Facebook: an analysis of Facebook social norms”, Journal of New Communication Research, Vol. 4 No. 1, pp. 67-86.
Wang, Z., Tchernev, J.M. and Solloway, T. (2012),“A dynamic longitudinal examination of social media use, needs, and gratifications among college students”, Computers in Human Behavior, Vol. 28 No. 5, pp. 1829-1839.
Corresponding author