HAL Id: inserm-00353126
https://www.hal.inserm.fr/inserm-00353126
Submitted on 4 Jan 2010
HAL is a multi-disciplinary open access archive for the deposit and dissemination of sci-entific research documents, whether they are pub-lished or not. The documents may come from teaching and research institutions in France or
L’archive ouverte pluridisciplinaire HAL, est destinée au dépôt et à la diffusion de documents scientifiques de niveau recherche, publiés ou non, émanant des établissements d’enseignement et de recherche français ou étrangers, des laboratoires
Long working hours and cognitive function: the
Whitehall II Study.
Marianna Virtanen, Archana Singh-Manoux, Jane Ferrie, David Gimeno,
Michael Marmot, Marko Elovainio, Markus Jokela, Jussi Vahtera, Mika
Kivimäki
To cite this version:
Marianna Virtanen, Archana Singh-Manoux, Jane Ferrie, David Gimeno, Michael Marmot, et al.. Long working hours and cognitive function: the Whitehall II Study.. American Journal of Epidemi-ology, Oxford University Press (OUP), 2009, 169 (5), pp.596-605. �10.1093/aje/kwn382�. �inserm-00353126�
Long Working Hours and Cognitive Function: the Whitehall II Study
Marianna Virtanen1, PhD Jane E. Ferrie2, PhD Archana Singh-Manoux 2,3,4, PhD David Gimeno2, PhD Michael Marmot2, MD, PhD Marko Elovainio5, PhD Markus Jokela1, PhD Jussi Vahtera1, MD, PhD Mika Kivimäki2, PhD
1 Finnish Institute of Occupational Health, Topeliuksenkatu 41 a A, FIN-00250 Helsinki, Finland
2 Department of Epidemiology and Public Health, University College London, UK
3 INSERM U687-IFR69, France
4 Centre de Gérontologie, Hôpital Ste Périne, AP-HP, France
5 National Research and Development Centre for Welfare and Health, Helsinki, Finland
ABSTRACT
This study examined the association between long working hours and cognitive function in
middle age. Data were collected in 1997-1999 (baseline) and 2002-2004 (follow-up) from a
prospective study of 2214 British civil servants who were in full time employment at baseline
and had data on cognitive tests and covariates. A battery of cognitive tests (short-term memory,
Alice Heim 4-I, Mill Hill vocabulary, phonemic fluency and semantic fluency) were measured at
baseline and at follow-up. Compared with working 40 hours per week at most, working more
than 55 hours per week was associated with lower scores in the vocabulary test both at baseline
and at follow-up. Long working hours also predicted decline in performance on the reasoning
test. Similar results were obtained using working hours as a continuous variable; the associations
between working hours and cognitive function were robust to adjustments for several potential
confounding factors including age, sex, marital status, education, occupation, income, physical
diseases, psychosocial factors, sleep disturbances, and health risk behaviors. This study shows
Long working hours are common worldwide; for example in the European Union member states
12%-17% of employees worked overtime in 2001 (1). Long working hours have been found to
be associated with cardiovascular and immunological reactions, reduced sleep duration,
unhealthy life style,2-8 and adverse health outcomes, such as cardiovascular disease, diabetes,
subjective health complaints, fatigue (2-7), and depression (8). There is increasing evidence to
suggest the importance of midlife risk factors for later dementia (9). Furthermore, the link
between cognitive impairment and later life dementia is clearly established (10-11). Thus, it is
important to examine risk factors for poor cognition in midlife, and there is little research on the
potential effects of long working hours on cognition among middle-aged.
A cross sectional study of 248 automotive workers found an association between
overtime work and impaired performance on tests of attention and executive function (12). This
finding was in agreement with other studies that focused on different forms of shift work or work
schedule rather than on long working hours (13-14). For example, deterioration in cognitive
performance, including impaired grammatical reasoning and alertness, has been found in post vs
pretest conditions among employees working 9 to 12-hour shifts compared with a traditional
8-hour shift (13). However, little is known about the health effects of long total working 8-hours as
opposed to long hours of shift work.
This study examined the relationship between long working hours and cognitive
function over a five year follow-up period in a large-scale, prospective occupational cohort of
British CivilServants (the Whitehall II Study)(15). We were able to take into account several
factors that may act as confounders or mediators of this association, such as education,
occupational position, physical health status, psychological and psychosocial factors, sleep
MATERIALS AND METHODS
Participants and procedure
The Whitehall II study sample recruitment (Phase 1) took place between late 1985 and early
1988 among all office staff, aged 35 to 55, from 20 London based Civil Service departments
(15). The response rate was 73% (6895 men and 3413 women). Since Phase 1 there have been
seven further data collection phases. Informed consent was gained from all participants. The
University College London Medical School Committee on the Ethics of Human Research
approved the protocol.
As cognitive performance was measured on the whole sample for the first time at Phase
5, this Phase is used as baseline for the present study. We included all 2214 participants (1694
men and 520 women) who were employed and responded to the questions on working hours and
for whom the covariates and cognitive test scores were available at Phase 5 (1997-1999) and
Phase 7 (2002-2004). A flow chart of sample selection is shown in Figure 1. The mean age of the
2214 participants at Phase 5 was 52.1 (SD 4.2, range 45 to 66) years. There were no major
differences between the participants and all full-time employees who participated in phase 5
(n=3597) in terms of age (52.1 vs 52.4 years), sex (77% vs 75% male), occupational grade (18%
with the lowest occupational grade, vs 22%), and prevalence of coronary heart disease, CHD
(10% vs 11%). However, employees who participated in our study at phases 5 and 7 differed
from the cohort at recruitment to the Whitehall II study (n=10,308), in that they were younger
(mean age 40.6 vs 44.5 at phase 1), more likely to be male (77% vs 67%); from the higher
socioeconomic groups (10% with the lowest grade vs 23%) and less likely to have pre-existing
Tests of cognitive function
The cognitive function test battery at phases 5 and 7 consisted of five standard tasks chosen
to evaluate cognitive functioning in middle-aged adults. The first was verbal memory
assessed by a 20-word free recall test of short-term memory. Participants were presented a
list of 20 one or two syllable words at 2-second intervals and were then asked to recall in
writing as many of the words in any order within 2 minutes. The Alice Heim-I (AH 4-I)(16)
is a test of inductive reasoning that measures fluid intelligence, i.e. the ability to identify
patterns and infer principles and rules. This test is composed of a series of 65 items (32
verbal and 33 mathematical reasoning items) of increasing difficulty. The participants had
10 min to complete this section. The Mill Hill vocabulary test (17) assesses crystallized
intelligence, i.e. knowledge of verbal meaning and encompasses the ability to recognize and
comprehend words. We used this test in its multiple-choice format which consists of a list
of 33 stimulus words ordered by increasing difficulty, and six response choices per word.
The final two tests were measures of verbal fluency: phonemic and semantic (18).
Phonemic fluency was assessed via ‘‘S’’ words and semantic fluency via ‘‘animal’’ words.
Subjects were asked to recall in writing as many words beginning with ‘‘S’’ and as many
animal names as they could. One minute was allowed for each test of verbal fluency. A
higher score indicated better performance in each test.
The change score was calculated for each measure of cognitive function as Phase 7
score minus Phase 5 score. As the time interval between clinical examination at Phases 5
and 7 varied between 3.9 and 7.1 years (mean 5.5 years), the difference in cognitive score
was divided by the time in years between the two measures for each individual and
multiplied by 5 to give everyone the same (5-year) time period between the two phases of
Working hours and other baseline characteristics
Working hours were determined at Phase 5 from the following two questions: “How many hours
do you work per average week in your main job, including work brought home?”, and “How
many hours do you work in an average week in your additional employment?” Participants were
divided into the following three groups: a total of 35-40 hours; 41-55 hours; more than 55 hours
per week (5-7). In addition, analyses were conducted using the scale as a continuous variable.
Participants in the Whitehall II study are almost exclusively white-collar civil servants. The most
common weekly working hours correspond to 36 hours per week net although various flexible
working arrangements can also be arranged. In the present cohort, the mean working hours was
45.2 hours/week (S.D. 8.0, range 35 to 120).
Altogether 20 socio-demographic characteristics, behavioral, psychological,
psychosocial and medical conditions known to be associated with cognitive function and/or
working hours, were included as covariates in the analysis (2-9,12,19-38). In addition to sex
and age, marital status, indicators of socioeconomic position, i.e. occupational grade (6
levels from which the lowest two levels were collapsed to obtain sufficient numbers),
education (post graduate, graduate, higher secondary school, lower secondary school, or no
academic qualifications), and the participant's report of his/her annual gross salary were
assessed. Employment status (working vs. not working) at follow-up was obtained from the
Phase 7 questionnaire.
The physical functioning component score of the SF36(39) was used as a measure of
global physical health status and divided into quartiles separately for men and women. Prevalent
CHD at phase 5 included cases of non-fatal myocardial infarction (MI) and angina. In addition to
definite non-fatal MI and definite angina our total non-fatal CHD events outcome included
pressure and diastolic blood pressure were measured using the Hawksley random-zero
sphygmomanometer. In keeping with standard definitions, subjects with systolic blood
pressure≥140 mmHg and diastolic blood pressure≥90 mmHg or on antihypertensive treatment
were considered to be hypertensive (40).
Psychological distress was assessed using the 30-item General Health Questionnaire
(GHQ-30)(41). The GHQ-30 has been validated in a numberof diverse populations and has been
validated specifically againstthe Clinical Interview Schedule in Whitehall II data, givinga
cut-off point of 4/5 positive responses for dividing non-cases from cases (42). In addition, a 5-item
subscale of anxiety (e.g. feelings of constant strain, panic, nervousness) was derived from the
General Health Questionnaire (GHQ-30)(41). Scores in the top decile were used to define
anxiety cases, corresponding to the prevalence of anxiety disorders in the general population
(43).
Sleep was assessed in two ways; the first was a measure of duration with respondents
identified as short sleepers if they reported sleeping less than 6 hours on an average week night
(44). Sleep quality was assessed using the Jenkins Scale (45) which assesses sleep disturbances
during the past 4 weeks. The mean response score for all four questions was divided into tertiles.
Of the health behaviors, alcohol consumption (units/week) was classified into three
categories: none; >0 to 14 (women) / 21 (men) units; more than 14/21 units (46). Smoking was
assessed by a single question of whether the respondent was a current smoker or not. For the
physical activity score the participants were asked about the frequency and duration of their
participation in physical activity (47). The amount of time spent in activities with MET values
ranging from 0 to 6 or above was summed to allow calculation of total number of hours per week
Social support was measured by the 15-item Close Persons Questionnaire (48) which
includes questions about confiding/emotional support, practical support, and negative aspects of
close relationships. The mean of all responses was divided into tertiles. Strain in family relations
was measured with a single-item question of how often the participant had any worries or
problems with other relatives e.g. parents or in-laws (always/often vs
sometimes/seldom/never/not applicable). Job strain was formulated by splitting the job demands
score and decision latitude score at their medians. High demands and low decision latitude
indicated high job strain and other combinations indicated low job strain (49).
Statistical analysis
All analyses were carried out using SAS statistical software, version 9.1, except missing-data
analysis which was done using STATA 9.0 statistical software. First, we compared baseline
characteristics of the participants by working hours and compared the longer-hours group (>55
hours per week) with the employees with normal working hours (35-40 hours a week) using χ2
tests. We used multiple analysis of covariance (MANCOVA) to examine whether work hours
had an overall association with cognitive function, as checking for each measure of cognitive
function separately increases the chance of Type 1 error. Subsequently, ANOVA was used to
assess the association between work hours and individual measures of cognitive function. When
a significant difference was found in cognitive function tests at baseline and/or at follow-up
between groups additional analyses were carried out with the change score to assess temporal
order and examine whether the change was statistically significant. Sequential analyses were
undertaken to see whether adjustment for covariates attenuated the association between long
working hours and change in cognitive function. Age was entered into the models as a
recommended by Glymour et al. (50) we used baseline-unadjusted change scores for cognitive
change. In order to examine linear trend in the association between working hours and cognitive
function, we repeated the analysis using working hours as a continuous variable.
To explore whether selection bias might have occurred due to loss to follow-up we
undertook a sensitivity analysis in which we used multiple multivariate imputation (51) using
working hours, all covariates, cognition variables to impute values for missing values in any
variables with some missing data, amongst all 3163 participants free of stroke and TIA at
baseline. We used switching regression in Stata as described by Royston (51), and carried out 20
cycles of regression switching and generated 20 imputation datasets. The multiple multivariate
imputation approach creates a number of copies of the data (in this case we generated 20 copies)
each of which has values that are missing imputed with an appropriate level of randomness using
chained equations. The estimates are obtained by averaging across the results from each of these
20 datasets using Rubin’s rules. The procedure takes account of uncertainty in the imputation as
well as uncertainty due to random variation, as undertaken in all multivariable analyses.
RESULTS
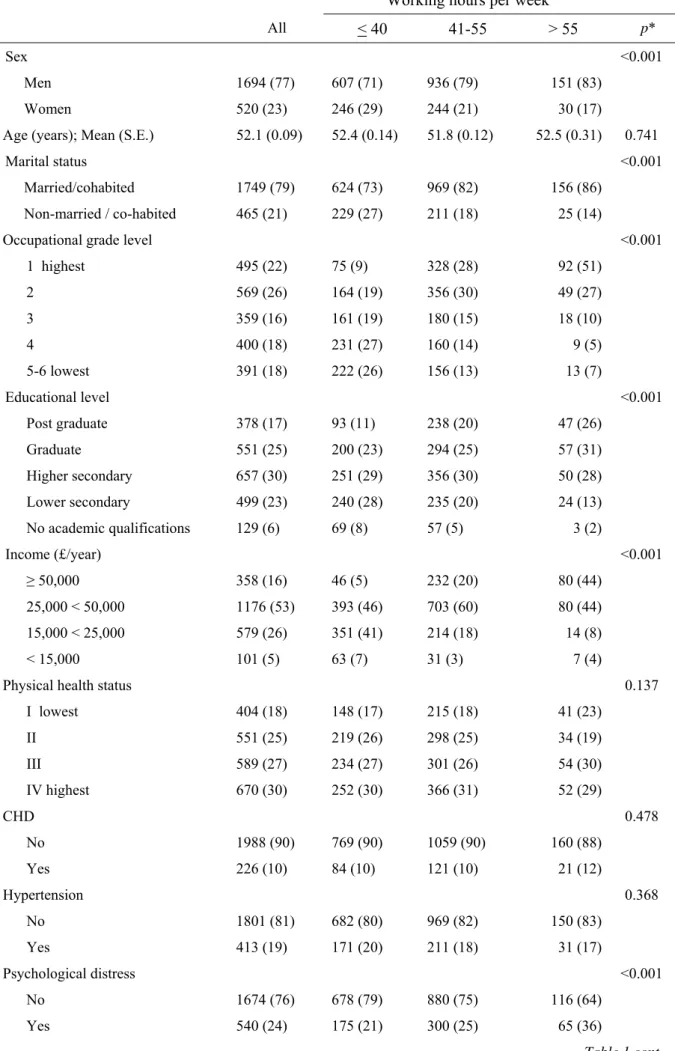
Characteristics of the study participants by working hours at baseline are shown in Table 1.
853 (39%) participants reported 35 to 40 hours of work per week, 1180 (53%) reported 41
to 55 hours, and 181 (8%) reported more than 55 hours of work per week. Compared to
employees with 35-40 hours, a higher percentage of those who worked more than 55 hours
were men and were married or cohabited, had a higher occupational grade, higher
education, higher income, more psychological distress, shorter sleep, higher alcohol use and
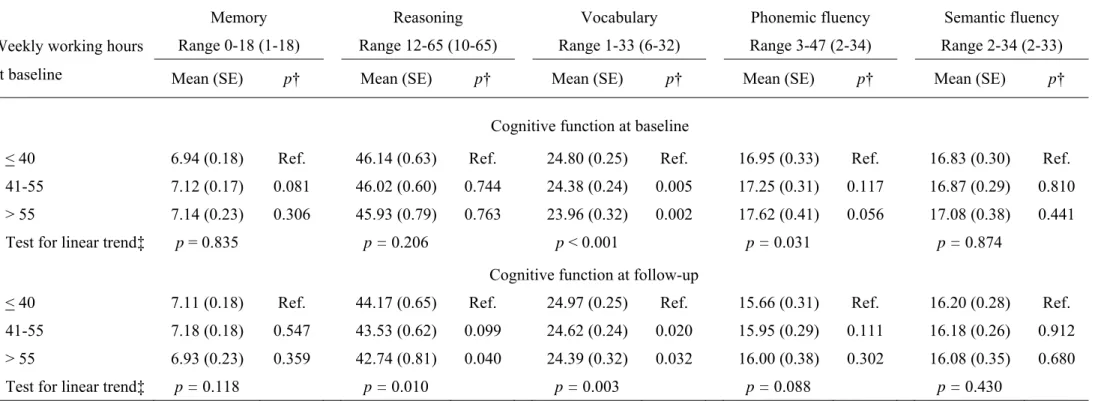
MANCOVA analysis revealed an overall association of working hours with
cognitive function at baseline (p=0.002) and follow-up (p=0.037) cognitive function as well
as change in cognitive function scores between baseline and follow-up (p=0.044). Table 2
shows the associations between working hours at baseline and each cognitive function
measure at baseline and at follow-up after adjustment for all covariates measured at
baseline. Compared to employees working ≤40 hours per week, employees working more
than 55 hours had lower vocabulary scores at baseline and at follow-up. At follow-up they
had lower scores also on the reasoning test. No significant difference between groups was
found in any other measures of cognitive function at follow-up. Repeating these analyses
with working hours treated as a continuous variable largely replicated the findings, and
additionally showed an association between working hours and better phonemic fluency at
baseline but not at follow-up.
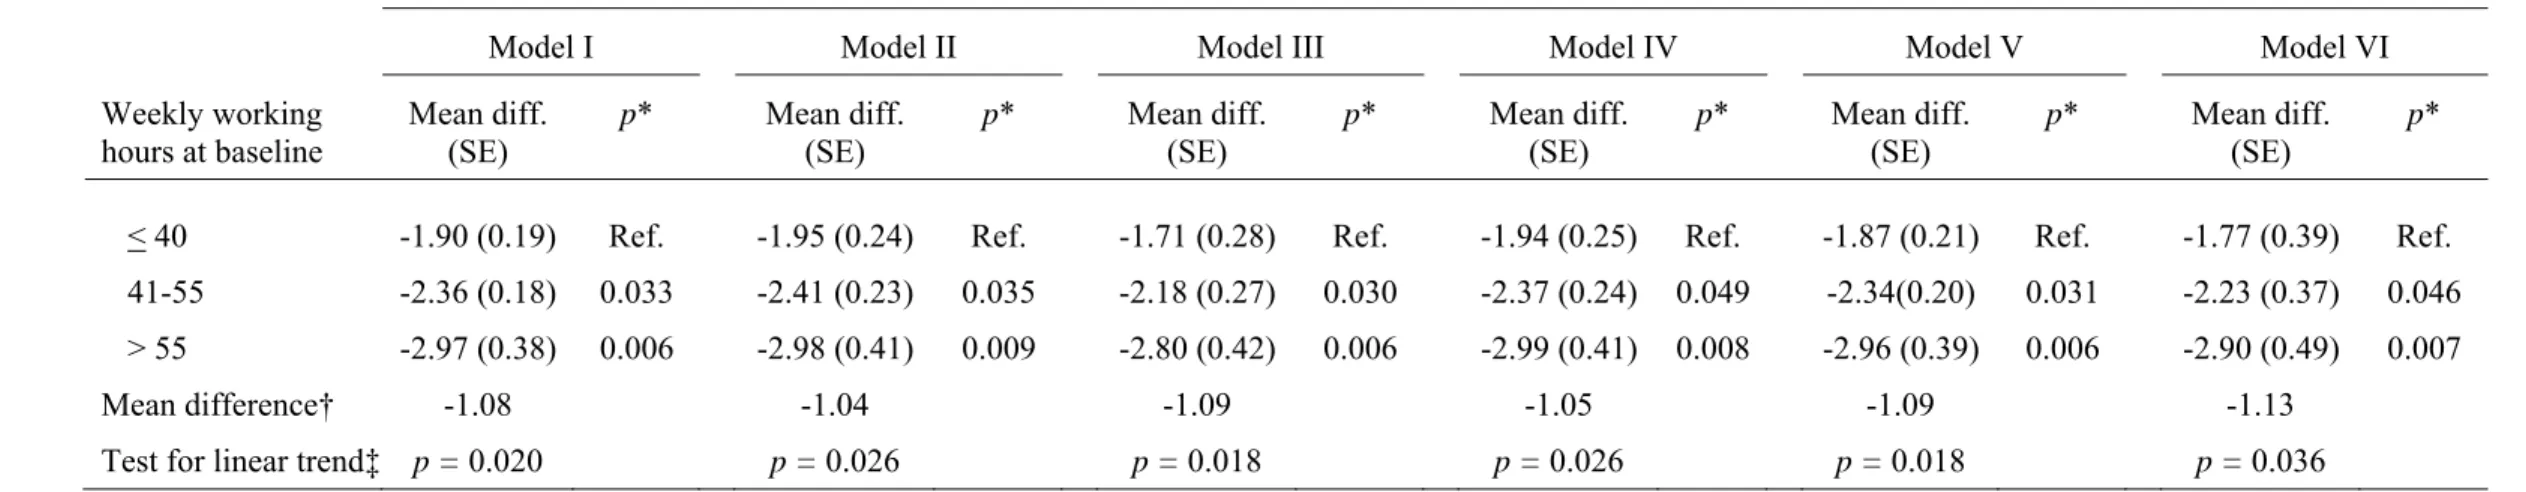
Table 3 examines the mean difference in the change in reasoning score between
those working normal hours and those working long hours. Successive models show the
effects of step-by-step adjustments. The stepwise adjustments show that various
adjustments produced little attenuation of the effect of working hours on decline in
reasoning score and a clear dose-response pattern was revealed between exposure and
outcome. Again the findings were replicated in models replacing categories with a
continuous measure of working hours.
Sensitivity analyses
To further examine whether the findings are robust, we ran a sensitivity analysis in
a sub-group of participants still employed at follow-up (n=1672, 1677). In line with the
reasoning score (difference -1.47, p=0.002) and lower scores in the vocabulary test at
baseline and at up (difference -0.77, p=0.009 at baseline; -0.60, p=0.046 at
follow-up). Corresponding p-values for the continuous working hours were p=0.009, p=0.004, and
p=0.023.
To examine sex differences, we conducted altogether 15 tests of interaction
between sex and continuous working hours on cognitive function outcomes and found two
statistically significant interactions; for the vocabulary test at baseline (p=0.015) and at
follow-up (p=0.003). Sex-stratified analysis showed a significant negative association
between working hours and vocabulary score at baseline and at follow-up among men
(p-values <0.001) but not among women (p-(p-values 0.899 and 0.339).
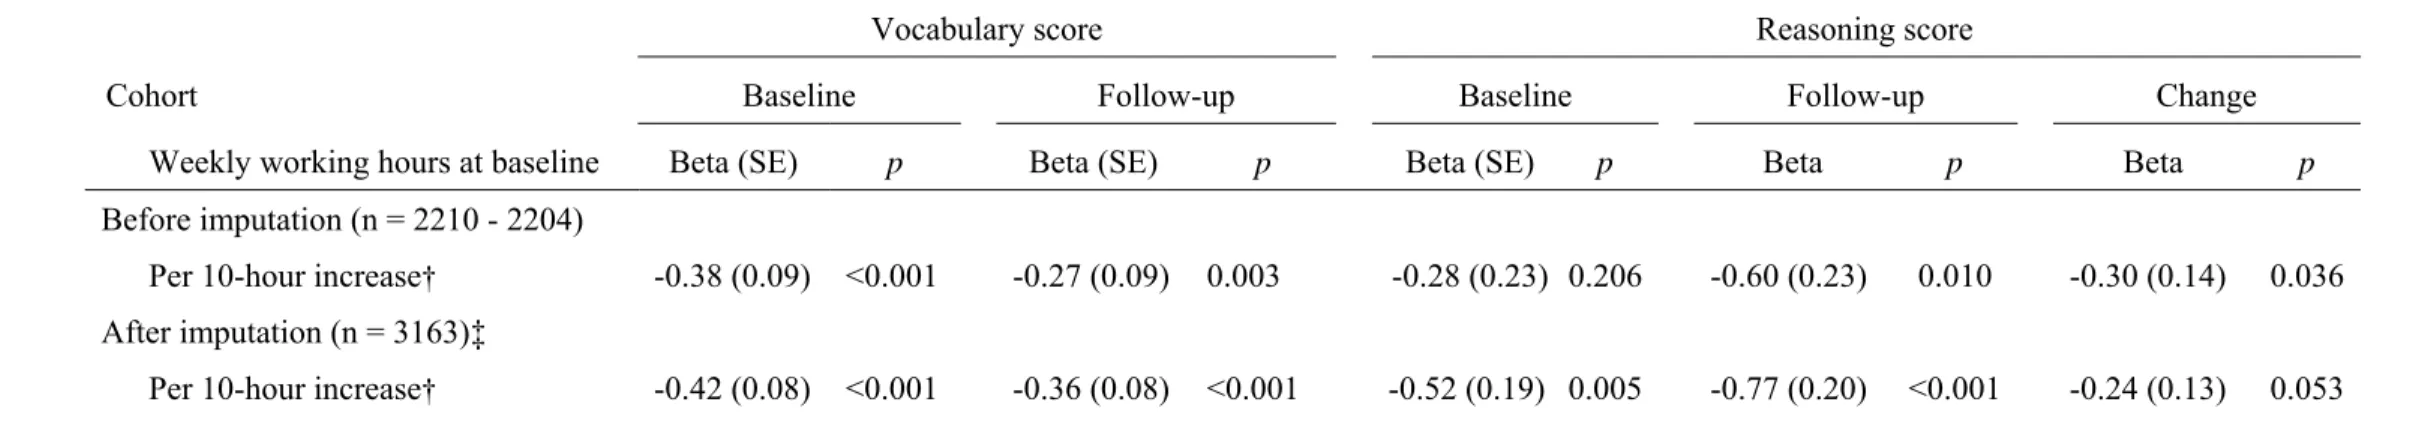
Finally, table 4 repeats the analyses on those associations which were found to be
robust in tables 2 and 3, except that the results were obtained from the multiple multivariate
imputation analysis for the baseline population, a total of 3163 participants. To simplify
comparison of cohorts before and after imputations, we present effects of working hours as
per 10 hours increase in a continuous measure. Imputation had little effect on the
associations with vocabulary at baseline and follow-up and reasoning at follow-up. The
association with reasoning at baseline was strengthened considerably but the association
with change in reasoning was slightly attenuated (p=0.053). Corresponding p-values for
categorical working hours variable were as follows: between the groups of >55 hours vs
≤40 hours, p<0.001 for vocabulary score at baseline and follow-up; p=0.068 for reasoning
score at baseline; p=0.002 for reasoning at follow-up; and p=0.025 for the change score in
DISCUSSION
In this study of middle-aged men and women, working more than 55 hours per week was
associated with lower scores on two of the five tests of cognitive function. Long working hours
at baseline were related to poorer performance in the vocabulary test both at baseline and at
follow-up. Furthermore, long working hours predicted decline in performance on the reasoning
test over a 5-year follow-up period. These effects were robust to adjustments for 20 potential
confounding factors, such as education, occupational position, physical diseases (cardiovascular
dysfunction), psychosocial stress factors, sleep problems, and health risk behaviors.
We found an association between long working hours and decline in the scores for the
AH 4-I reasoning test and associations with the Mill Hill Vocabulary tests at baseline and at
follow-up. AH 4-I is also recognised as a measure of fluid intelligence, i.e. executive function or
“meta” cognitive ability as it integrates other cognitive processes like memory, attention, and
speed of information processing. Fluid intelligence is seento be intrinsically associated with
information processing andinvolves short-term memory, abstract thinking, creativity, abilityto
solve novel problems, and reaction time. It is the aspect of intelligence most affected by aging,
biological factors, diseases, and injuries (52,53). Fluid intelligence usually increases up to the
mid-20s after which it gradually declines until the 60s when a more rapid decline takes place.
The Mill Hill vocabulary test measures crystallized intelligence which is assumed to
accumulate during the lifespan through education, occupational and cultural experience and
exposure to culture and intellectual pursuits (52,53). Crystallized abilities usually increases up to
the sixth or seventh decade of age and may not decrease until after 80 years of age. We found the
Mill Hill scores to remain relatively stable as expected for this middle aged cohort. However, the
follow-up. This consistency with two separate measures with a 5-year interval suggests not only
a plausible finding but also stability of the far-reaching effect of long working hours on
vocabulary. We did not find an interaction effect between follow-up employment status and
working hours on significant outcomes which suggests that the associations found are not
dependent on employment status at follow-up. However, people who work long hours might be
exposed to a narrower variation of intellectual pursuits i.e. only to those that are related to their
work tasks and therefore might not be able to develop a wide variety of functions in crystallized
intelligence measured in the test. However, reversed causality is also possible: employees with
lower cognitive ability may be more prone to work overtime than workers with good cognitive
ability in order to get their work done.
Previous literature, mostly cross sectional, suggests that long working hours are
associated with various health outcomes, the strongest effects observed for cardiovascular
diseases, fatigue, and sleep disturbances (2-8). These can also be hypothesized to be mediating
mechanisms for the association between long working hours and cognitive decline. Hypertension
is associated with cognitive dysfunction by producing subtle disturbances in cerebral perfusion
and affecting brain cell metabolism (19-20). However, we found no evidence of an association
between long working hours and hypertension or CHD suggesting that the effect of long hours
on cardiovascular dysfunction, if any, is unlikely to explain cognitive decline in this study.
Another hypothesis on mediating mechanisms links long working hours with
psychological stress and poor recovery from work as indicated by sleeping problems and reduced
sleep. Psychological stress has been suggested as affecting the brain via two neuroendocrine
systems; the sympathetic adrenomedullary system with the secretion of epinephrine and
norepinephrine, and the hypothalamic pituitary adrenocortical (HPA) system with the secretion
long working hours and neuroendocrinological stress markers (55). We found that long working
hours were associated with short sleep duration and psychological distress but not with sleep
disturbances. Further adjustment for these factors did not provide support for the hypothesis that
psychological distress and poor recovery act as mediating mechanisms.
The third hypothesis suggests that long working hours may affect cognitive function
through health risk behaviors. Evidence on the association between long working hours and
unhealthy behaviors is weak, but there is stronger evidence for the relationship between health
behaviors and cognitive function (22-24,26). We found that adjustment for all these health risk
behaviors had no effect on the association between long working hours and cognitive function,
suggesting that health risk behaviors may not be an important mediating or confounding
variable.
When working hours was entered into the model as a continuous variable, we
found an association between long hours and better phonemic fluency at baseline but not at
follow-up. This inconsistency is also reflected in the lack of an association between the
categorical working hours and phonemic fluency. More research is needed to determine
whether employees with long working hours do better than other employees on tests of
verbal fluency. Out of 15 analyses, we found two statistically significant interaction effects
between working hours and sex and sex-stratified analysis showed that long working hours
were associated with poorer vocabulary performance among men but not among women.
However, further research with larger samples is needed to examine potential sex
Strengths and limitations
The strengths of this study include large sample size and the possibility to explore
prospectively the association between long working hours and a possible change in cognitive
function over a 5-year interval which has not been feasible in earlier studies. Furthermore, we
used five separate measures of cognitive function, allowing associations with specific aspects of
cognition to be observed, and we were able to adjust for a large number of covariates as potential
confounding or mediating factors between the exposure and outcome.
There are also important limitations in this study. First, the period of 5 years for
cognitive decline might not be sufficient to detect a significant decline in cognitive function in
general. Second, the Whitehall II cohort is based on civil servants and not representative of the
entire working population, limiting the generalisability of our results. Third, we used
self-reported working hours, with inherent problems of recall. Fourth, middle-aged occupational
cohorts, such as ours, are subject to a healthy survivor effect as the study design involves
participants being employed and gradually excludes those who develop work disability.
However, all cohort studies focusing on work-related exposures at midlife are open to
health-related selection because participants need to be employed. Because poor health is linked with
worse cognition, healthy survivor effect is likely to lead to conservative estimates of the
associations found. The baseline of the present study was approximately 15 years after inclusion
into the Whitehall II study; men, employees in the higher occupational grades, and those free
from CHD were slightly over-represented. However, the associations between work hours,
vocabulary and reasoning were robust to adjustments for sex, occupational grade and health.
Furthermore, similarity of these associations in the complete case and multiple imputation
analyses suggests that loss-to-follow-up after the baseline is an unlikely source of bias in this
Conclusions
Decline in cognitive function has already been shown to be present among the
middle-aged (9). As mild cognitive impairment predicts dementia (10,11) and mortality
(56-58),the identification of risk factors for mild cognitive impairment in middle age is
important. The results of this study show that long working hours may be one of the risk
factors that have a negative effect on cognitive performance in middle age. Our findings can
have clinical significance as the 0.6 to 1.4-unit difference in aspects of cognitive
functioning between employees working long hours and those working normal hours is of
the similar magnitude as smoking, a risk factor for dementia (59), has been found to have
on cognition in the Whitehall II study (60). However, further research is needed to identify
potential underlying factors for the relationship between long working hours and cognitive
REFERENCES
1. Vaguer C, Van Bastelaer A. Working overtime. Statistics in Focus, Population and Social Conditions, European Communities 11, 2004.
2. van der Hulst M. Long workhours and health. Scand J Work Environ Health 2003;29:171−88.
3. Caruso CC, Hitchcock EM, Dick RB, et al. Overtime and extended work shifts: Recent findings on illnesses, injuries, and health behaviors. NIOSH: Department of Health and Human Services, 2004.
4. Johnson JV, Lipscomb J. Long working hours, occupational health and the changing nature of work organization. Am J Ind Med 2006;49:921−9.
5. Sokejima S, Kagamimori S. Working hours as a risk factor for acute myocardial infarction in Japan: case-control study. BMJ 1998;317:775−80.
6. Liu Y, Tanaka H, The Fukuoka Heart Study Group. Overtime work, insufficient sleep, and risk of non-fatal acute myocardial infarction in Japanese men. Occup Environ Med 2002;59;447−51.
7. Sekine M, Chandola T, Martikainen P, Marmot M, Kagamimori S. Work and family characteristics as determinants of socioeconomic and sex inequalities in sleep: The Japanese Civil Servants Study. Sleep 2006;29:206−16.
8. Shields M. Long working hours and health. Health Rep 1999;11:33-48.
9. Kivipelto M, Ngandu T, Laatikainen T, et al. Risk score for the prediction of dementia risk in 20 years among middle aged people: a longitudinal, population-based study. Lancet Neurol 2006;59:735−41.
10. Chertkow H. Mild cognitive impairment. Curr Opin Neurol 2002;15:401-7
11. Morris JC, Storandt M, Miller JP, et al. Mild cognitive impairment represents early-stage Alzheimer disease. Arch Neurol 2001;58:397−405.
12. Proctor SP, White RF, Robins TG, et al. Effect of overtime work on cognitive function in automotive workers. Scand J Work Environ Health 2006;22:124−32.
13. Lockley SW, Cronin JW, Evans EE, et al. Effect of reducing interns’ weekly work hours on sleep and attentional failures. N Engl J Med 2004;351:1829−37.
15. Marmot M, Brunner E. Cohort profile: The Whitehall II Study. Int J Epidemiol 2005;34:251−6.
16. Heim AW. AH 4 group test of general intelligence ASE. Windsor, UK: NFER-Nelson Publishing Company Ltd, 1970.
17. Raven JC. Guide to using the Mill Hill vocabulary scale with progressive matrices. London: HK Lewis, 1965.
18. Borkowski JG, Benton AL, Spreen O. Word fluency and brain damage. Neuropsychologica 1967;5:135−40.
19. Launer LJ, Masaki K, Petrovich H, et al. The association between mid-life blood pressure levels and late-life cognitive function: the Honolulu-Asia Aging Study, JAMA
1995;274:1846−51.
20. Breteler MM. Vascular involvement in cognitive decline and dementia. Epidemiologic evidence from the Rotterdam Study and the Rotterdam Scan Study. Ann N Y Acad Sci 2000;903:457−65.
21. Singh-Manoux A, Sabia S, Lajnef M, et al. History of coronary heart disease and cognitive performance in midlife: the Whitehall II study. Eur Heart J 2008;29:2100−7. 22. Swan G, Lessow-Schlaggar CN. The effects of tobacco smoke and nicotine on cognition
and the brain. Neuropsychol Rev 2007;17:259−73.
23. Silvers JM, Tokunaga S, Berry RB, et al. Impairments in spatial learning and memory: ethanol, allopregnanolone, and the hippocampus. Brain Res Brain Res Rev
2003;43:275−84.
24. Espeland MA, Gu L, Masaki KH, et al. Association between reported alcohol intake and cognition: results from the Women's Health Initiative Memory Study. Am J Epidemiol 2005;161:228−38.
25. Britton A, Singh-Manoux A, Marmot M. Alcohol consumption and cognitive function in the Whitehall II Study. Am J Epidemiol 2004;160:240−7.
26. Colcombe S, Kramer AF. Fitness effects on the cognitive function of older adults: a meta-analytic study. Psychol Sci 2003;14:125−30.
27. Bassuk SS, Berkman LF, Wypij D. Depressive symptomatology and incident cognitive decline in an elderly community sample. Arch Gen Psychiatry 1998;55:1073−81. 28. Yaffe K, Blackwell T, Gore R, et al. Depressive symptoms and cognitive decline in
29. Philibert I. Sleep loss and performance in residents and nonphysicians: a meta-analytic examination. Sleep 2005;28:1392−1402.
30. Singh-Manoux A, Richards M, Marmot M. Socioeconomic position across the lifecourse: how does it relate to cognitive function in mid-life? Ann Epidemiol 2005;15:572−8. 31. Lee S, Buring JE, Cook NR, et al. The relation of education and income to cognitive
function among professional women. Neuroepidemiology 2006;26:93−101.
32. Koster A, Penninx BW, Bosma H, et al. Socioeconomic differences in cognitive decline and the role of biomedical factors. Ann Epidemiol 2005;15:564−71.
33. Glymour MM, Weuve J, Fay ME, et al. Social ties and cognitive recovery after stroke: does social integration promote cognitive resilience? Neuroepidemiology 2008;31:10−20. 34. Bassuk SS, Glass TA, Berkman LF. Social disengagement and incident cognitive decline
in community-dwelling elderly persons. Ann Intern Med 1999;131:165−73.
35. Lee S, Kawachi I, Grodstein F. Does caregiving stress affect cognitive function in older women? J Nerv Ment Dis 2004;192:51−7.
36. Crowe M, Andel R, Pedersen NL, et al. Personality and risk of cognitive impairment 25 years later. Psychol Aging 2006;21:573−80.
37. Lupien SJ, Maheu F, Tu M, et al. The effects of stress and stress hormones on human cognition: Implications for the field of brain and cognition. Brain Cognition
2007;65:209−37.
38. Potter GG, Helms MJ, Plassman BL. Association of job demands and intelligence with cognitive performance among men in late life. Neurology 2008;70:1803−8.
39. Ware JE, Kosinski M, Bayliss MS, et al. Comparison of methods for the scoring and statistical analysis of SF-36 health profile and summary measures: Summary of results from the medical outcomes study. Med Care 1995;33:264−79.
40. Kivimäki M, Head J, Ferrie JE, et al. Hypertension is not the link between job strain and coronary heart disease in the Whitehall II Study. Am J Hypertension 2007;20:1146−53. 41. Goldberg DP. The detection of psychiatric illness by questionnaire. London, UK: Oxford
University Press, 1972.
42. Stansfeld SA, Marmot MG. Social class and minor psychiatric disorder in British Civil Servants: a validated screening survey using the General Health Questionnaire. Psychol Med 1992; 22:739−49.
43. Jenkins R, Lewis G, Bebbington P, et al. The National Psychiatric Morbidity Surveys of Great Britain - initial findings from the Household Survey. Psychol Med
1997;27:775−89.
44. Ferrie JE, Shipley MJ, Cappuccio FP, et al. A prospective study of change in sleep duration: associations with mortality in the Whitehall II cohort. Sleep 2007;30:1659−66. 45. Jenkins D, Stanton BA, Niemcryk S, et al. A scale for the estimation of sleep problems in
clinical research. J Clin Epidemiol 1988;41:313–21.
46. White I, Altmann DR, Nanchahal K. Mortality in England and Wales attributable to any drinking, drinking above sensible limits and drinking above lowest risk level. Addiction 2004;99:749−56.
47. Kujala UM, Sarna S, Kaprio J, et al. Hospital care in later life among former world-class Finnish athletes. JAMA 1996;276:216−20.
48. Stansfeld SA, Marmot MG. Deriving a survey measure of social support: The reliability and validity of the close persons questionnaire. Soc Sci Med 1992;35:1027−35.
49. Karasek RA. Job demands, job decision latitude and mental strain: implications for job redesign. Admin Sci Quart 1979;24:285–308.
50. Glymour M, Weuve J, Berkman LF, et al. When is baseline adjustment useful in analyses of change? An example with education and cognitive function. Am J Epidemiol
2005;162:267−78.
51. Royston P. Multiple imputation of missing values. Stata Journal 2004;4:227−41.
52. Christensen H. What cognitive changes can be expected with normal ageing? Aust N Z J Psychiatry 2001;35:768−75.
53. Blair C. How similar are fluid cognition and general intelligence? A developmental neuroscience perspective on fluid cognition as an aspect of human cognitive ability. Beh Brain Sci 2006;29:109−60.
54. Lundberg U. Stress hormones in health and illness: The roles of work and gender. Psychoneuroendocrinology 2005;30:1017−21.
55. Garde AH, Faber A, PerssonR, et al. Concentrations of cortisol, testosterone and
glycosylated haemoglobin (HbA1c) among construction workers with 12-h workdays and extended workweeks. Int Arch Occup Environ Health 2007;80:404−11.
56. Sabia S, Guéguen A, Marmot MG, et al. Does cognition predict mortality in midlife? Results from the Whitehall II cohort study. Neurobiol Aging 2008 Jun 7 [Epub ahead of print].
57. Pavlik VN, Alves de Moraes S, Szklo M, et al. Relation between cognitive function and mortality in middle-aged adults. The Atherosclerosis Risk in Communities Study. Am J Epidemiol 2003;157:327−34.
58. Portin ML, Muuriaisniemi M, Joukamaa S, et al. Cognitive impairment and the 10-year survival probability of a normal 62-year-old population. Scand J Psychol 2001;42:359– 66.
59. Anstey KJ, von Sanden C, Salim A, et al. Smoking as a risk factor for dementia and cognitive decline: a meta-analysis of prospective studies. Am J Epidemiology 2007;166:367−78.
60. Sabia S, Marmot M, Dufouil C, et al. Smoking history and cognitive function in middle-age in Whitehall II study. Arch Intern Med 2008;168:1165−73.
Figure 1. Sample selection.
Cognitive test at baseline (n=6073)
Cognitive test and full time work at baseline (n=3180)
Missing data on employment status (n=37), not working (n=2007), missing data on work hours (n=201), has part time job (n=648), at baseline
Stroke/TIA (n=17) at baseline or missing data on any of the covariates (n=667) Cognitive test, full time
work, complete data on covariates, no
stroke/TIA at baseline (n=2496)
Final sample (n=2214)
Cognitive test missing (n=272), employment status missing (n=10) at follow-up
TABLE 1. Characteristics of the participants by working hours at baseline, the Whitehall II Study 1997-2004
Working hours per week
All < 40 41-55 > 55 p*
Sex <0.001
Men 1694 (77) 607 (71) 936 (79) 151 (83) Women 520 (23) 246 (29) 244 (21) 30 (17)
Age (years); Mean (S.E.) 52.1 (0.09) 52.4 (0.14) 51.8 (0.12) 52.5 (0.31) 0.741
Marital status <0.001
Married/cohabited 1749 (79) 624 (73) 969 (82) 156 (86) Non-married / co-habited 465 (21) 229 (27) 211 (18) 25 (14)
Occupational grade level <0.001 1 highest 495 (22) 75 (9) 328 (28) 92 (51) 2 569 (26) 164 (19) 356 (30) 49 (27) 3 359 (16) 161 (19) 180 (15) 18 (10) 4 400 (18) 231 (27) 160 (14) 9 (5) 5-6 lowest 391 (18) 222 (26) 156 (13) 13 (7) Educational level <0.001 Post graduate 378 (17) 93 (11) 238 (20) 47 (26) Graduate 551 (25) 200 (23) 294 (25) 57 (31) Higher secondary 657 (30) 251 (29) 356 (30) 50 (28) Lower secondary 499 (23) 240 (28) 235 (20) 24 (13) No academic qualifications 129 (6) 69 (8) 57 (5) 3 (2) Income (£/year) <0.001 ≥ 50,000 358 (16) 46 (5) 232 (20) 80 (44) 25,000 < 50,000 1176 (53) 393 (46) 703 (60) 80 (44) 15,000 < 25,000 579 (26) 351 (41) 214 (18) 14 (8) < 15,000 101 (5) 63 (7) 31 (3) 7 (4)
Physical health status 0.137
I lowest 404 (18) 148 (17) 215 (18) 41 (23) II 551 (25) 219 (26) 298 (25) 34 (19) III 589 (27) 234 (27) 301 (26) 54 (30) IV highest 670 (30) 252 (30) 366 (31) 52 (29) CHD 0.478 No 1988 (90) 769 (90) 1059 (90) 160 (88) Yes 226 (10) 84 (10) 121 (10) 21 (12) Hypertension 0.368 No 1801 (81) 682 (80) 969 (82) 150 (83) Yes 413 (19) 171 (20) 211 (18) 31 (17) Psychological distress <0.001
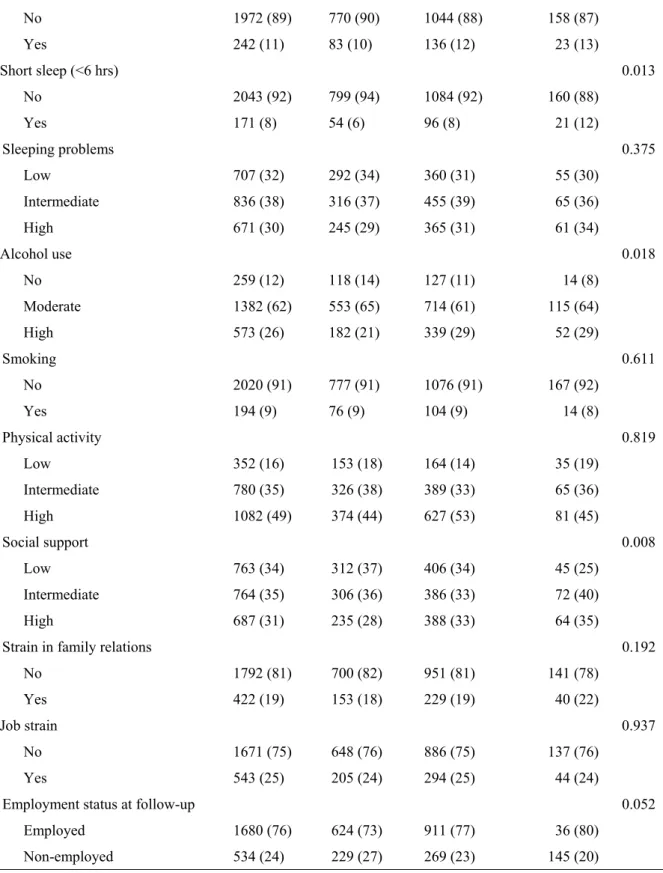
Table 1 cont. Anxiety 0.230 No 1972 (89) 770 (90) 1044 (88) 158 (87) Yes 242 (11) 83 (10) 136 (12) 23 (13) Short sleep (<6 hrs) 0.013 No 2043 (92) 799 (94) 1084 (92) 160 (88) Yes 171 (8) 54 (6) 96 (8) 21 (12) Sleeping problems 0.375 Low 707 (32) 292 (34) 360 (31) 55 (30) Intermediate 836 (38) 316 (37) 455 (39) 65 (36) High 671 (30) 245 (29) 365 (31) 61 (34) Alcohol use 0.018 No 259 (12) 118 (14) 127 (11) 14 (8) Moderate 1382 (62) 553 (65) 714 (61) 115 (64) High 573 (26) 182 (21) 339 (29) 52 (29) Smoking 0.611 No 2020 (91) 777 (91) 1076 (91) 167 (92) Yes 194 (9) 76 (9) 104 (9) 14 (8) Physical activity 0.819 Low 352 (16) 153 (18) 164 (14) 35 (19) Intermediate 780 (35) 326 (38) 389 (33) 65 (36) High 1082 (49) 374 (44) 627 (53) 81 (45) Social support 0.008 Low 763 (34) 312 (37) 406 (34) 45 (25) Intermediate 764 (35) 306 (36) 386 (33) 72 (40) High 687 (31) 235 (28) 388 (33) 64 (35)
Strain in family relations 0.192 No 1792 (81) 700 (82) 951 (81) 141 (78)
Yes 422 (19) 153 (18) 229 (19) 40 (22)
Job strain 0.937
No 1671 (75) 648 (76) 886 (75) 137 (76) Yes 543 (25) 205 (24) 294 (25) 44 (24)
Employment status at follow-up 0.052 Employed 1680 (76) 624 (73) 911 (77) 36 (80)
Non-employed 534 (24) 229 (27) 269 (23) 145 (20)
TABLE 2. Association between working hours at baseline and cognitive function at baseline and at follow-up, fully adjusted models*, the Whitehall II Study
1997-2004
Weekly working hours at baseline Memory Range 0-18 (1-18) Reasoning Range 12-65 (10-65) Vocabulary Range 1-33 (6-32) Phonemic fluency Range 3-47 (2-34) Semantic fluency Range 2-34 (2-33) Mean (SE) p† Mean (SE) p† Mean (SE) p† Mean (SE) p† Mean (SE) p†
Cognitive function at baseline
< 40 6.94 (0.18) Ref. 46.14 (0.63) Ref. 24.80 (0.25) Ref. 16.95 (0.33) Ref. 16.83 (0.30) Ref. 41-55 7.12 (0.17) 0.081 46.02 (0.60) 0.744 24.38 (0.24) 0.005 17.25 (0.31) 0.117 16.87 (0.29) 0.810 > 55 7.14 (0.23) 0.306 45.93 (0.79) 0.763 23.96 (0.32) 0.002 17.62 (0.41) 0.056 17.08 (0.38) 0.441
Test for linear trend‡ p = 0.835 p = 0.206 p < 0.001 p = 0.031 p = 0.874
Cognitive function at follow-up
< 40 7.11 (0.18) Ref. 44.17 (0.65) Ref. 24.97 (0.25) Ref. 15.66 (0.31) Ref. 16.20 (0.28) Ref. 41-55 7.18 (0.18) 0.547 43.53 (0.62) 0.099 24.62 (0.24) 0.020 15.95 (0.29) 0.111 16.18 (0.26) 0.912 > 55 6.93 (0.23) 0.359 42.74 (0.81) 0.040 24.39 (0.32) 0.032 16.00 (0.38) 0.302 16.08 (0.35) 0.680
Test for linear trend‡ p = 0.118 p = 0.010 p = 0.003 p = 0.088 p = 0.430
Note. In each cognitive test higher score indicates better cognitive performance.
*Adjusted for age, sex, marital status, follow-up employment status, occupational grade, education, income, physical health indicators, psychological distress, anxiety, sleep problems, health risk behaviors, social support, family stress, and job strain.
† P for difference with the reference group with <40 working hours per week.
TABLE 3. Stepwise adjustments of the association between working hours at baseline and change in reasoning score between baseline and follow-up, the Whitehall II Study 1997-2004
Change in reasoning score
Model I Model II Model III Model IV Model V Model VI
Weekly working hours at baseline Mean diff. (SE) p* Mean diff. (SE) p* Mean diff. (SE) p* Mean diff. (SE) p* Mean diff. (SE) p* Mean diff. (SE) p* < 40 -1.90 (0.19) Ref. -1.95 (0.24) Ref. -1.71 (0.28) Ref. -1.94 (0.25) Ref. -1.87 (0.21) Ref. -1.77 (0.39) Ref. 41-55 -2.36 (0.18) 0.033 -2.41 (0.23) 0.035 -2.18 (0.27) 0.030 -2.37 (0.24) 0.049 -2.34(0.20) 0.031 -2.23 (0.37) 0.046 > 55 -2.97 (0.38) 0.006 -2.98 (0.41) 0.009 -2.80 (0.42) 0.006 -2.99 (0.41) 0.008 -2.96 (0.39) 0.006 -2.90 (0.49) 0.007
Mean difference† -1.08 -1.04 -1.09 -1.05 -1.09 -1.13
Test for linear trend‡ p = 0.020 p = 0.026 p = 0.018 p = 0.026 p = 0.018 p = 0.036
Model I: adjusted for age, sex, marital status and follow-up employment status. Model II: Model I + additionally adjusted for physical health indicators.
Model III: Model I + additionally adjusted for psychological distress, anxiety, and sleep problems. Model IV: Model I + additionally adjusted for health risk behaviors.
Model V: Model I + additionally adjusted for social support, family stress and job strain.
Model VI: Adjusted for all covariates in models I, II, III, IV, V + occupational grade, education, and income. *P for difference with the reference group working <40 hours per week.
† Difference in mean between the group working >55 hours and the group working <40 hours per week.
TABLE 4. Multivariable-adjusted* associations between working hours, vocabulary and reasoning for participants before and after imputation of missing data imputed, the Whitehall II Study 1997-2004
Vocabulary score Reasoning score
Cohort Baseline Follow-up Baseline Follow-up Change
Weekly working hours at baseline Beta (SE) p Beta (SE) p Beta (SE) p Beta p Beta p Before imputation (n = 2210 - 2204)
Per 10-hour increase† -0.38 (0.09) <0.001 -0.27 (0.09) 0.003 -0.28 (0.23) 0.206 -0.60 (0.23) 0.010 -0.30 (0.14) 0.036
After imputation (n = 3163)‡
Per 10-hour increase† -0.42 (0.08) <0.001 -0.36 (0.08) <0.001 -0.52 (0.19) 0.005 -0.77 (0.20) <0.001 -0.24 (0.13) 0.053
*Adjusted for age, sex, marital status, follow-up employment status, occupational grade, education, income, physical health indicators, psychological distress, anxiety, sleep problems, health risk behaviors, social support, family stress, job strain.
†Continuous variable for working hours ‡Based on multiple multivariate imputations.