HAL Id: hal-01806814
https://hal.archives-ouvertes.fr/hal-01806814
Submitted on 27 Oct 2020
HAL is a multi-disciplinary open access
archive for the deposit and dissemination of
sci-entific research documents, whether they are
pub-lished or not. The documents may come from
teaching and research institutions in France or
abroad, or from public or private research centers.
L’archive ouverte pluridisciplinaire HAL, est
destinée au dépôt et à la diffusion de documents
scientifiques de niveau recherche, publiés ou non,
émanant des établissements d’enseignement et de
recherche français ou étrangers, des laboratoires
publics ou privés.
afforestation and vegetation greening in China
Yue Li, Shilong Piao, Laurent Li, Anping Chen, Xu Wang, Philippe Ciais,
Ling Huang, Xu Lian, Shushi Peng, Zhenzhong Zeng, et al.
To cite this version:
Yue Li, Shilong Piao, Laurent Li, Anping Chen, Xu Wang, et al.. Divergent hydrological response to
large-scale afforestation and vegetation greening in China. Science Advances , American Association
for the Advancement of Science (AAAS), 2018, 4 (5), �10.1126/sciadv.aar4182�. �hal-01806814�
A T M O S P H E R I C S C I E N C E Copyright © 2018 The Authors, some rights reserved; exclusive licensee American Association for the Advancement of Science. No claim to original U.S. Government Works. Distributed under a Creative Commons Attribution NonCommercial License 4.0 (CC BY-NC).
Divergent hydrological response to large-scale
afforestation and vegetation greening in China
Yue Li,1Shilong Piao,1,2,3* Laurent Z. X. Li,4Anping Chen,5Xuhui Wang,1Philippe Ciais,6
Ling Huang,1Xu Lian,1Shushi Peng,1Zhenzhong Zeng,1Kai Wang,1 Liming Zhou7
China has experienced substantial changes in vegetation cover, with a 10% increase in the leaf area index and an ~41.5 million-hectare increase in forest area since the 1980s. Earlier studies have suggested that increases in leaf area and tree cover have led to a decline in soil moisture and runoff due to increased evapotranspiration (ET), especially in dry regions of China. However, those studies often ignored precipitation responses to vegetation increases, which could offset some of the negative impact on soil moisture by increased ET. We investigated 30-year vegetation impacts on regional hydrology by allowing for vegetation-induced changes in precipitation using a coupled land-atmosphere global climate model, with a higher spatial resolution zoomed grid over China. We found high spatial heterogeneity in the vegetation impacts on key hydrological variables across China. In North and Southeast China, the increased precipitation from vegetation greening and the increased forest area, although statistically insignificant, supplied enough water to cancel out enhanced ET, resulting in weak impact on soil moisture. In Southwest China, however, the increase in vegetation cover significantly reduced soil moisture while precipitation was suppressed by the weakened summer monsoon. In Northeast China, the only area where forest cover declined, soil moisture was significantly reduced, by−8.1 mm decade−1, likely because of an intensified anticyclonic circulation anomaly during summer. These results suggest that offline model simulations can overestimate the increase of soil dryness in response to afforestation in North China, if vegetation feedbacks lead to increased precipitation like in our study.
INTRODUCTION
An extensive vegetation greening trend has been observed in China over the past three decades (1, 2). In addition to climate change, increased CO2concentrations, and nitrogen deposition, changes in land use and
in land cover are also factors that explain the observed greening trend, as indicated by the increase in the leaf area index (LAI). Afforestation largely explains the spatial pattern of vegetation greening across China (1). Such a large increase in forest cover and vegetation greening results in biogeochemical and biophysical effects on climate. However, most previous studies have focused on the consequences for the carbon cycle (3, 4); biophysical effects remain poorly understood. Previously, we showed that China’s recent afforestation-induced forest expansion could lead to local cooling effects through biophysical feedbacks (5). Here, we further explore how the biophysical coupling between atmo-spheric circulations and land surface changes caused by China’s 30-year vegetation cover expansion could affect regional hydrology.
The hydrological balance of a region is controlled by precipitation, evapotranspiration (ET), runoff, and soil water storage (6). Some earlier studies of the hydrological consequences of afforestation have high-lighted decreased runoff and soil moisture in temperate regions due to the increased ET demand (7). For example, large-scale afforestation was shown to reduce stream flow in North China’s semiarid Loess Plateau (8)
and to partly contribute to the recent drought over Southwest China (9). However, these case studies should be viewed with caution because they were based on offline approaches that assumed precipitation to be a forcing variable that does not respond to vegetation changes through land-atmosphere feedbacks (10–17). It is not known how hydrological feedbacks from vegetation greening and afforestation in China may have changed precipitation either locally (18) or remotely in downwind regions (19, 20) and further influenced water yields (WYs) (8, 9).
Previous studies that used coupled land-atmosphere models to quantify feedbacks from vegetation changes to precipitation through atmospheric circulation (21–25) often assumed hypothetical scenarios, for example, with full afforestation or complete deforestation, which overestimated the biophysical effects of vegetation on climate. Hypo-thetical forest cover scenarios were also used to model how vegetation changes may have affected the monsoon circulation in China (26, 27). These studies have analyzed short time periods (usually from a few months to several years) and used fixed atmospheric boundary con-ditions (that is, wind, humidity, and temperature fields from reanalysis data) in regional models that tended to dampen the climate feedbacks from vegetation changes.
The aim of this study was to quantify how 30-year changes in ob-served LAI and forest area have affected regional hydrology in China by allowing for changes in precipitation in response to vegetation dynam-ics. To achieve this, we used a coupled land-atmosphere global climate model (GCM) known as IPSLCM (Institut Pierre-Simon-Laplace coupled model) GCM (28), which was zoomed over China to allow a finer spatial resolution (~50 km) (fig. S1). Two simulations were per-formed with the coupled model forced by observed ocean sea surface temperatures (SSTs) and atmospheric CO2concentrations from 1982 to
2011 (Materials and Methods). In the first simulation (SCE), the model was additionally forced by the 30-year dynamics of satellite-observed LAI and inventory-based changes in forest area, both of which were fixed in the second control (CTL) simulation following Zenget al. (29). Vegetation 1Sino-French Institute for Earth System Science, College of Urban and Environmental Sciences,
Peking University, Beijing 100871, China.2Key Laboratory of Alpine Ecology and Biodiversity, Institute of Tibetan Plateau Research, Chinese Academy of Sciences, Beijing 100085, China.
3Center for Excellence in Tibetan Earth Science, Chinese Academy of Sciences, Beijing
100085, China.4Laboratoire de Météorologie Dynamique, Centre National de la Recherche
Scientifique, Sorbonne Université, Ecole Normale Supérieure, Ecole Polytechnique, 75252 Paris, France.5Department of Forestry and Natural Resources, Purdue University, West Lafayette, IN
46907, USA.6Laboratoire des Sciences du Climat et de l’Environnement/Institut Pierre Simon
Laplace, Commissariat à l’Énergie Atomique et aux Énergies Alternatives–CNRS–Université de Versailles Saint-Quentin, Université Paris-Saclay, F-91191 Gif-sur-Yvette, France.7Department of
Atmospheric and Environmental Sciences, University at Albany, State University of New York, Albany, NY 12222, USA.
*Corresponding author. Email: slpiao@pku.edu.cn
on October 27, 2020
http://advances.sciencemag.org/
physiology parameters of the land surface submodel [ORganizing Car-bon and Hydrology in Dynamic EcosystEms (ORCHIDEE), v3035)] in IPSLCM GCM were previously optimized by assimilating carbon and water fluxes measured from six eddy-covariance forest sites in China (section S1) (30). The capacity of the optimized IPSLCM coupled land-atmosphere model for simulating the spatial patterns and seasonal dis-tributions of hydrological variables and atmospheric circulation over China was verified by comparing SCE simulations against observation-based data sets (section S2 and figs. S2, S3, S4, and S5A).
RESULTS
Changes in vegetation cover
Figure 1 shows the spatial pattern of changes in the satellite-derived LAI and inventory-based forest area from 1982 to 2011. On average, the growing season LAI increased by 10% (P < 0.01) across the entire
country; however, there was high spatial heterogeneity. The largest in-crease in the LAI was observed in southern China, and the greening trend was also large in North China, the Northeast China Plain, and Northwest China (>0.1 m2m−2decade−1; Fig. 1A). Forest inventory data showed that China’s arbor forests increased by ~41.5 million hect-ares (4.3% of the country area) during the past 30 years (see Materials and Methods and the algorithm in section S3). In southern China, the increase in forest cover was more than 6% decade−1. An exception to this trend was in Northeast China, where forest cover decreased locally (Fig. 1B). The spatial pattern of the increase in the LAI roughly matched that of the increase in forest cover (spatial correlation coefficientR = 0.42,P < 0.001; Fig. 1B and table S1), although the increase in forest area was more uniform than that in greening in southern China. The results suggest that increased forest cover contributed to LAI greening (1), although other factors also contributed to the LAI signal. Vegetation effects on regional hydrology
at the country scale
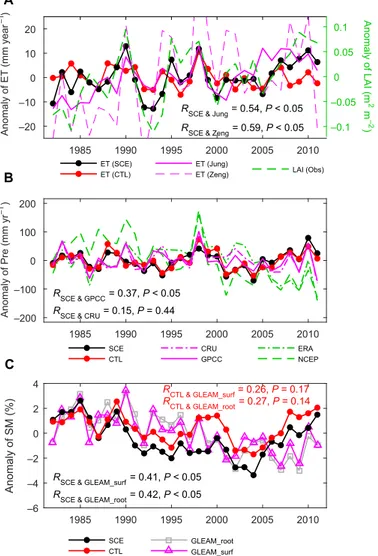
Overall, the SCE simulations adequately reproduced the observed trend in hydrological variables (Fig. 2). The sign of the observation-based an-nual trend in ET (for example, 0.6 ± 0.12 mm year−2,P < 0.05 for the Jung data set) is captured by the SCE simulations (0.28 ± 0.14 mm year−2,P < 0.05), whereas the ET trend simulated by CTL is negative and non-significant (−0.09 ± 0.09 mm year−2,P = 0.33; table S2). In contrast to ET trends, neither observed nor simulated precipitation showed any significant trend over the whole country (table S2). Meanwhile, the decreasing trend of root-zone Global Land Evaporation Amster-dam Model (GLEAM) soil moisture (−0.14 ± 0.03% year−1,P < 0.05
for the GLEAM data set) is consistent with the SCE simulations (−0.08 ± 0.03% year−1,P < 0.05) at the country scale, whereas the
CTL simulated trend of soil moisture is nonsignificant (−0.02 ± 0.02% year−1,P = 0.38; table S2).
Considering realistic vegetation dynamics in China also helped im-prove the model’s simulation of interannual ET variability. Interannual variation in annual ET from the SCE simulations closely followed that of observation-based ET products [R = 0.54, P < 0.05 for the Jung data set;R = 0.59, P < 0.05 for the Zeng data set (Materials and Methods and Fig. 2A)]. SCE-simulated precipitation shows a significant but low cor-relation with precipitation in only one of the two observational data sets [R = 0.37, P < 0.05 for GPCC; R = 0.15, P = 0.44 for CRU (Fig. 2B)]. This low correlation arises because the overall mean of the 15 simulations in SCE shows different variability in precipitation. The observed precipi-tation essentially represents one realization of the simulations (31) and is not necessarily correlated with the precipitation estimated from the overall mean of SCE. The low correlation between observed and simu-lated precipitation reflects the challenge of correctly capturing regional precipitation variability for current climate models. When compared against the GLEAM observation-driven data set, SCE simulations ap-peared to reproduce the interannual variation of relative soil moisture [R = 0.41, P < 0.05 for GLEAM_surf; R = 0.42, P < 0.05 for GLEAM_root (Materials and Methods)] better than the CTL simulations [R = 0.26, P = 0.17 for GLEAM_surf;R = 0.27, P = 0.14 for GLEAM_root (Fig. 2C)].
The linear trends in vegetation-induced changes (that is, the differ-ence between SCE and CTL) in annual hydrological variables allowed us to isolate the effects of vegetation changes on climate because the only difference between the two simulations was vegetation dynamics (Materials and Methods). The annual ET trend for SCE minus CTL (3.7 mm year−1decade−1,P < 0.05; Fig. 3A) was higher than that in the SCE simulation (2.8 mm year−1decade−1,P < 0.05; Fig. 2A) because of
A LAI (AVHRR, 0.5°) m2 m–2 decade–1 Forest cover (0.5°) % decade–1 B ° ° ° ° ° ° ° ° ° ° ° ° ° °
Fig. 1. Spatial patterns of the linear trend in vegetation changes over China during the past 30 years. (A) Trend in changes of the satellite-observed growing season (from April to October) leaf area index (LAI). AVHRR, Advanced Very High Res-olution Radiometer. (B) Trend in changes of the forest cover fraction (%) recon-structed from maps of plant functional type (PFT), which incorporate spatial information from the 1:1,000,000 Chinese vegetation map and statistical information from the provincial forest inventories (see Materials and Methods). The shaded area indicates the statistical significance of the linear trend at the 95% confidence level.
on October 27, 2020
http://advances.sciencemag.org/
the negative effect of increased CO2levels on ET, which reduced stomatal
conductance and transpiration. This negative effect of CO2is included in
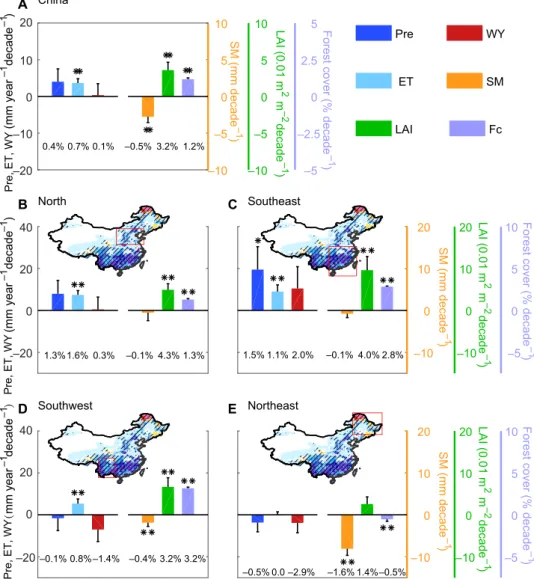
the CTL simulations with a fixed LAI. Not only ET but also precipitation increased in the SCE simulation, and the precipitation increase (4.0 mm year−1decade−1,P = 0.26) was sufficient to offset the ET increase, result-ing in a positive trend for WY (defined as precipitation− ET) at the country scale (Fig. 3A). In contrast to the increased precipitation and ET from vegetation feedbacks, our simulations also showed decreasing soil moisture at the country scale (−2.8 mm decade−1,P < 0.05; Fig. 3A),
indicating the existence of a water deficit at the regional scale (see the detailed analysis in section S4).
Spatial heterogeneity of vegetation impacts on hydrological cycles
We further investigated the hydrological responses to vegetation green-ing and afforestation across different regions. By considergreen-ing changes in the spatial pattern of forest cover (Fig. 1B) and climatological precipi-tation (fig. S6), we focused on four regions—North, Southeast, and Southwest China, where forest cover was increasing, and Northeast China, in the north of which forest cover was decreasing. In these re-gions, the temporal variation and trends in ET, precipitation, and soil moisture simulated by SCE generally agreed well with those derived from observations (fig. S7). In particular, the sign of the trends, the significant increase of ET over North China (1.40 ± 0.32 mm year−2,P < 0.05), and the decrease in soil moisture over the Southwest region (−0.16 ± 0.05% year−1,P < 0.05) and Northeast region (−0.40 ± 0.08% year−1,P < 0.05) in the observation-based data sets were all captured by SCE (although with different trend magnitudes; see table S2), whereas the CTL simulations produce a negative ET trend and weak decrease in soil moisture over these regions. The significant cor-relations of ET between SCE and observation-based products (table S2), relative to the nonsignificant correlation between CTL and observation-based product, also indicate the important role of vegetation in determining regional interannual variability of ET.
Vegetation impacts on regional hydrology showed strong spatial heterogeneity (Fig. 3, B to E). In Southeast China, where the South-east Asian monsoon system brings abundant precipitation (32), the in-creased LAI and forest area (4.0% decade−1for LAI and 2.8% decade−1 for forests; Fig. 3C) increased the annual precipitation by about 19.5 mm year−1decade−1(1.5% decade−1,P < 0.1), far exceeding the increase in ET [9.0 mm year−1decade−1(1.1% decade−1,P < 0.05)]. As a result, the WY increased by 10.5 mm year−1decade−1(2.0% decade−1). Because of this surplus water resource, soil moisture remained high in this region and was not significantly affected by vegetation changes (Fig. 3C). In Southwest China, where precipitation was controlled by the Southwest monsoon (fig. S4, D to F) and forest cover markedly increased (3.2% decade−1), precipitation did not change in SCE (Fig. 3D), whereas ET increased [5.4 mm year−1decade−1(0.8% decade−1,P < 0.05)], causing a small reduction in soil moisture [−1.9 mm decade−1 (−0.4% decade−1
; Fig. 3D)].
In North China, where the climate is much drier than that in the two regions discussed above (fig. S6), our SCE results indicated a weak change in soil moisture (Fig. 3B), although the increase in ET was large at 7.4 mm year−1decade−1(1.6% decade−1,P < 0.05; Fig. 3B). This result contrasts with earlier local findings that large-scale afforestation over this semiarid region has reduced soil moisture and stream flow (8). This is because our model included the positive feedback of vegetation to precipitation [7.9 mm year−1decade−1(1.3% decade−1)], which was large enough to cancel the effect of increase in ET, resulting in little change in soil moisture (Fig. 3B).
In Northeast China, where forest cover declined, for example, in the north Greater Khingan Mountains (~53°N, 123°E), we found the largest reduction in total soil moisture in SCE minus CTL, with a rate of−8.1 mm decade−1(−1.6% decade−1; Fig. 3E). In this region, where the Asian monsoon circulation has a much smaller impact, the decline in forest cover has decreased precipitation in recent decades, resulting in multiyear water imbalances and thus reducing soil moisture (section S4 and Fig. 3E).
1985 1990 1995 2000 2005 2010 –20 –10 0 10 20 Anomaly of ET (mm year –1) A
RSCE & Jung = 0.54, P < 0.05
RSCE & Zeng = 0.59, P < 0.05 –0.1 –0.05 0 0.05 0.1 Anomaly of LAI (m 2 m –2 ) ET (SCE) ET (CTL) LAI (Obs) ET (Jung) ET (Zeng) 1985 1990 1995 2000 2005 2010 –200 –100 0 100 200 Anomaly of Pre (mm yr –1 ) B RSCE & GPCC = 0.37, P < 0.05
RSCE & CRU = 0.15, P = 0.44 SCE CTL CRU GPCC ERA NCEP 1985 1990 1995 2000 2005 2010 –6 –4 –2 0 2 4 Anomaly of SM (%) C
RSCE & GLEAM_surf = 0.41, P < 0.05
RSCE & GLEAM_root = 0.42, P < 0.05
RCTL & GLEAM_surf = 0.26, P = 0.17 RCTL & GLEAM_root = 0.27, P = 0.14 SCE CTL GLEAM_root GLEAM_surf
Fig. 2. Temporal changes of the anomalies in annual hydrological variables over China from 1982 to 2011. (A) ET, (B) precipitation (Pre), and (C) relative soil moisture (SM). The black line represents the ensemble (15 members) mean from the experiment (“SCE”), and the red line denotes that from the control (“CTL”) (Materials and Methods). The solid magenta (gray) and dashed green lines denote the observations or observation-based data sets, that is, LAI from Global Inventory Modeling and Mapping Studies (GIMMS) (51); observation-based ET products from Jung et al. (59) and Zeng et al. (60); observed precipitation from data sets of the Climate Research Unit (CRU) (61) and the Global Precipitation Climatology Centre (GPCC) (62) and precipitation output from the European Centre for Medium-Range Weather Forecasts (ECMWF) reanalysis (ERA-Interim) (65) and National Centers for Environmental Prediction (NCEP) reanalysis data set (66); observation-based soil moisture data from the output of the GLEAM (64) presented by surface soil moisture (GLEAM_surf) and root-zone soil moisture (GLEAM_root). The correlation coefficients and P values are shown for the relations between simulations and observations.
on October 27, 2020
http://advances.sciencemag.org/
Possible mechanisms in explaining the precipitation responses
Changes in precipitation during the summer monsoon season (from May to September) (33) could largely explain the annual precipitation response to changes in vegetation cover over North and Southeast China (fig. S8C), despite the changes in LAI, and the resultant surface latent/ sensible heat fluxes were the largest in spring (that is, from March to May; Fig. 4A and figs. S8, A and B, and S9, C and D) (34). This pattern suggests that the change in summer monsoon circulation, rather than the change in the spring atmospheric thermodynamic state, dominates the annual precipitation responses (although these were not strong) to changes in forest cover in these two regions. In contrast to the strong change in atmospheric circulation reported under hypothetical vegeta-tion change scenarios (21, 22), we found that the impact of the large-scale expansion of vegetation cover in China on the summer monsoon was weak overall (fig. S5B). However, our simulations did suggest a sig-nificantly enhanced westward wind at 700 hPa near the northern edge of a surface cyclonic anomaly centered near 25°N and 125°E (fig. S10D),
bringing more ocean water vapor to increase summer precipitation over North and Southeast China.
The large cyclonic anomaly structure in East China Sea (fig. S10, D and E) would not be produced by regional models in which regional circulation responses to vegetation changes are dampened by fixed at-mospheric boundary conditions (26, 27). In our simulations, because of the particular design of model configuration, the cyclonic anomaly over the East China Sea is evident. We believe that this cyclonic anomaly is in concordance with the intensified anticyclonic anomaly in the north of the Greater Khingan Mountains (~53°N, 123°E; Fig. 4B and fig. S10, D and E) owing to the local reduction in forest area (Fig. 1B). The de-creased roughness and inde-creased surface albedo in this region (fig. S9, A and B) may reduce moisture convergence and surface net radiation (23), resulting in enhanced subsidence of the air mass (fig. S10, A and F), reduced relative humidity, increased temperature in the upper air (fig. S10, A and B), reduced convective available potential energy (CAPE) (fig. S10C), and a change to a clockwise wind field near the surface of Northeast China (fig. S10, D and E). The dipole structure (anticyclone
–20 –10 0 10 20 –10 –5 0 5 10 –10 –5 0 5 10 –5 –2.5 0 2.5 5 A China (mm year –1 decade ) –1 SM (mm decade –1 ) LAI (0.01 m 2 m –2 decade –1 )
Forest cover (% decade
–1 ) –20 0 20 40 B North (mm year –1 decade ) –1 –10 0 10 20 –10 0 10 20 –5 0 5 10 C Southeast SM (mm decade –1 ) LAI (0.01 m 2 m –2 decade –1 )
Forest cover (% decade
–1 ) –20 0 20 40 D Southwest mm year –1 decade –1 –10 0 10 20 –10 0 10 20 –5 0 5 10 E Northeast SM (mm decade –1 ) LAI (0.01 m 2 m –2 decade –1 )
Forest cover (% decade
–1 ) Pre ET WY SM LAI Fc Pre, ET, WY Pre, ET, WY Pre, ET, WY 0.4% 0.7% 0.1% –0.5% 3.2% 1.3%1.6% 0.3% –0.1% 4.3% 1.5% 1.1% 2.0% –0.1% 4.0% –0.1% 0.8% –1.4% –0.4% 3.2% –0.5% 0.0 –2.9% –1.6% 1.4% 1.2% 1.3% 2.8% 3.2% –0.5%
Fig. 3. Linear trend of vegetation-induced changes (that is, SCE− CTL) in annual hydrological variables (including Pre, ET, Pre − ET, and total SM) and the trend in observed LAI and forest cover (Fc). (A) The whole country, (B) North China, (C) Southeast China, (D) Southwest China, and (E) Northeast China. The spatial extent of each region is shown on the map above each subplot. One asterisk indicates statistical significance at the 90% confidence level, and two indicate statistical significance at the 95% confidence level.
on October 27, 2020
http://advances.sciencemag.org/
versus cyclone) at 700 hPa (fig. S10, D and E) is consistent with the ob-served summer rainfall anomalous patterns in China (35). It is an im-portant atmospheric teleconnection structure taking place in summer because of the presence of a strong meridional circulation (winds to the north in lower layers and to the south in upper layers). Our results are consistent with numerous studies reported in the literature on East Asia/Pacific pattern (36, 37) and Pacific-Japan wave train (38).
DISCUSSION
Our simulations of precipitation increases over North China in re-sponse to afforestation and vegetation greening (Fig. 3B) suggest that it is possible for this semiarid region not to experience a vegetation-induced soil drought over the past three decades, particularly consid-ering the fact that the temporal trend of key land surface hydrological variables (that is, ET and soil moisture) has been captured by SCE sim-ulations (fig. S7, A and C, and table S2) and that the simulated trend in precipitation was within the observed uncertainty (fig. S11B). Compar-ison with results from an offline model by Liuet al. (17) also including LAI changes suggests different vegetation impacts on regional hydrology
between offline and coupled simulations. The offline results produced significant vegetation-induced decline in WY, but positive precipitation feedbacks in SCE compensated the generally larger ET enhancement and resulted in an increasing WY trend over North China (table S3 and Fig. 3B). Our results have thus extended the offline approaches such as those of McVicaret al. (39), He et al. (40), and Liu et al. (17), which have attributed the observed decrease in soil water over North China’s Loess Plateau to the rapid increase in ET due to the large-scale re-vegetation that has occurred during the Three-North Shelterbelt Devel-opment Program (41). We found that such afforestation-induced ET enhancement (particularly after the 2000s; fig. S7A) was offset by the positive precipitation response to increased vegetation cover (Fig. 3B). However, this precipitation response is often ignored by observation-based analyses, which compare hydrological effects between different types of vegetation cover but under the same precipitation conditions (42). We suggest that the decrease in soil moisture over North China (table S4) or the exacerbation of desertification over arid/semiarid re-gions (43) should not be attributed to forest expansion and reforesta-tion. Soil moisture loss during the past three decades (44) could rather be attributed to other factors, such as the increase in anthropogenic aerosol loadings that have suppressed the observed precipitation in North China (45, 46). Our coupled simulations suggest that any assess-ment of the hydrological effects of large-scale afforestation should ac-count for vegetation biophysical feedbacks to precipitation, and this will be important to consider in the ongoing afforestation programs in China (47). Nevertheless, future assessments should be conducted with cau-tion because the observed decrease in soil moisture (fig. S7C) may limit ET enhancement, leading to possible changes in vegetation effects on precipitation.
If a robust change in the summer atmospheric circulation occurs be-cause of vegetation greening and the expansion of forest area (Fig. 4B), then large-scale afforestation can make a substantial contribution to the observed decline in summer monsoon precipitation over Southwest China (48). This relationship was evidenced by the vegetation-induced reduction in summer precipitation (fig. S8C) and in meridional wind at 700 hPa in Southwest China (fig. S10E). The suppression of summer precipitation amplified the signal of the year-round increase in ET (fig. S8B), which significantly reduced soil moisture (fig. S8E). Our sim-ulations provide conceptual evidence to explain the increase in soil dry-ness during the monsoon season due to the afforestation-induced decrease in precipitation over Southwest China (9, 49). Because of the “water pump” effect of newly planted trees (for example, rubber trees) (15), further afforestation could increase the risk of enhanced soil drought in Southwest China.
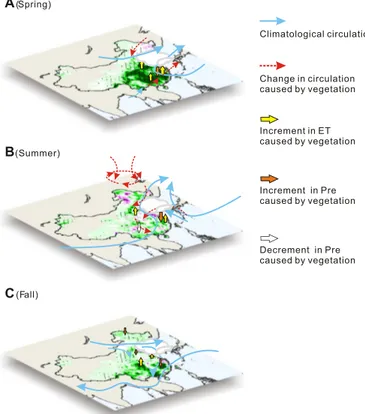
In summary, our model simulations showed that large-scale affores-tation and vegeaffores-tation greening in China over the last three decades have had various hydrological impacts in different regions. They have led to significant decreases in soil moisture over Southwest China, where a weakened summer monsoon suppressed precipitation, but have had lit-tle effect on soil moisture over North and Southeast China. This weak impact of increased vegetation cover on soil moisture in North China updated earlier findings from offline models, which suggested a ten-dency for enhanced soil dryness due to the increase in vegetation greening and afforestation in North China. After including precipita-tion feedback, we may be able to draw new conclusions that precipi-tation feedback could suppress soil moisture drying out that would otherwise occur without this feedback. Our results highlight the crit-ical role of precipitation feedbacks by afforestation on regional hydro-logical cycles, which needs to be included in the evaluation of future Climatological circulation Change in circulation caused by vegetation Increment in ET caused by vegetation Increment in Pre caused by vegetation A (Spring) B (Summer) C (Fall) Decrement in Pre caused by vegetation
Fig. 4. Schematic diagram of the vegetation biophysical feedback to ET, pre-cipitation, and low-level (that is, 700 hPa) tropospheric circulation. (A) Spring (March to May), (B) summer (June to August), and (C) fall (September to October). The base map shows the trend in changes of the satellite-observed LAI during the corresponding season from 1982 to 2011. Blue solid arrows denote the climato-logical wind fields in the low-level troposphere. The red dashed arrows are the significant trend of the low-level troposphere composited wind fields caused by vegetation changes (that is, experiment− control: SCE − CTL), which was sum-marized from the spatial pattern of significant change in circulation such as fig. S10. Arrows denoting vegetation-induced changes in ET and Pre were drawn only when the trend was significant in at least 1 month of the corresponding season according to fig. S8 (B and C).
on October 27, 2020
http://advances.sciencemag.org/
afforestation projects. Finally, our results have important policy impli-cations for the use of large-scale afforestation projects as an effective way of reducing global CO2emissions and alleviating climate change. We
suggest that effective and efficient afforestation projects need to consider both biogeochemical and biophysical feedbacks to maximize climatic, ecological, and socioeconomical services.
There are uncertainties regarding the robustness of our single-model results in simulating the regional hydrology in China, despite efforts made to optimize vegetation parameters in the land surface model. Fu-ture work could extend the analysis of LAI and increased forest cover-age in China toward more Earth system models that have participated in the Coupled Model Intercomparison Project phase 5 (CMIP5). Other climate model centers are encouraged to perform experiments similar to this study to verify whether the signal of regional drying would be weakened by considering precipitation feedback from vegetation cover changes. Realistic representations of cloud and precipitation processes at regional scales are still a major challenge in climate models. Aerosols and their effects also need to be considered in future simulations over China, given pieces of evidence on the impact of changing aerosol on precipitation (50). Improved model simulations are expected to en-hance our understanding of precipitation impacts from large-scale af-forestation and vegetation greening in China.
MATERIALS AND METHODS
Forcing data sets
The forcing data sets driving the IPSLCM GCM were satellite-observed LAI, which describes the leaf area per square meter, and an inventory-based vegetation map, which describes the fractional cover for each veg-etation type. The satellite-observed LAI was derived from the GIMMS LAI3g products, with an interval of 15 days and a spatial resolution of
1
/12degree from 1982 to 2011 (51). The inventory-based vegetation map
was reconstructed as an input map of PFT for the model by combining spatial information from the 1:1,000,000 Chinese vegetation map (52) and temporal information from the multiyear provincial forest area from inventory data (53) during the past 30 years (see the details and algorithm in section S3).
The observed SST and sea ice concentration (SIC) maps with 1° × 1° spatial resolution and covering 1982–2011 were obtained from the At-mospheric Model Intercomparison Project (AMIP; www-pcmdi.llnl. gov/projects/amip). Observed global atmospheric CO2data were
de-rived from those used for transient modeling in the project“Trends in net land-atmosphere carbon exchange” (TRENDY, http://dgvm. ceh.ac.uk/node/9) during 1982–2011.
Model and experiments
The IPSLCM GCM, which was developed in the mid-1990s, continues contributing to the multimodel comparisons project used by the Inter-governmental Panel on Climate Change in their assessment reports (28). The newest version of the atmospheric component, the Laboratoire de Météorologie Dynamique atmospheric general circulation model with zoomed capability (LMDZ, version 5, v2076) for atmospheric dy-namics and physics (54), and the land surface component, ORCHIDEE (v3035) for energy and water balance (now also including carbon and vegetation dynamics modules) of terrestrial ecosystems (55), were coupled (namely, LMDZOR) and used to investigate vegetation bio-physical feedbacks to regional hydrology in China. In addition to direct-ly imposed vegetation canopy parameters (that is, LAI), we optimized vegetation physiology–related (for example, photosynthesis and
tran-spiration) parameters using carbon and water fluxes from six eddy-covariance forest sites in China (section S1) (30). The soil hydrology scheme in ORCHIDEE is the two-layer Choisnel scheme, which has been shown to prevent excessively dry soil and to succeed in capturing immediate fluctuations of the evaporation rate (56). This soil hydrology scheme is also consistent with that used in the version of ORCHIDEE that participated in the Global Land-Atmosphere Climate Experiment– CMIP5 (57). When applied in China, LMDZOR has been zoomed over the East Asian region at a spatial resolution of 1° × 0.63°, which enables the free exchange of water, energy, and momentum at the boundary of the zoomed area (fig. S1). Although the maximum spatial resolution of ~50 km may still not be able to resolve mesoscale circulations, such as eddies (10 to 20 km) (58), it can resolve the moisture and heat flux dif-ferences caused by surface vegetation heterogeneity because the vege-tation forcing data have a relatively high spatial resolution. The version of LMDZOR used in this study does not consider aerosols and their interactions with clouds and precipitation in all simulations. Given po-tentially significant impacts of aerosol change on precipitation change (50), further development of LMDZOR should consider including those processes to more accurately project precipitation change over China.
We applied the AMIP-type simulations (for example, www-pcmdi. llnl.gov/projects/amip/NEWS/overview.php) and thus forced the model by setting the boundary conditions to the observed SST/SIC maps. The observed boundary conditions could correctly simulate global atmospheric general circulations, such as the East Asian summer mon-soon (EASM) (fig. S5A). The model was first run over a 30-year period as a spin-up to ensure that the annual soil moisture reached a state of quasi-equilibrium, forced by climatological SST/SIC and monthly LAI averaged (climatology) from 1982 to 2011. The inventory-based vege-tation map and global atmospheric CO2concentration were fixed at
1982 levels in the spin-up step. Then, we continued performing a pair of 30-year experiments, the first of which, SCE, was forced by the satellite-observed LAI and inventory-based vegetation map, as well as the observed SST/SIC and atmospheric CO2concentration from 1982
to 2011. The second experiment, CTL, shared the same boundary (that is, observed SST/SIC and CO2concentration) and initial conditions as
SCE but was prescribed with a climatological LAI averaged during 1982–2011 and a map of the PFTs for 1982. For each experimental en-semble (that is, SCE and CTL), 15-member simulations with different initial conditions were conducted; the results are presented as an ensem-ble average. This experimental design has been shown to successfully isolate the fingerprint of vegetation feedback to the climate system by comparing results from SCE and CTL [more detailed discussions of the experimental design are given in a recent study by Zenget al. (29)]. Model evaluation
We used a variety of observational or observation-based data sets to evaluate the performance of simulated hydrological variables and the EASM. Observation-based ET products were derived from two data sources, namely, Junget al. (59) and Zeng et al. (60), both of which have tried to upscale the observed ET at a small spatial scale to a global grid of 0.5° × 0.5° according to an empirical statistical relationship. Observed precipitation was obtained from the CRU TS3.21 data sets (61) and data sets from the GPCC (62), University of Delaware (63), and Global Soil Wetness Project 3 (http://hydro.iis.u-tokyo.ac.jp/GSWP3/). The com-mon point for these data sets is that they all used observed data (the rain gauge) from global meteorological stations to a standard 0.5° grid. Soil moisture data were derived from the output from GLEAM v3.0 (64).
on October 27, 2020
http://advances.sciencemag.org/
One of the biggest advantages of this data set is that the data assimilation system has assimilated the surface soil moisture from microwave ob-servations into the soil profile. Because the total soil moisture is not available from the GLEAM data set, the relative temporal changes in the GLEAM_surf and in the GLEAM_root were used for a compar-ison with the relative change in the simulated total soil moisture in this study. Precipitation and winds (including both the zonal and meridional component) at 850 and 200 hPa were derived from the ECMWF reanalysis (ERA-Interim) (65) and NCEP reanalysis data set (66). All observational or observation-based data sets covered the period of 1982–2011.
Comparisons of these observations or observation-based data sets demonstrated that our model is generally able to capture the spatial pat-tern and seasonal distribution of key hydrological variables, such as precipitation, ET, and relative soil moisture. The model capacity for sim-ulating circulation (for example, the EASM) was also confirmed (see model evaluation in section S2). Despite the model’s capability of capturing the sign and, partly, the magnitude of the trend of ET and soil moisture, and the interannual variability of ET when considering veg-etation cover change in SCE (table S2), SCE and CTL have comparable biases with respect to observations (table S2), suggesting that systematic structural errors in the model are not related to vegetation changes. These biases may be not critical because our focus is the hydrological trends, not the absolute values. Meanwhile, the model’s lack of ability to reproduce the observed regional-scale variability in precipitation and soil moisture (table S2) reflects the model’s deficiencies in describing various hydrological processes, which are complicated and remain a huge challenge in current climate models. Further confirmation of our results with improved models is needed in the future.
Analysis
The tendency for an overall increase in the LAI and forest cover fraction (Fig. 1) was calculated by the Theil-Sen robust estimate of a linear trend, and the significance of the trend was determined by the Mann-Kendall nonparametric test for a monotonic trend, which was performed using the National Center for Atmospheric Research Command Language. The vegetation greening results indicated an increased trend in ET from the SCE simulations in contrast to the relatively flat (no trend) variation of ET in the CTL simulations (Fig. 2A). The difference between them could therefore be used to isolate the vegetation signal from the influence of natural internal variability (that is, SST) under increasing atmospheric CO2concentration (29). The linear trend of the differences in key
hydro-logical variables (that is, precipitation, ET, and relative soil moisture) be-tween SCE and CTL was estimated by the least-squares method as the slope in a linear regression function of time, performed using MATLAB. The corresponding F-statistics were used to test the significance of this vegetation-induced trend in hydrological variables over China.
The strength of the EASM, calculated following the method re-ported by Liet al. (67), was measured by two indices: (i) the EASM index (EASMI), defined as the normalized difference in zonal wind between 850 and 200 hPa averaged over 20°N to 40°N, 110°E to 140°E and (ii) the precipitation difference index (PDI), defined as the normalized dif-ference in precipitation between North China (33°N to 41°N, 105°E to 122°E) and the Yangtze River Valley (27°N to 32°N, 105°E to 122°E). An evaluation of the reanalysis data sets (that is, ERA and NCEP) in-dicated that IPSLCM GCM could correctly simulate the temporal variation in EASMI (fig. S5A). The differences in EASMI and PDI be-tween SCE and CTL were used to isolate the vegetation impact on EASM (fig. S5B).
SUPPLEMENTARY MATERIALS
Supplementary material for this article is available at http://advances.sciencemag.org/cgi/ content/full/4/5/eaar4182/DC1
section S1. Optimization of vegetation physiology–related parameters section S2. Model evaluation
section S3. Reconstructed map of the forest cover fraction and attribution of the greening section S4. Relationship between soil moisture and other water cycle fluxes
fig. S1. Schematic diagram of the LMDZOR coupled model, zoomed over China. fig. S2. The spatial patterns of climatological precipitation, ET, and soil moisture. fig. S3. Seasonal distributions of climatological precipitation, ET, and soil moisture. fig. S4. Spatial patterns of the climatological precipitation, overlaid by the composited 850-hPa winds at the annual time scale and during summer.
fig. S5. Evaluation of the EASM and changes in EASM caused by vegetation dynamics. fig. S6. Spatial extent of the four different climate regions with the main changes in forest cover in China.
fig. S7. Temporal change in anomalies in annual hydrological variables from 1982 to 2011 over different climate regions.
fig. S8. Linear trend of the differences in monthly LAI, ET, precipitation, total runoff, and total soil moisture between the experiment (SCE) and control (CTL) over different climate regions. fig. S9. Linear trend of the differences in monthly roughness, surface shortwave albedo, latent heat flux, sensible heat flux, and CAPE between the experiment (SCE) and control (CTL) over different climate regions.
fig. S10. The trend in mechanism-related variables affected by vegetation (experiment− control: SCE− CTL) from June to August.
fig. S11. Linear trend in annual precipitation (Pre) derived from observation-based data sets and our model simulations (that is, SCE and CTL) from 1982 to 2011.
table S1. Changes in the LAI, forest cover fraction (fforest, %), and LAI over forest (LAIforest) and
nonforest (LAInonforest) regions between 1982 and 2011 (that is, 2011 minus 1982) over
different climate regions in China and in the country as a whole.
table S2. A list of interannual trend (trend, ±1 SE), correlation coefficient (R), relative bias (bias, %) computed from observed and simulated ET, precipitation (Pre), and relative soil moisture (SM) at the country and regional scales.
table S3. Comparisons of trend (units: mm year−2) in ET and WY (precipitation− ET) between the Liu et al. (17) offline model and our coupled simulations during the time period 2000–2011.
table S4. Trends in the soil moisture of drainage basins within North China from 1979 to 2010, derived from the supporting information in the study of Chen et al. (44).
REFERENCES AND NOTES
1. S. Piao, G. Yin, J. Tan, L. Cheng, M. Huang, Y. Li, R. Liu, J. Mao, R. B. Myneni, S. Peng, B. Poulter, X. Shi, Z. Xiao, N. Zeng, Z. Zeng, Y. Wang, Detection and attribution of vegetation greening trend in China over the last 30 years. Glob. Chang. Biol. 21, 1601–1609 (2015).
2. Z. Zhu, S. Piao, R. B. Myneni, M. Huang, Z. Zeng, J. G. Canadell, P. Ciais, S. Sitch, P. Friedlingstein, A. Arneth, C. Cao, L. Cheng, E. Kato, C. Koven, Y. Li, X. Lian, Y. Liu, R. Liu, J. Mao, Y. Pan, S. Peng, J. Peñuelas, B. Poulter, T. A. M. Pugh, B. D. Stocker, N. Viovy, X. Wang, Y. Wang, Z. Xiao, H. Yang, S. Zaehle, N. Zeng, Greening of the Earth and its drivers. Nat. Clim. Chang. 6, 791–795 (2016).
3. J. Fang, A. Chen, C. Peng, S. Zhao, L. Ci, Changes in forest biomass carbon storage in China between 1949 and 1998. Science 292, 2320–2322 (2001).
4. S. Piao, J. Fang, P. Ciais, P. Peylin, Y. Huang, S. Sitch, T. Wang, The carbon balance of terrestrial ecosystems in China. Nature 458, 1009–1013 (2009).
5. S.-S. Peng, S. Piao, Z. Zeng, P. Ciais, L. Zhou, L. Z. X. Li, R. B. Myneni, Y. Yin, H. Zeng, Afforestation in China cools local land surface temperature. Proc. Natl. Acad. Sci. U.S.A. 111, 2915–2919 (2014).
6. G. Bonan, in Ecological Climatology: Concepts and Applications (Cambridge Univ. Press, ed. 3, 2016), chap. 10.
7. A. E. Brown, L. Zhang, T. A. McMahon, A. W. Western, R. A. Vertessy, A review of paired catchment studies for determining changes in water yield resulting from alterations in vegetation. J. Hydrol. 310, 28–61 (2005).
8. X. Feng, B. Fu, S. Piao, S. Wang, P. Ciais, Z. Zeng, Y. Lü, Y. Zeng, Y. Li, X. Jiang, B. Wu, Revegetation in China’s Loess Plateau is approaching sustainable water resource limits. Nat. Clim. Chang. 6, 1019–1022 (2016).
9. J. Qiu, China drought highlights future climate threats. Nature 465, 142–143 (2010). 10. G. Zhou, X. Wei, Y. Luo, M. Zhang, Y. Li, Y. Qiao, H. Liu, C. Wang, Forest recovery and river
discharge at the regional scale of Guangdong Province, China. Water Resour. Res. 46, W09503 (2010).
11. M. L. Roderick, G. D. Farquhar, A simple framework for relating variations in runoff to variations in climatic conditions and catchment properties. Water Resour. Res. 47, W00G07 (2011).
on October 27, 2020
http://advances.sciencemag.org/
12. N. Sriwongsitanon, W. Taesombat, Effects of land cover on runoff coefficient. J. Hydrol. 410, 226–238 (2011).
13. G. Zhou, X. Wei, X. Chen, P. Zhou, X. Liu, Y. Xiao, G. Sun, D. F. Scott, S. Zhou, L. Han, Y. Su, Global pattern for the effect of climate and land cover on water yield. Nat. Commun. 6, 5918 (2015).
14. S. Zhang, H. Yang, D. Yang, A. W. Jayawardena, Quantifying the effect of vegetation change on the regional water balance within the Budyko framework. Geophys. Res. Lett. 43, 1140–1148 (2016).
15. Z.-H. Tan, Y.-P. Zhang, Q.-H. Song, W.-J. Liu, X.-B. Deng, J.-W. Tang, Y. Deng, W.-J. Zhou, L.-Y. Yang, G.-R. Yu, X.-M. Sun, N.-S. Liang, Rubber plantations act as water pumps in tropical China. Geophys. Res. Lett. 38, L24406 (2011).
16. R. B. Jackson, E. G. Jobbágy, R. Avissar, S. B. Roy, D. J. Barrett, C. W. Cook, K. A. Farley, D. C. le Maitre, B. A. McCarl, B. C. Murray, Trading water for carbon with biological carbon sequestration. Science 310, 1944–1947 (2005).
17. Y. Liu, J. Xiao, W. Ju, K. Xu, Y. Zhou, Y. Zhao, Recent trends in vegetation greenness in China significantly altered annual evapotranspiration and water yield. Environ. Res. Lett. 11, 094010 (2016).
18. J. Lean, D. A. Warrilow, Simulation of the regional climatic impact of Amazon deforestation. Nature 342, 411–413 (1989).
19. R. J. van der Ent, H. H. G. Savenije, B. Schaefli, S. C. Steele-Dunne, Origin and fate of atmospheric moisture over continents. Water Resour. Res. 46, W09525 (2010). 20. D. V. Spracklen, S. R. Arnold, C. M. Taylor, Observations of increased tropical rainfall
preceded by air passage over forests. Nature 489, 282–285 (2012).
21. A. L. S. Swann, I. Y. Fung, J. C. H. Chiang, Mid-latitude afforestation shifts general circulation and tropical precipitation. Proc. Natl. Acad. Sci. U.S.A. 109, 712–716 (2012). 22. N. Devaraju, G. Bala, A. Modak, Effects of large-scale deforestation on precipitation in the monsoon regions: Remote versus local effects. Proc. Natl. Acad. Sci. U.S.A. 112, 3257–3262 (2015).
23. J. Shukla, C. Nobre, P. Sellers, Amazon deforestation and climate change. Science 247, 1322–1325 (1990).
24. R. E. Dickinson, P. Kennedy, Impacts on regional climate of Amazon deforestation. Geophys. Res. Lett. 19, 1947–1950 (1992).
25. D. V. Spracklen, L. Garcia-Carreras, The impact of Amazonian deforestation on Amazon basin rainfall. Geophys. Res. Lett. 42, 9546–9552 (2015).
26. C. Fu, Potential impacts of human-induced land cover change on East Asia monsoon. Glob. Planet. Chang. 37, 219–229 (2003).
27. Y. Ding, Q. Li, W. Dong, A numerical simulation study of the impacts of vegetation changes on regional climate in China. Acta Meteorol. Sin. 63, 613–621 (2005). 28. O. Marti, P. Braconnot, J.-L. Dufresne, J. Bellier, R. Benshila, S. Bony, P. Brockmann,
P. Cadule, A. Caubel, F. Codron, N. de Noblet, S. Denvil, L. Fairhead, T. Fichefet, M.-A. Foujols, P. Friedlingstein, H. Goosse, J.-Y. Grandpeix, E. Guilyardi, F. Hourdin, A. Idelkadi, M. Kageyama, G. Krinner, C. Lévy, G. Madec, J. Mignot, I. Musat, D. Swingedouw, C. Talandier, Key features of the IPSL ocean atmosphere model and its sensitivity to atmospheric resolution. Clim. Dyn. 34, 1–26 (2010).
29. Z. Zeng, S. Piao, L. Z. X. Li, L. Zhou, P. Ciais, T. Wang, Y. Li, X. Lian, E. F. Wood, P. Friedlingstein, J. Mao, L. D. Estes, R. B. Myneni, S. Peng, X. Shi, S. I. Seneviratne, Y. Wang, Climate mitigation from vegetation biophysical feedbacks during the past three decades. Nat. Clim. Chang. 7, 432–436 (2017).
30. Y. Li, H. Yang, T. Wang, N. MacBean, C. Bacour, P. Ciais, Y. Zhang, G. Zhou, S. Piao, Reducing the uncertainty of parameters controlling seasonal carbon and water fluxes in Chinese forests and its implication for simulated climate sensitivities.
Global Biogeochem. Cycles 31, 1344–1366 (2017).
31. L. Zhou, R. E. Dickinson, A. Dai, P. Dirmeyer, Detection and attribution of anthropogenic forcing to diurnal temperature range changes from 1950 to 1999: Comparing multi-model simulations with observations. Clim. Dyn. 35, 1289–1307 (2010). 32. T.-J. Zhou, R.-C. Yu, Atmospheric water vapor transport associated with typical anomalous
summer rainfall patterns in China. J. Geophys. Res. Atmos. 110, D08104 (2005). 33. B. Wang, J. Liu, H.-J. Kim, P. J. Webster, S.-Y. Yim, B. Xiang, Northern Hemisphere summer
monsoon intensified by mega-El Niño/southern oscillation and Atlantic multidecadal oscillation. Proc. Natl. Acad. Sci. U.S.A. 110, 5347–5352 (2013).
34. S. Peng, A. Chen, L. Xu, C. Cao, J. Fang, R. B. Myneni, J. E. Pinzon, C. J. Tucker, S. Piao, Recent change of vegetation growth trend in China. Environ. Res. Lett. 6, 044027 (2011). 35. L. Zou, T. Zhou, L. Li, J. Zhang, East China summer rainfall variability of 1958–2000:
Dynamical downscaling with a variable-resolution AGCM. J. Climate 23, 6394–6408 (2010).
36. R. Huang, The East Asia/Pacific pattern teleconnection of summer circulation and climate anomaly in East Asia. Acta Meteorol. Sin. 6, 25–37 (1992).
37. Y. Chen, P. Zhai, Synoptic-scale precursors of the East Asia/Pacific teleconnection pattern responsible for persistent extreme precipitation in the Yangtze River Valley. Q. J. R. Meteorol. Soc. 141, 1389–1403 (2015).
38. Y. Kosaka, H. Nakamura, Structure and dynamics of the summertime Pacific-Japan teleconnection pattern. Q. J. R. Meteorol. Soc. 132, 2009–2030 (2006).
39. T. R. McVicar, L. Li, T. G. Van Niel, L. Zhang, R. Li, Q. Yang, X. Zhang, X. Mu, Z. Wen, W. Liu, Y. Zhao, Z. Liu, P. Gao, Developing a decision support tool for China’s re-vegetation program: Simulating regional impacts of afforestation on average annual streamflow in the Loess Plateau. For. Ecol. Manage. 251, 65–81 (2007).
40. X. He, Z. Li, M. Hao, K. Tang, F. Zheng, Down-scale analysis for water scarcity in response to soil–water conservation on Loess Plateau of China. Agric. Ecosyst. Environ. 94, 355–361 (2003).
41. M.-m. Li, A.-t. Liu, C.-j. Zou, W.-d. Xu, H. Shimizu, K.-y. Wang, An overview of the “Three-North” Shelterbelt project in China. For. Stud. China 14, 70–79 (2012). 42. Y. Yao, X. Wang, Z. Zeng, Y. Liu, S. Peng, Z. Zhu, S. Piao, The effect of afforestation on soil
moisture content in northeastern China. PLOS ONE 11, e0160776 (2016).
43. S. Cao, Why large-scale afforestation efforts in China have failed to solve the desertification problem. Environ. Sci. Technol. 42, 1826–1831 (2008).
44. X. Chen, Y. Su, J. Liao, J. Shang, T. Dong, C. Wang, W. Liu, G. Zhou, L. Liu, Detecting significant decreasing trends of land surface soil moisture in eastern China during the past three decades (1979–2010). J. Geophys. Res. 121, 5177–5192 (2016).
45. J. Li, R. Liu, S. C. Liu, C.-J. Shiu, J. Wang, Y. Zhang, Trends in aerosol optical depth in northern China retrieved from sunshine duration data. Geophys. Res. Lett. 43, 431–439 (2016).
46. J. Duan, J. Mao, Influence of aerosol on regional precipitation in North China. Chin. Sci. Bull. 54, 474–483 (2009).
47. J. Liu, S. Li, Z. Ouyang, C. Tam, X. Chen, Ecological and socioeconomic effects of China’s policies for ecosystem services. Proc. Natl. Acad. Sci. U.S.A. 105, 9477–9482 (2008). 48. Q. Zhang, Y. Li, Climatic variation of rainfall and rain day in southwest China for last
48 years. Plateau Meteorol. 33, 372–383 (2014).
49. J. He, M. Zhang, P. Wang, S. Wang, X. Wang, Climate characteristics of the extreme drought events in Southwest China during recent 50 years. Acta Geogr. Sin. 9, 1179–1190 (2011). 50. Z. Li, W. K.-M. Lau, V. Ramanathan, G. Wu, Y. Ding, M. G. Manoj, J. Liu, Y. Qian, J. Li, T. Zhou,
J. Fan, D. Rosenfeld, Y. Ming, Y. Wang, J. Huang, B. Wang, X. Xu, S.-S. Lee, M. Cribb, F. Zhang, X. Yang, C. Zhao, T. Takemura, K. Wang, X. Xia, Y. Yin, H. Zhang, J. Guo, P. M. Zhai, N. Sugimoto, S. S. Babu, G. P. Brasseur, Aerosol and monsoon climate interactions over Asia. Rev. Geophys. 54, 866–929 (2016).
51. Z. Zhu, J. Bi, Y. Pan, S. Ganguly, A. Anav, L. Xu, A. Samanta, S. Piao, R. R. Nemani, R. B. Myneni, Global data sets of vegetation Leaf Area Index (LAI) 3g and Fraction of Photosynthetically Active Radiation (FPAR) 3g derived from Global Inventory Modeling and Mapping Studies (GIMMS) Normalized Difference Vegetation Index (NDVI3g) for the period 1981 to 2011. Remote Sens. 5, 927–948 (2013).
52. Chinese Academy of Sciences, Editorial Committee of Chinese Vegetation Atlas, 1:1 000 000 Vegetation Atlas of China (Science Press, 2001).
53. State Forestry Administration of the People’s Republic of China, Eighth National Forest Resource Inventory Report (2009-2013) (State Forestry Administration of the People’s Republic of China, 2014).
54. Z.-X. Li, Ensemble atmospheric GCM simulation of climate interannual variability from 1979 to 1994. J. Climate 12, 986–1001 (1999).
55. G. N. Krinner, N. Viovy, N. de Noblet-Ducoudré, J. Ogée, J. Polcher, P. Friedlingstein, P. Ciais, S. Sitch, I. C. Prentice, A dynamic global vegetation model for studies of the coupled atmosphere-biosphere system. Global Biogeochem. Cycles 19, GB1015 (2005). 56. N. I. Ducoudré, K. Laval, A. Perrier, SECHIBA, a new set of parameterizations of the
hydrologic exchanges at the land-atmosphere interface within the LMD atmospheric general circulation model. J. Climate 6, 248–273 (1993).
57. S. I. Seneviratne, M. Wilhelm, T. Stanelle, B. van den Hurk, S. Hagemann, A. Berg, F. Cheruy, M. E. Higgins, A. Meier, V. Brovkin, M. Claussen, A. Ducharne, J.-L. Dufresne, K. L. Findell, J. Ghattas, D. M. Lawrence, S. Malyshev, M. Rummukainen, B. Smith, Impact of soil moisture-climate feedbacks on CMIP5 projections: First results from the GLACE-CMIP5 experiment. Geophys. Res. Lett. 40, 5212–5217 (2013).
58. S. Baidya Roy, C. P. Weaver, D. S. Nolan, R. Avissar, A preferred scale for landscape forced mesoscale circulations? J. Geophys. Res. Atmos. 108, 8854 (2003).
59. M. Jung, M. Reichstein, P. Ciais, S. I. Seneviratne, J. Sheffield, M. L. Goulden, G. Bonan, A. Cescatti, J. Chen, R. de Jeu, A. J. Dolman, W. Eugster, D. Gerten, D. Gianelle, N. Gobron, J. Heinke, J. Kimball, B. E. Law, L. Montagnani, Q. Mu, B. Mueller, K. Oleson, D. Papale, A. D. Richardson, O. Roupsard, S. Running, E. Tomelleri, N. Viovy, U. Weber, C. Williams, E. Wood, S. Zaehle, K. Zhang, Recent decline in the global land evapotranspiration trend due to limited moisture supply. Nature 467, 951–954 (2010).
60. Z. Zeng, T. Wang, F. Zhou, P. Ciais, J. Mao, X. Shi, S. Piao, A worldwide analysis of spatiotemporal changes in water balance-based evapotranspiration from 1982 to 2009. J. Geophys. Res. Atmos. 119, 1186–1202 (2014).
61. I. Harris, P. D. Jones, T. J. Osborn, D. H. Lister, Updated high-resolution grids of monthly climatic observations—The CRU TS3.10 Dataset. Int. J. Climatol. 34, 623–642 (2014). 62. A. Becker, P. Finger, A. Meyer-Christoffer, B. Rudolf, K. Schamm, U. Schneider, M. Ziese,
A description of the global land-surface precipitation data products of the Global Precipitation Climatology Centre with sample applications including centennial (trend) analysis from 1901-present. Earth Syst. Sci. Data 5, 71–99 (2013).
on October 27, 2020
http://advances.sciencemag.org/
63. E. Nickl, C. J. Willmott, K. Matsuura, S. M. Robeson, Changes in annual land-surface precipitation over the twentieth and early twenty-first century. Ann. Assoc. Am. Geogr. 100, 729–739 (2010).
64. B. Martens, D. G. Miralles, H. Lievens, R. van der Schalie, R. A. M. de Jeu, D. Fernández-Prieto, H. E. Beck, W. A. Dorigo, N. E. C. Verhoest, GLEAM v3: Satellite-based land evaporation and root-zone soil moisture. Geosci. Model Dev. 10, 1903–1925 (2017).
65. D. P. Dee, S. M. Uppala, A. J. Simmons, P. Berrisford, P. Poli, S. Kobayashi, U. Andrae, M. A. Balmaseda, G. Balsamo, P. Bauer, P. Bechtold, A. C. M. Beljaars, L. van de Berg, J. Bidlot, N. Bormann, C. Delsol, R. Dragani, M. Fuentes, A. J. Geer, L. Haimberger, S. B. Healy, H. Hersbach, E. V. Hólm, L. Isaksen, P. Kållberg, M. Köhler, M. Martricardi, A. P. McNally, B. M. Monge-Sanz, J.-J. Morcrette, B.-K. Park, C. Peubey, P. de Rosnay, C. Tavolato, J.-N. Thépaut, F. Vitart, The ERA-Interim reanalysis: Configuration and performance of the data assimilation system. Q. J. R. Meteorol. Soc. 137, 553–597 (2011).
66. E. Kalnay, M. Kanamitsu, R. Kistler, W. Collins, D. Deaven, L. Gandin, M. Iredell, S. Saha, G. White, J. Woollen, Y. Zhu, A. Leetmaa, R. Reynolds, M. Chelliah, W. Ebisuzaki, W. Higgins, J. Janowiak, K. C. Mo, C. Ropelewski, J. Wang, R. Jenne, D. Joseph, The NCEP/NCAR 40-Year Reanalysis project. Bull. Am. Meteorol. Soc. 77, 437–471 (1996).
67. H. Li, A. Dai, T. Zhou, J. Lu, Responses of East Asian summer monsoon to historical SST and atmospheric forcing during 1950–2000. Clim. Dyn. 34, 501–514 (2010).
Acknowledgments: The simulations were performed on the platform of the National Supercomputer Center in Tianjin, China (www.nscc-tj.gov.cn/). Funding: This study was supported by the National Natural Science Foundation of China (41561134016 and 41530528), the National Youth Top-notch Talent Support Program in China, and the 111 Project (B14001). Author contributions: S. Piao, L.Z.X.L., and Y.L. designed the research; Y.L. and L.Z.X.L. performed the simulations; Y.L. performed the analysis; Y.L. and S. Piao wrote the draft; and A.C., X.W., P.C., L.H., X.L., S. Peng, Z.Z., K.W., and L.Z. contributed to the interpretation of the results and writing of the paper. Competing interests: The authors declare that they have no competing interests. Data and materials availability: All data needed to evaluate the conclusions in the paper are present in the paper and/or the Supplementary Materials. Additional data related to this paper may be requested from the authors.
Submitted 6 November 2017 Accepted 23 March 2018 Published 9 May 2018 10.1126/sciadv.aar4182
Citation:Y. Li, S. Piao, L. Z. X. Li, A. Chen, X. Wang, P. Ciais, L. Huang, X. Lian, S. Peng, Z. Zeng,
K. Wang, L. Zhou, Divergent hydrological response to large-scale afforestation and vegetation greening in China. Sci. Adv. 4, eaar4182 (2018).
on October 27, 2020
http://advances.sciencemag.org/
Zhenzhong Zeng, Kai Wang and Liming Zhou
Yue Li, Shilong Piao, Laurent Z. X. Li, Anping Chen, Xuhui Wang, Philippe Ciais, Ling Huang, Xu Lian, Shushi Peng,
DOI: 10.1126/sciadv.aar4182 (5), eaar4182. 4
Sci Adv
ARTICLE TOOLS http://advances.sciencemag.org/content/4/5/eaar4182
MATERIALS
SUPPLEMENTARY http://advances.sciencemag.org/content/suppl/2018/05/04/4.5.eaar4182.DC1
REFERENCES
http://advances.sciencemag.org/content/4/5/eaar4182#BIBL
This article cites 64 articles, 8 of which you can access for free
PERMISSIONS http://www.sciencemag.org/help/reprints-and-permissions
Terms of Service
Use of this article is subject to the
is a registered trademark of AAAS. Science Advances
York Avenue NW, Washington, DC 20005. The title
(ISSN 2375-2548) is published by the American Association for the Advancement of Science, 1200 New Science Advances
License 4.0 (CC BY-NC).
Science. No claim to original U.S. Government Works. Distributed under a Creative Commons Attribution NonCommercial Copyright © 2018 The Authors, some rights reserved; exclusive licensee American Association for the Advancement of
on October 27, 2020
http://advances.sciencemag.org/