HAL Id: hal-02830821
https://hal.inrae.fr/hal-02830821
Submitted on 7 Jun 2020HAL is a multi-disciplinary open access archive for the deposit and dissemination of sci-entific research documents, whether they are pub-lished or not. The documents may come from teaching and research institutions in France or abroad, or from public or private research centers.
L’archive ouverte pluridisciplinaire HAL, est destinée au dépôt et à la diffusion de documents scientifiques de niveau recherche, publiés ou non, émanant des établissements d’enseignement et de recherche français ou étrangers, des laboratoires publics ou privés.
Séquestration de carbone par des plantations de
cocotiers au Vanuatu
Olivier Roupsard, Nathalie Lamanda, Jean-Marc Bonnefond, Yann Nouvellon,
Paul Berbigier, Richard Joffre, Mark Rankin Irvine, Jean Dauzat, Christophe
Jourdan, Daniel Epron, et al.
To cite this version:
Olivier Roupsard, Nathalie Lamanda, Jean-Marc Bonnefond, Yann Nouvellon, Paul Berbigier, et al.. Séquestration de carbone par des plantations de cocotiers au Vanuatu. Assises de la recherche française dans le Pacifique, Aug 2004, Nouméa, Nouvelle-Calédonie. 1 p. �hal-02830821�
Partitioning Light and Water Use Efficiencies (LUE, WUE) between cover tree (Cocos
nucifera L.) and grass under-storey, using eddy covariance, LAI-2000 and Net Primary
Productivity (NPP).
Roupsard Olivier1,2, Dauzat Jean1, Nouvellon Yann1, Jourdan Christophe1, Bonnefond Jean-Marc3, Berbigier Paul3, Navarro Muriel1,2, Epron Daniel4, Saint-André Laurent1, Mialet-Serra Isabelle1, Hamel Olivier1 and Bouillet Jean-Pierre1.
1
CIRAD, Avenue d’Agropolis, 34398 Montpellier cedex 5, France; 2 VARTC, BP 231 Santo, Vanuatu ; 3 INRA-EPHYSE, BP 81 F-33883 Villenave d’Ornon cedex, France; 4 UMR INRA UHP Ecologie et Ecophysiologie Forestières, Nancy-Université, BP 239, 54506 Vandoeuvre les Nancy, France
Abstract
Net Primary Productivity (NPP) is a key driver of ecosystem C balance. Its seasonal and annual variations can be measured directly at the stand level. However, estimating NPP on larger areas would require indirect methods such as: (i) process models, e.g. ε-models based on the fraction of intercepted PAR (fIPAR) and on the light use efficiency (LUE = NPP/IPAR), or else models based on the water-use-efficiency (WUE = NPP/E, where E = evapo-transpiration); (ii) remote sensing, to estimate fIPAR (from the Normalized Difference Vegetation Index: NDVI) or else E (from the energy balance closure). However, two main impediments may interfere with such estimations of NPP: first, LUE and/or WUE may vary in time, and second, remote sensing may be unable to distinguish between the layers of the stands, which sounds critical for agroforestry systems.
In a 20-year-old coconut grove from Vanuatu (South Pacific), we monitored NPP, E, LUE and WUE separately for the coconut layer (subscript “c”; LAI = 3; canopy cover around 75%) and for the under-storey composed of grasses (subscript “g”; LAI = 2.7). Light interception by the coconuts (IPARc) was estimated by optical indirect techniques (LAI-2000). Evapotranspiration of
the whole stand (subscript “s”), Es, was measured directly by eddy-covariance, and the
contribution of the coconuts was assessed by sapflow (Tc). Light interception and
evapotranspiration from the under-storey (IPARg and Eg) was estimated from the difference. We
reported elsewhere that NPPc represented 75% of NPPs (amounting to 32 tDM ha -1
year-1), Tc
represented 68% of Es (amounting to 950 mm year -1
)and IPARc amounted to 73% of incident
PAR. This partitioning results were very close to the rule-of-thumb evaluation, based on the simple observation of the canopy closeness (0.75%).
We found here that WUEs (mean annual value = 3.7 gDM kgH2O-1) was mainly driven by the
coconuts (4.0), and to a lesser extent by the understorey (2.4). WUEs had high seasonal
variations, between 2 and 6, being dependent mainly on Es rather than on NPPs. LUEs (mean
annual value = 0.29 gDM molPARinc. -1
) appeared to be similar for coconuts and for the understorey. LUEs also had high seasonal variations, between 0.18 and 0.52, which was mainly explained by
seasonal variations of incident PAR rather than by variations of NPP.
The large seasonality observed for LUE and WUE could be modelled empirically (0.82 < R2 < 0.95), which appears to be useful for running large scale process-models on similar plantations.
Introduction
Net primary productivity (NPP), defined as the organic matter produced (build-up of standing biomass + mortality) over a specified interval (Clark et al. 2001) is a key driver for ecosystem C balance. Reviewing NPP across the major biomes, Gower et al. (1999), Pregitzer and Euskirchen (2004) and Luyssaert et al. (2007) stressed the need for more NPP surveys in tropical ecosystems and forests, especially for the southern hemisphere, for young and middle-aged classes, and for the belowground compartment. NPP or C balance assessments, and process models remain scarce for tree-crops (Cocos nucifera or coconut palm, Elais guineensis or oil palm, Coffea sp. or coffee,
Theobroma cacao or cocoa, Hevea brasiliensis or rubber, etc.), although these perennial crops
occupy over 47 Mha in the humid tropics (FAO 2003). The coconut tree (Cocos nucifera L.) is the largest contributor (23% of that area), being a multi-purpose tree-crop, with important domestic and industrial uses and opportunities for the Clean Development Mechanism (CDM) (Tan et al. 2004, Roupsard et al. 2004).
The direct monitoring of NPP, for both coconut and grass layers of an adult stand, has recently been reported by Navarro et al (2007). Spatialisation at the scale of larger coconut groves, requires indirect methods for estimating NPP such as: (i) process models: e.g. ε-models (Monteith, 1972; Gower et al., 1999; Nouvellon et al., 2000) based on the fraction of intercepted PAR, (fIPAR), on the light use efficiency (LUE = NPP/IPAR), or on water-use-efficiency (WUE = NPP/E, where E = evapo-transpiration); (ii) remote sensing, used to estimate fIPAR (from Normalized Difference Vegetation Index, NDVI) or E (from energy balance) on large scales and to drive the process models (e.g. Earth Observing System, EOS).
The partitioning of evapo-transpiration of the same stand has been reported by Roupsard et al (2006). Roupsard et al (2007) also described the partitioning of IPAR using field optical methods (LAI-2000) and proposed a simple model to estimate fIPAR in various coconut canopies differing by planting density and age, which was designed as a tool to calibrate remote sensing estimations of fIPAR. However, remote sensing usually provides an integrated estimation of
fIPAR, without distinction of the storeys. Further distinction of NPP for both coconut and
under-storey layers requires separate assessment of LUE or WUE at two or more levels. In addition, process models are prone to seasonality of WUE and LUE, and it is proposed here to assess their variability and to highlight their key dependence factors.
The aim of this paper is: (i) to describe the seasonal and interannual variations of WUE and LUE in both strata of a coconut stand (coconut palm + grass under-storey); (ii) to assess the key seasonal dependence factors of WUE and LUE for the purpose of modeling and upscaling.
Materials and Methods Location, climate and stand
The study was carried out during three years, 2002 to 2004, in a mature coconut plantation, 19-21 years after planting (YAP), which was part of the Vanuatu Agricultural Research and Technical Centre (VARTC), on Espiritu Santo, Vanuatu, South Pacific (15° 26.6´ S, 167° 11.5´ E; altitude 80 masl). The climate was tropical and humid. No hurricane or El-Niño event affected this experiment. The growing conditions (soil texture and fertility, absence of seasonal water shortage, climate) were considered to be close-to-optimum (Roupsard et al. 2006).
The stand had been row-planted in 1983 with the Vanuatu Red Dwarf x Vanuatu Tall (VRD x VTT) high-yielding hybrid coconut variety (Labouisse et al. 2005). The planting design was triangular and equilateral. Coconut tree canopies covered around 75% of the ground. The grass under-storey, including mainly Paspalum sp. (21% of soil coverage), Mimosa pudica (11%)
Desmodium heterophyllum (9%), Mikania micrantha (9%) and Sida sp. (8%). In the clear
interrow (accounting for 49% of the area), the grass was managed by slashing every 2-3 months but was left untouched in the windrow. The true leaf area index (LAI), obtained by destructive sampling, was similar for both layers; i.e. around three (Navarro et al, 2007).
NPP of coconut tree (NPPc) and grass (NPPg)
The NPP experiment has been reported in Navarro et al (2007). Briefly, for every plant organ monitored, net primary productivity (NPP) was linked to dry mass (DM) variations over time (t, on a monthly basis) and to mortality or litter production (L), as follows:
L
dt
DM
NPP
=
∆
+
(1)Sampling of 10 trees was stratified, based on a preliminary stand survey of tree height and nut load distributions. They were monitored non-destructively (January 2002 to December 2005, 19 to 22 YAP), climbed every month (2002-2003) and then every week (2004-2005), i.e. 1,200 climbs to measure nut growth, new leaf emission and stem height. Above ground NPP was derived, using specific allometric equations developed by Navarro et al (2007), based on destructive samplings (10 other representative trees felled for biomass; sub-samples dried in a ventilated oven at T° = 70°C to constant weight)). Belowground tree NPP was assessed by large rhizotrons and sequential trenching, in order to assess root lifespan and turnover.
Above-ground grass NPP was assessed by successive harvests (n = 8), during 18 months between 2002 and 2004, within in two subplots, covering a total of 101 m2 and representative of the horizontal heterogeneity. Those results were extrapolated to the entire 2002-2004 period. Below-ground, NPPg was estimated from root:shoot allocation ratios available in the literature for
tropical fertile and wet grasslands (Scholes and Hall 1996; House and Hall 2001).
Although NPPc has been monitored more accurately than NPPg, NPPs agreed very well, on a
yearly basis, with the difference between measured GPP (the ecosystem photosynthesis, measured by eddy-covariance and reported in Luysseart et al., 2007) and Ra (the autotrophic
respiration), supporting that at least on a yearly basis, NPPs and its partitioning were realistic
(Navarro et al., 2007).
Micro-climate and radiation measurements and models
Micro-climate variables were logged at reference height (22 m on top of the eddy covariance tower) on a CR10X and AM416 Multiplexer (Campbell Scientific, Shepshed, UK). The measurement period was 30 s, integrated half-hourly. Instruments used were: global radiation-silicon cell pyranometer SKS1110 (Skye Inst. Ltd); net radiation-NR-Lite (Kipp & Zonen, Delft, The Netherlands); incident photosynthetic photon flux density (Qp)-home-made probe (Dauzat and Eroy, 1997) calibrated against commercial probes; temperature and humidity-MP103A (Rotronic, Bassersdorf, Germany); rainfall tipping-bucket-ARG100 (R.M. Young, MI, USA); wind-speed and direction-03001 Wind Sentry ARG100 (R.M. Young, MI, USA).
Solar position was calculated from the geometry of planetary rotation and revolution. Solar elevation angle (β), solar declination angle, hour angle of the sun, solar noon, equation of time, day angle and extra-terrestrial radiation (Rx) were derived from FAO (1998) models. The fraction
of diffuse radiation (Rd/Rg) was computed half-hourly, based on the ratio between global
radiation, Rg and extra-terrestrial radiation, Rx, as described by Spitters et al. (1986).
Light interception by coconut (IPARc) and grass (IPARg) layers
fIPAR (the fraction of intercepted PAR, i.e. the complement of PAR transmittance below the
canopy) can be measured at the scale of a canopy using indirect optical gap-fraction methods, such as LAI-2000 Plant Canopy Analyser (Welles and Norman, 1991; Weiss et al., 2004). In the
same coconut plantation as studied here, Roupsard et al. (2007) reported successful comparison between LAI-2000 field measurements and 3D architectural model (3DM) simulations of the gap-fractions (related to cos(β), for beam and for diffuse PAR) and also for structural characteristics (leaf angle distribution function). Coconut fIPAR (fIPARc) was thus inferred on a
semi-hourly time-step between 2002 and 2004, as the inverse of the simulated gap-fractions. The intercepted PAR (IPARc: µmolPAR m-2 s-1) was derived, using the measured instant PARi, and its
partitioning into beam and diffuse radiation.
Grass fIPAR (fIPARg) was assumed to represent all the radiation transmitted by the coconut
canopy, which sounds reasonable, considering that the cumulated LAI (coconut + grass) was around 6 (little radiation assumed to impinge on the soil).
Evapo-transpiration
Evapo-transpiration results have been reported in detail by Roupsard et al (2006). Briefly, the experiment was set up in accordance with the Carboeuroflux recommendations (Aubinet et al., 2000). Eddy-covariance measurements were performed continuously above the canopy (22 m), yielding the evapo-transpiration of the stand, Es. 3D wind components and temperature were
measured with a WindMaster Pro ultrasonic anemometer (Gill Instruments, Lymington, UK) at 10 Hz. H2O fluctuations were measured with a Li-7500 open path (LiCor, Lincoln, NE, USA).
Raw data were collected and pre-processed by “Tourbillon” software (INRA-Bioclimatologie, Bordeaux, France) for a time-integration period of 300 s. Raw-data were post-processed using EdiRe software (University of Edinburgh, UK) into half-hourly values. All data were de-spiked according to variance filters, the axes were rotated three times in order to fit the “natural wind coordinate system” (McMillen, 1998; Lee et al., 2004), all data were linearly de-trended, and vapour fluxes were corrected for buoyancy (Webb et al., 1980).
Tree transpiration (Tc) was measured by sapflow (Granier, 1985), on the 10 trees monitored for
NPP, and using home-made probes specifically calibrated in the laboratory, and validated in the field (Roupsard et al, 2006).
It is assumed here that Es-Tc yields Eg, the evapo-transpiration of the under-storey (grass + soil)
during non-rainy days. For rainy days, the unknown contribution of rain interception and re-evaporation by the coconut and under-storey strata make the estimation un-realistic. Rainy days were thus discarded from the Eg dataset, leaving 50% of data.
Results and Discussion Light interception
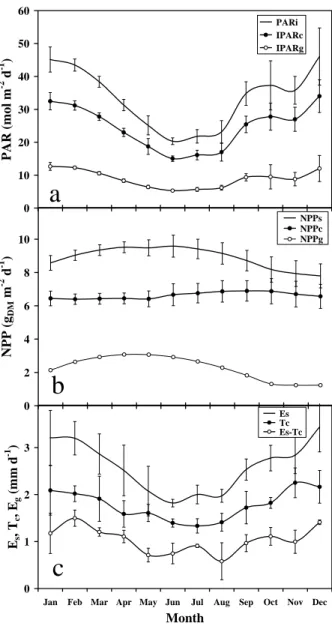
Incident PAR (PARi) showed high seasonal variation by a factor of 2.4 (Fig.1a; between 19 mol
m-2 d-1 (cooler season) and 46 mol m-2 d-1 (warm season)), due to variations of solar angle (vertical in November and in February) and of cloudiness (the fraction of diffuse radiation ranged from 0.5 during the warm season to 0.75 during the cool season). PARi drove the seasonal
variations of temperature and of VPD, more rainfall occurred during the warm period. As an average, PAR intercepted by the coconut canopy (IPARc) amounted to 73 ± 1% (SD) of PARi,
which was close to the rule-of-thumb, considering that the coconut canopy covered around 75% of the soil. For low solar elevations (cooler season, but also mornings and evenings), PAR available for the under-storey (IPARg) could become very low. However, the magnitude of
variations in PARi, IPARc and IPARg remained similar (factor between 2.4 and 3).
NPP
Compared with radiation, the temporal variation of stand and coconut NPP (Fig. 1b) was less (factor 1.3). As an average, NPPc represented 75% of NPPs, peaking around September-October,
when light available for the under-storey was moderate, due to a large investment in the growth of the fruit compartment (Navarro et al, 2007). Interestingly, seasonal variations of NPPs
appeared to be more influenced by the under-storey (NPPg: seasonal variation with a factor 2.5),
than by coconuts. The under-storey appeared to be much more prone to seasonal NPP limitations than the coconut layer, due to insufficient incoming radiation or occasionally from superficial soil water depletion, which did not affect the coconut trees (rooted down to 3 meters).
Transpiration
The time-course of stand evapo-transpiration (Fig. 1c) varied seasonally between 1.6 and 4 mm d
-1
(factor of 2.6; similar to radiation), whereas for coconut it was mitigated down to a factor of 1.7, probably as a consequence of stomatal regulation of transpiration during conditions of high VPD (Roupsard et al., 2006). On a yearly basis,T represented 69% of E.
Eg = Es-Tc, computed only for non-rainy days only, fluctuated seasonally by a factor of more than
sixteen, confirming that the under-storey was much more affected by the microclimate and superficial soil water conditions than the upper-layer. As a yearly average, it represented only 31% of Es, which is realistic.
LUE
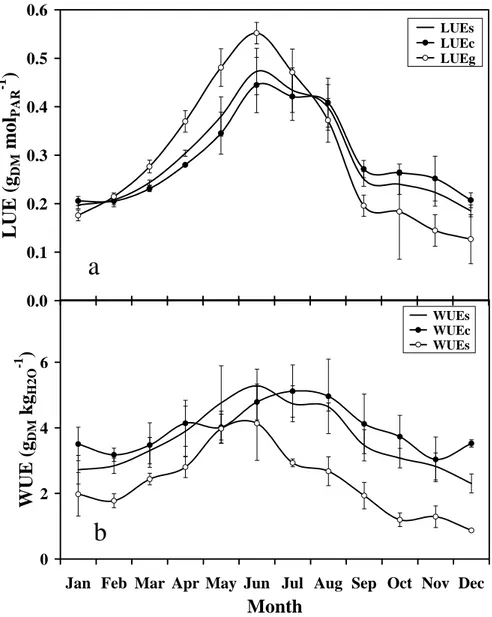
As a yearly average (Fig. 2a), LUE was very similar (around 0.3 gDM molPAR-1)for both layers
(coconut and grass). Seasonally, LUEvaried similarly for stand and coconut layers by a factor of 3, i.e. between 0.17 and 0.52 gDM molPAR
-1
. However, for grass, the factor was six.
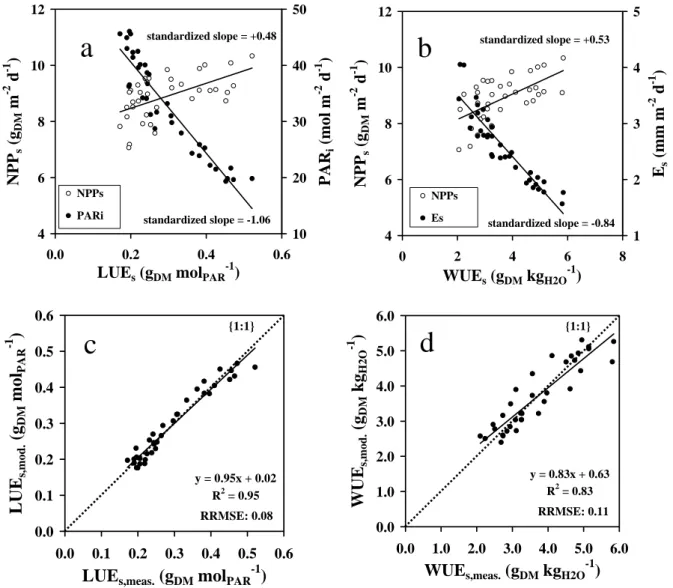
Large seasonal variations of LUE might appear detrimental to estimations of NPP by ε-process models. In order to cope with that limitation, we attempted to interpret and model the seasonal variations of LUE. LUES was plotted against PARi and NPPs in Fig. 3a. When the same variables
were standardized from 0 to 1 in order to remain comparable (data not shown), the respective slopes ranged from -1.06 to +0.48, i.e. by a factor of around 2.2 in absolute value, indicating that LUEs was much more relying on PARi than on NPPs. This was consistent with rather low
seasonal variations for NPP. The coefficient of determination of the relationship (R2) was not presented here, considering that neither NPPs nor PARi were independent from LUEs
(auto-correlated variables).
For every layer, LUE appeared to be maximum during the cool season (Fig. 2a), when PARi was
minimum, the sun elevation (β) was lower, and the fraction of diffuse radiation (fDIF) was higher. We propose here (Fig. 3c) a multiple linear regression model of LUE using only factors that can be remotely sensed or computed from climate files, in the form:
d
c
fDIF
b
PAR
a
LUE
=
⋅
i+
⋅
+
⋅
sin
β
+
(2)where a, b, c and d are parameters, adjusted empirically using the least square method.
Ninety-five percent of the variability of LUEs was predicted using this simple empirical model,
with a RRMSE of only 8%.
WUE
As a yearly average (Fig. 2b), WUE was quite similar (around 3.7 and 4.0 gDM kgH2O-1)for stand
and coconut, respectively. For grass, it was only 2.4 gDM kgH2O-1. Also seasonally, WUEvaried
quite similarly for stand and coconut layers by a factor of 2 to 2.8. However, for grass, the factor was five. For every layer, WUE appeared to be maximum during the cool season (Fig. 2b), when PARi was minimum.
WUEs was plotted against Es and NPPs in Fig. 3b. When the same variables were standardized
from 0 to 1 in order to remain comparable (data not shown), the respective slopes ranged from -0.84 to +0.53, i.e. by a factor of around 1.6 in absolute value, indicating that WUEs was much
more relying on Es than on NPPs. Again, the coefficient of determination of the relationship (R2)
was not presented here.
We propose a multiple linear regression model of WUE, using only factors that can be remotely sensed or computed from climate files (Fig. 3d), in the form:
d
c
VPD
b
PAR
a
WUE
=
⋅
i+
⋅
+
⋅
sin
β
+
(3)Eighty-three percent of he variability of WUEs was predicted by using this simple empirical
model, with a RRMSE of 11%.
Conclusions
Although the upper-layer and the under-storey received rather constant fractions of the incoming radiation, the variability in NPP, evapo-transpiration, LUE and WUE appeared much larger for the under-storey, which we interpret to originate from occasional very low amounts of light and also occasional drought in the superficial soil layers, worsened by shallow rooting of grass, as compared to coconuts. The under-storey thus appeared to be less bulked than the over-storey for major physiological variables. This observation appears somewhat counter-intuitive and would deserve comparison with other multi-layer or agroforestry systems.
Important seasonal variations in LUE and WUE might appear as an impediment for inferring NPP from remote sensing of fIPAR and of evapo-transpiration. However the simple empirical models proposed here can cope with such a seasonal variability, as the only use variables that can be remotely-sensed and yield reasonably well.
Surprisingly, the yearly average of LUE remained rather similar for the stand and for each of its layers. It would be of interest to understand if this observation would be confirmed in plantations displaying different densities. In this case, it might simplify the problem of estimating LUE in two-layer stands by remote sensing.
Acknowledgements
This work was funded by the Centre de cooperation Internationale en Recherche Agronomique pour le Développement (CIRAD, ATP-Carbone, ATP-Réserves and ATP-Caresys) and by the Languedoc-Roussillon Region (France). The project was hosted by the Vanuatu Agricultural Research and Technical Centre (VARTC). We gratefully thank all the staff at VARTC, and especially Antoine Joseph and Thomas Meltecoin (tree climbers), Christian Noël, Pedro Toré and Lency Joe (root excavators), John Freddy (grass surveys) and Serge Taga (electronics). Many thanks also to Samuel Menzies, Marie Melteras and Roger Malapa for their constant support.
References
Aubinet M, Grelle A, Ibrom A, Rannik U, Moncrieff J, Foken T, Kowalski A S, Martin P H, Berbigier P, Bernhofer C, Clement R, Elbers J, Granier A, Grunwald T, Morgenstern K, Pilegaard K, Rebmann C, Snijders W, Valentini R and Vesala T 2000 Estimates of the annual net carbon and water exchange of forests: the Euroflux methodology. Advances in Ecological Research 30, 113-175.
Clark D A, Brown S, Kicklighter D W, Chambers J Q, Thomlinson J R and Ni J 2001. Measuring net primary productivity in forests: concepts and field methods. Ecological Applications 11, 356-370.
FAO 1998 Crop evapotranspiration. Guidelines for computing crop water requirements. FAO drainage and irrigation papers, 56, 301 pp.
Gower S T, Kucharic C J and Norman J M 1999. Direct and indirect estimation of leaf area index, fAPAR and net primary production of terrestrial ecosystems. Remote Sens. Environ 70, 23-51.
Granier A 1985 Une nouvelle méthode pour la mesure du flux de séve dans les troncs des arbres. Ann. Sci. For. 42, 193-200.
House J I and Hall D O 2001 Productivity of tropical savannas and grasslands. In Terrestrial global productivity, Eds J Roy, B Saugier and H A Mooney. pp 363-400. Academic Press, San Diego.
Labouisse J-P, Sileye T, Morin J-P, Hamelin C, Baudouin L, Bourdeix R and A. R 2005 Coconut (Cocos nucifera L.) genetic improvement in Vanuatu: overview of research achievements from 1962 to 2002. Part 2: Improvement of the Vanuatu Tall by hybridization. Oléagineux, Corps Gras, Lipides 12, 170-179.
Lee X, Finnigan J and Paw U K T 2004 Coordinate system and flux bias error. In Handbook of micrometeorology, Ed X Lee, Massman W., Law B. Kluwer: pp 33-66.
Luyssaert S., M. Jung, A.D. Richardson, M. Reichstein, D. Papale, S.L. Piao, E.-D. Schulze, L.Wingate, G. Matteucci, L. Aragao, M. Aubinet, C. Beer, C. Bernhofer, K.G. Black, D. Bonal, J.-M. Bonnefond, J.Chambers, P. Ciais, B. Cook, K.J. Davis, A.J. Dolman, B. Gielen, M. Goulden, J. Grace, A. Granier, A. Grelle, T. Griffis, T. Grünwald, G. Guidolotti, P.J. Hanson, R. Harding, D.Y. Hollinger, L.R. Hutyra, P. Kolari, B. Kruijt, W., Kutsch, F. Lagergren, T. Laurila, B.E. Law, G. Le Maire, A. Lindroth, D. Loustau, Y. Malhi, J. Mateus, M. Migliavacca, L. Misson, L. Montagnani, J. Moncrieff, E. Moors, J.W. Munger, E. Nikinmaa, S.V. Ollinger, G. Pita, C., Rebmann, O. Roupsard, N. Saigusa, M.J. Sanz, G. Seufert, C. Sierra, M.-L. Smith, J. Tang, R. Valentini, T. Vesala and I.A. Janssens (2007). 2007 The CO2-balance of boreal, temperate and tropical forests derived from a global database. Global Change Biology, In Press.
McMillen R T 1988 An eddy-correlation technique with extended applicability to non-simple terrain. Boundary - Layer Meteorol. 43, 231-245.
Mialet-Serra I, Clément-Vidal A, Roupsard O, Jourdan C and Dingkuhn M 2007 Whole-plant adjustments to changing sink-source relationships in coconut (Cocos nucifera L.). Functional Plant Biology. Submitted 06 2007.
Monteith J L 1972 Solar radiation and productivity in tropical ecosystems. J. Appl. Ecol. 9, 747-766.
Navarro M, Jourdan C, Sileye T, Braconnier S, Mialet-Serra I, Saint-Andre L, Dauzat J, Nouvellon Y, Epron D, Bonnefond J M, Berbigier P, Rouziere A, Bouillet J P and Roupsard O 2007 Fruit carbon demand drives NPP in a tropical humid coconut agroforest with high GPP. Tree Physiol. Under revision.
Nouvellon Y, Lo Seen D, Rambal S, Bégué A, Moran M S, Kerr Y and Qi J 2000 Time course of radiation use efficiency in a shortgrass ecosystem: consequences for remotely sensed estimation of primary production. Remote Sens. Environ. 71, 43-55.
Pregitzer K S and Euskirchen E S 2004. Carbon cycling and storage in world forests: biome patterns related to forest age. Global Change Biol 10, 2052-2077.
Roupsard O, Bonnefond J M, Irvine M, Berbigier P, Nouvellon Y, Dauzat J, Taga S, Hamel O, Jourdan C, Saint-Andre L, Mialet-Serra I, Labouisse J P, Epron D, Joffre R, Braconnier S, Rouzière A, Navarro M and Bouillet J P 2006 Partitioning energy and evapo-transpiration above and below a tropical palm canopy. Agricultural and Forest Meteorology 139, 252-268. Roupsard O, Dauzat J, Nouvellon Y, Feintrenie L, Saint-André L, Mialet-Serra I, Braconnier S,
Cross-validating Sun-shade and 3D models of light absorption by a tree-crop canopy. Agricultural and Forest Meteorology. Under revision.
Roupsard O, Hamel O, Rouzière A, Lamanda N and Labouisse J P 2004 Preparing the application of coconut plantations to the Clean Development Mechanism of the Kyoto Protocol. In: Strategies for Enhancing Productivity and Income of Coconut Farmers. Proceedings of the XLI COCOTECH Meeting, Santo-Vanuatu, 5-9 July 2004. Ed.: P. Rethinam. Asian and Pacific Coconut Community: 164-179., 2004. Ed APCC. 12pp.
Scholes R J and Hall D O 1996 The carbon budget of tropical savannas, woodlands and grasslands. In "Global Change: Effects on coniferous forests and grasslands, SCOPE, "(A.I. Breymeyer, D.O.Hall, J.M. Melillo and G.I. Agren, eds.), Vol. 56, pp. 69-100. Wiley, Chichester.
Spitters C J T, Toussaint H A J M and Goudriaan J 1986 Separating the diffuse and direct component of global radiation and its implications for modelling canopy photosynthesis. Part I. Components of incoming radiation. Agric. For. Meteorol. 38, 225- 237.
Tan R R, Culaba A B and Purvis R I 2004 Carbon balance implications of coconut biodiesel utilization in the Philippine automotive transport sector. Biomass and Energy 26, 579-585. Webb E K, Pearman G I and Leuning R 1980 Correction of flux measurements for density effects
due to heat and water vapour transfer. Q. J. R. Meteorol. Soc. 106, 85-100.
Weiss M, Baret F, Smith G J, Jonckheere I and Coppin P 2004 Review of methods for in situ leaf area index (LAI) determination: Part II. Estimation of LAI, errors and sampling. Agric. For. Met. 121, 37-53.
Welles J M and Norman J M 1991 Instrument for indirect Measurement of Canopy Architecture. Agronomy Journal 83, 818-825.
Fig. 1: Seasonal and interannual variations of available photosynthetically active radiation
(PAR), Net Primary Productivity (NPP) and evapo-transpiration (E, T) in a two-layer coconut + grass plantation. a/ Incident PAR (PARi), PAR intercepted by the coconut canopy (IPARc) and
PAR transmitted to the under-storey (IPARg); b/ NPP; c/ Evapo-transpiration of the whole stand
(Es: eddy-covariance), transpiration of the coconut trees (Tc: sapflow) and evapo-transpiration of
the under-storey (Eg = Es -Tc only for non-rainy days, i.e. no rain interception). Subscripts: s:
stand; c: coconut layer; g: grass under-storey. One symbol is a mean monthly average and error bars are SD for three years (2002, 2003, 2004). NPP of grass was observed for 18 months only and extrapolated. Coconut + grass plantation, VARTC-Vanuatu, 2002-2004.
b
0 10 20 30 40 50 60 PAR (mol m -2 d -1 ) PARi IPARc IPARg 0 2 4 6 8 10 NP P (g DM m -2 d -1 ) NPPs NPPc NPPg 0 1 2 3Jan Feb Mar Apr May Jun Jul Aug Sep Oct Nov Dec Month Es , T c , E g (m m d -1 ) Es Tc Es-Tc
a
c
Fig. 2: Seasonal and interannual variations of a/ light-use-efficiency (LUE) and b/
water-use-efficiency (WUE) in a two-layer coconut + grass plantation. Subscripts: s: stand; c: coconut layer; g: grass under-storey. One symbol is a mean monthly average and error bars are SD for three years (2002, 2003, 2004). Coconut + grass plantation, VARTC-Vanuatu, 2002-2004.
b
0.0 0.1 0.2 0.3 0.4 0.5 0.6LUE (g
DMmol
PA R -1)
LUEs LUEc LUEg 0 2 4 6Jan Feb Mar Apr May Jun Jul Aug Sep Oct Nov Dec
Month
WUE (g
DMkg
H2O -1)
WUEs WUEc WUEsa
Fig. 3: Correlations between a/ light-use-efficiency (LUEs) and NPPs or incident PAR (PARi); b/
water-use-efficiency (WUEs) and NPPs or evapo-transpiration (Es); c/ and d/ empirical modelling
of the seasonal variations of LUEs and WUEs, respectively, as a function of variables that can be
remotely sensed (see text). “Standardized slope” is referring to slopes obtained after all variables from Fig. 3a and 3b were standardized from 0 to 1, in order to remain comparable. Subscript “s”: stand. One symbol is a mean monthly average (2002, 2003, 2004). Coconut + grass plantation, VARTC-Vanuatu, 2002-2004.
b
a
y = 0.95x + 0.02 R2 = 0.95 0.0 0.1 0.2 0.3 0.4 0.5 0.6 0.0 0.1 0.2 0.3 0.4 0.5 0.6LUEs,meas. (gDM molPAR -1 ) LU Es, m o d . (g DM mol PAR -1 ) {1:1} RRMSE: 0.08 y = 0.83x + 0.63 R2 = 0.83 0.0 1.0 2.0 3.0 4.0 5.0 6.0 0.0 1.0 2.0 3.0 4.0 5.0 6.0 WUEs,meas. (gDM kgH2O-1) WU Es,m o d. (g DM kg H2 O -1 ) {1:1} RRMSE: 0.11
c
d
4 6 8 10 12 0 2 4 6 8 WUEs (gDM kgH2O-1) NPP s (g DM m -2 d -1 ) 1 2 3 4 5 Es (mm m -2 d -1 ) NPPs Es standardized slope = +0.53 standardized slope = -0.84 4 6 8 10 12 0.0 0.2 0.4 0.6LUEs (gDM molPAR -1 ) NPP s (g DM m -2 d -1 ) 10 20 30 40 50 PAR i (mo l m -2 d -1 ) NPPs PARi standardized slope = +0.48 standardized slope = -1.06