HAL Id: hal-00304620
https://hal.archives-ouvertes.fr/hal-00304620
Submitted on 1 Jan 2001HAL is a multi-disciplinary open access archive for the deposit and dissemination of sci-entific research documents, whether they are pub-lished or not. The documents may come from teaching and research institutions in France or abroad, or from public or private research centers.
L’archive ouverte pluridisciplinaire HAL, est destinée au dépôt et à la diffusion de documents scientifiques de niveau recherche, publiés ou non, émanant des établissements d’enseignement et de recherche français ou étrangers, des laboratoires publics ou privés.
Bohemian Forest and Tatra Mountains during the
Industrial Revolution (1850-2000)
J. Kopácek, J. Veselý, E. Stuchlík
To cite this version:
J. Kopácek, J. Veselý, E. Stuchlík. Sulphur and nitrogen fluxes and budgets in the Bohemian Forest and Tatra Mountains during the Industrial Revolution (1850-2000). Hydrology and Earth System Sciences Discussions, European Geosciences Union, 2001, 5 (3), pp.391-406. �hal-00304620�
Sulphur and nitrogen fluxes and budgets in the Bohemian Forest
and Tatra Mountains during the Industrial Revolution (1850-2000)
Jirí Kopácek
1, Josef Veselý
2and Evzen Stuchlík
3)1 Hydrobiological Institute, AS CR, and Faculty of Biological Sciences, USB, Na Sádkách 7, 370 05 Ceské Budejovice, Czech Republic
2 Czech Geological Survey,Geologická 6, 152 00 Praha 5
3 Department of Hydrobiology, Charles University, Vinicná 7, 120 44 Praha 2, Czech Republic
Email for corresponding author: jkopacek@hbu.cas.cz
Abstract
Major fluxes of sulphur and dissolved inorganic nitrogen were estimated in Central European mountain ecosystems of the Bohemian Forest (forest lakes) and Tatra Mountains (alpine lakes) over the industrial period. Sulphur outputs from these ecosystems were comparable to inputs during a period of relatively stable atmospheric deposition (10-35 mmol m-2 yr-1) around the 1930s. Atmospheric inputs of sulphur increased by three- to four-fold between the 1950s and 1980s to ~140 and ~60 mmol m-2 yr-1 in the Bohemian Forest and Tatra Mountains, respectively. Sulphur outputs were lower than inputs due to accumulation in soils, which was higher in forest soils than in the sparser alpine soils and represented 0.8-1.6 and 0.2-0.3 mol m-2, respectively, for the whole 1930-2000 period. In the 1990s, atmospheric inputs of sulphur decreased 80% and 50% in the Bohemian Forest and Tatra Mountains, respectively, and sulphur outputs exceeded inputs. Catchment soils became pronounced sources of sulphur with output fluxes averaging between 15 and 31 mmol m-2 yr-1. Higher sulphur accumulation in the forest soils has delayed (by several decades) recovery of forest lakes from acidification compared to alpine lakes. Estimated deposition of dissolved inorganic nitrogen was 53-75 mmol m-2 yr-1 in the Bohemian Forest and 35-45 mmol m-2 yr-1 in the Tatra Mountains in the 1880-1950 period, i.e. below the empirically derived threshold of ~70 mmol m-2 yr-1, above which nitrogen leaching often occurs. Dissolved inorganic nitrogen was efficiently retained in the ecosystems and nitrate export was negligible (0-7 mmol m-2 yr-1). By the 1980s, nitrogen deposition increased to ~160 and ~80 mmol m-2 yr-1 in the Bohemian Forest and Tatra Mountains, respectively, and nitrogen output increased to 120 and 60 mmol m-2 yr-1. Moreover, assimilation of nitrogen in soils declined from ~40 to 10-20 mmol m-2 yr-1 in the alpine soils and even more in the Bohemian Forest, where one of the catchments has even become a net source of nitrogen. In the 1990s, nitrogen deposition decreased by ~30% and DIN output decreased to <70 and 35 mmol m-2 yr-1 in the Bohemian Forest and Tatra Mountains, respectively. New steady-state conditions, with negligible nitrogen export, could be reached in future but at lower nitrogen depositions than in the 1930s.
Keywords: emission, deposition, acidification, nitrogen-saturation, recovery, sulphate, nitrate, ammonium, mountain lakes
Introduction
Many European and North American regions have recently shown a widespread reversal in surface water acidification due to declining deposition of acidifying compounds (e.g. Stoddard et al., 1999; Evans et al., 2001). The extent and timing of increased acid neutralising capacity (ANC) and pH depends, however, not only on the reduction in emission/ deposition rate of sulphur (S) and nitrogen (N) compounds but also on the way that soils and vegetation respond to their reductions (e.g. Wright and Hauhs, 1991; Alewell et
al., 2000). Among them, sulphate (SO4) desorption, organic S cycling in soils (Novák et al., 1996; Torssander and Mörth, 1998; Prechtel et al., 2001) and factors affecting N cycling in catchments (e.g. Dise and Wright, 1995; Aber et al., 1998) are important. Published trends in water chemistry provide
the “only” information on changes in composition relative to changing atmospheric deposition. Studies of element fluxes within the whole ecosystem help to understand the processes contributing to this change.
With the exception of “roof” experiments (e.g. Wright et
al., 1993; Hultberg et al., 1998; Gundersen et al., 1998a),
the greatest reduction in deposition of acidifying compounds has occurred in Central Europe. This large whole-ecosystem “experiment” has been based on ~80% and ~30% reduction in S and N emissions, respectively, in the area of Germany, Poland, the Czech Republic and Slovakia during the 1990s (Kopácek et al., 2001). Parallel decreases in deposition rates of SO4, nitrate (NO3), and ammonium (NH4) have resulted in relatively rapid improvement in water quality in acidified
mountain lakes in this area (e.g. Kopácek et al., 1998; Veselý
et al., 1998).
In this paper major fluxes of S and N compounds in two Central European mountain areas (Bohemian Forest and Tatra Mountains) are estimated for the whole industrial period. First, historical (1850-2000) emission rates of S and N in the area of the Czech Republic and Slovakia are reconstructed. Second, historical trends in S and N deposition in the mountains are estimated using relationships between emission rate and measured deposition. Third, S and N outputs from catchment-lake ecosystems are estimated using historical and recent water chemistry records. Finally, the input-output fluxes are used to estimate possible changes in soil storage of S and N over the 1930-2000 period.
Methods
SITE DESCRIPTION, WATER AND SOIL CHEMISTRY
The areas of the Bohemian Forest (BF) and Tatra Mountains (TM) are situated at 13o-14o E, 49o N and 20o 10' E, 49o 10'
N, respectively. Two lakes (Cerné, CN, and Certovo, CT) were studied in BF (Table 1). These lakes are situated in steep, forested catchments, planted predominantly with Norway spruce and sparse beech. Soils are mostly acidic podzols in different stages of development and/or cambisols (average depth of ~0.6 m) with cation exchange capacity between 16 and 82 eq m-2 (average of 23 eq m-2), base
saturation of 10-13% and pH (water extracts; H2O) of mineral B horizons of 3.7-4.6 (Kopácek, unpubl. data).
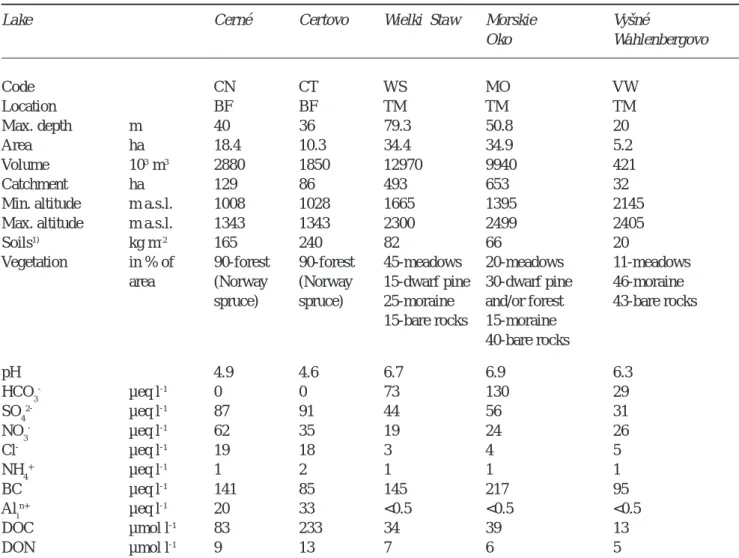
Table 1. Major morphological and chemical parameters of the Bohemian Forest (BF) and Tatra Mountains (TM)
catchment-lake ecosystems. Chemical composition of catchment-lake water refers to September-October 2000 (Kopácek and Stuchlík, unpubl. data). BC, base cations (sum of Ca, Mg, Na and K); DOC and DON, dissolved organic carbon and nitrogen, respectively.
Lake Cerné Certovo Wielki Staw Morskie Vyšné
Oko Wahlenbergovo Code CN CT WS MO VW Location BF BF TM TM TM Max. depth m 40 36 79.3 50.8 20 Area ha 18.4 10.3 34.4 34.9 5.2 Volume 103 m3 2880 1850 12970 9940 421 Catchment ha 129 86 493 653 32
Min. altitude m a.s.l. 1008 1028 1665 1395 2145
Max. altitude m a.s.l. 1343 1343 2300 2499 2405
Soils1) kg m-2 165 240 82 66 20
Vegetation in % of 90-forest 90-forest 45-meadows 20-meadows 11-meadows
area (Norway (Norway 15-dwarf pine 30-dwarf pine 46-moraine
spruce) spruce) 25-moraine and/or forest 43-bare rocks 15-bare rocks 15-moraine
40-bare rocks pH 4.9 4.6 6.7 6.9 6.3 HCO3- µeq l-1 0 0 73 130 29 SO42- µeq l-1 87 91 44 56 31 NO3- µeq l-1 62 35 19 24 26 Cl- µeq l-1 19 18 3 4 5 NH4+ µeq l-1 1 2 1 1 1 BC µeq l-1 141 85 145 217 95 Alin+ µeq l-1 20 33 <0.5 <0.5 <0.5 DOC µmol l-1 83 233 34 39 13 DON µmol l-1 9 13 7 6 5
1)Average bulk density of soil (<2 mm, 105 oC dried), calculated as area weighted mean including moraine and bare rocks
Bedrock is formed primarily of mica-schists (muscovitic gneiss), with small quartzite intrusions (Veselý, 1994).
Despite their relatively rapid reversal from acidification and N saturation (Kopácek et al., 1998; Veselý et al., 1998), both lakes are still acidic, with elevated concentrations of aluminium (Al) (Table 1). Trends in concentrations of SO4, NO3, and NH4 in CN and CT come from Jírovec and Jírovcová (1937), Veselý et al. (1998), Procházková and Blažka (1999), and Stuchlík and Kopácek (unpubl. data). The historical data used before 1984 has been found to be reasonably reliable (Veselý and Majer, 1992; Procházková and Blažka, 1999). Background (pre-acidification) con-centrations of SO4 in CN and CT have been estimated to be ~16 and ~20 µmol l-1, respectively, by Veselý and Majer (1992).
Three lakes (Wielki Staw, WS; Morskie Oko, MO, and Vyšné Wahlenbergovo, VW) were studied in TM. WS and VW are situated in the alpine zone, while MO is below the local tree line with >80% of catchment in the alpine zone. Dry alpine meadows and sparse dwarf pine represent the dominant vegetation in these catchments (Table 1). Bedrock is mostly composed of granodiorite. Soils above the tree line are undeveloped alpine soils (lithosol, ranker) with average depth of ~0.5 m, mean cation exchange capacity of 12 eq m-2, base saturation of 11%, and pH (H
2O) of mineral
horizons of 4.7 (Kopácek, unpubl. data). The carbonate buffering system of WS and MO was not depleted during acidification and has been recently recovered in VW (Kopácek et al., 1998). Trends in concentrations of SO4 and NO3 in WS, MO, and VW come from Stangenberg (1938), Bombówna, (1965), Henriksen et al. (1992), Bombówna and Wojtan (1996), and Kopácek and Stuchlík (1994 and unpubl. data).
Concentrations of dissolved organic nitrogen (DON) in BF and TM precipitation and total DON in lakes were determined over the 1997-2000 and 1986-2000 period, respectively, by Kjeldahl combustion according to Procházková (1960). Concentrations of organic carbon (C) and total N in soil samples were analysed by CN analyser (NC 2100, ThermoQuest, Italy). Total S was determined after mineralisation and precipitation as BaSO4, and water extractable SO4-S was determined according to Alewell (1998). Average areal amount of these elements (mol m-2)
was calculated from their average contents in soil (mol kg-1)
and bulk density of soil (kg m-2). In TM catchments with
large areas of bare rock and moraine, the average areal amounts of elements were calculated as area weighted means. These hypothetical values represent a situation where soils were uniformly distributed over the whole catchment (Table 1). Average bulk densities of soil used in this calculation were 122 and 33 kg m-2 for alpine meadows and
moraine, respectively (Kopácek, unpubl. data).
EMISSION AND DEPOSITION RATES OF SULPHUR AND NITROGEN
The historical Czech and Slovak (CS) and Central European (Germany, Poland, Czech Republic, and Slovakia) emission trends for sulphur dioxide (SO2), nitrogen oxides (NOx), and ammonia (NH3) were obtained similarly to Kopácek et
al. (1998) but for a longer period. Details are given in
Appendix 1.
Long-term trends in throughfall and bulk deposition of SO4, NH4 and NO3 in the BF and TM were estimated using their relationships with long-term trends in deposition of S and N compounds in the Czech Republic and northern Slovakia (Chopok). These estimations were based on ratios between the measured depositions in BF and wet-only deposition in the Czech Republic, and on ratios between the measured bulk depositions in TM and bulk depositions in northern Slovakia (Appendix 2). Long-term trends in deposition of SO4, NH4, and NO3 were estimated from relationships between measured deposition and the respective CS emissions of SO2, NH3 and NOx. Details on data sources, calculation, significance of relationships and uncertainty are given in Appendix 2.
SULPHUR AND NITROGEN FLUXES
Mass balance of S and N in catchment-lake ecosystems was estimated using Eqn. (1):
LAKE LAKE SOIL INPUT OUTPUT
M
R
R
M
M
=
−
−
−
∆
(1)where MINPUT and MOUTPUT are S or N input and output to/ from the catchment-lake ecosystem, respectively. RSOIL and
RLAKE are net mass retention (or production when negative) of S or N in the soil and lake, respectively. ∆MLAKE is the change in storage of S or N in the lake and was obtained as the difference between its amount at the end and beginning of the mass budget period.
Atmospheric deposition was assumed to represent the dominant part of MINPUT for both S and N. In this simplified approach S input from weathering was neglected. Similarly, assimilation of atmospheric N by terrestrial vegetation and N losses due to denitrification were assumed to be negligible in comparison to other N fluxes (Williams et al., 1995; Gundersen et al., 1998a) and to be roughly equal (Curtis et
al., 1998). Sulphur input was calculated from estimated
trends in throughfall and bulk deposition to the respective areas of forest and bare surface (including lake) in BF, and from estimated trend in bulk deposition of S in TM. Dry deposition of S in TM was only ~10% of total S deposition in 1996 (Lydersen et al., 1997) and was neglected. Input of N was the sum of estimated deposition of dissolved inorganic
nitrogen (DIN = NO3-N + NH4-N; in throughfall and/or bulk) and bulk deposition of DON. The average bulk deposition of DON in the 1997-2000 period (13 and 7 mmol m-2 yr-1 in BF and TM, respectively) was used for a rough
estimation of DON deposition over the 1930-2000 period assuming no important trend (Kopácek et al., 1997).
MOUTPUT of S and DIN from catchment-lake ecosystems
were calculated from the measured concentrations of SO4, NO3 and NH4 in the lakes and the average annual water output. Mass balance over the 1930-2000 period was estimated assuming a linear trend between the measured data. The average lake water concentrations of total DON for the last decade were used to estimate cumulative DON flux from lakes over the whole 1930-2000 period, assuming negligible historical changes in DON concentrations in these phosphorus-limited water bodies (Kopácek et al., 1995).
The average annual water output from BF catchment-lake ecosystems was assumed to be 1.2 m3 m-2 yr-1 and constant
for the 1930-2000 period. This value was based on the average throughfall deposition to the lakes (1387 mm over the 1991-2000 period), 15% evaporation of throughfall (Kopácek et al., 2000a), and long-term (1961-2000) precipitation in BF. For TM lakes, the specific outflow was 1.42 and 1.57 m3 m-2 yr-1 for the south (VW) and north (WS
and MO) part of the mountains (Lajczak, 1996). Uncertainty associated with S or N output from ecosystems in individual years was roughly estimated as a coefficient of variation of the average level of precipitation (<±15% for BF).
In-lake retention of SO4 and NO3 was calculated according to Kelly et al. (1987), when the original relationship between in-lake reduction in SO4 or NO3 concentrations and their loading was rearranged into the form:
1
)
1
(
+
−=
M LAKEAS
Q
LA
R
(2)where L is areal SO4 or NO3 loading (terrestrial output and deposition to lake; mol m-2 yr-1), A is lake area (m2), Q
discharge (m3 yr-1), and S
M is mass transfer coefficient. SM
was set here to the values 0.4 and 7.4 m yr-1for SO
4 and
NO3, respectively (Kelly et al., 1987). A lower SM (5 m yr-1)
was used for NO3 in colder alpine lakes in TM (Curtis et
al., 1998). Finally, RSOIL was calculated by difference from Eqn. (1).
Major fluxes of S and N calculated from Eqns. (1) and (2) were compared to measured fluxes within CT catchment-lake ecosystem. This mass budget was based on regular sampling of throughfall, precipitation, all surface tributaries and outflow (calibrated weir) in two-week to four-week intervals during the 1998-2000 period (Kopácek et al., 2000a).
Results and discussion
SULPHUR
Trends in emission and deposition rates of sulphur
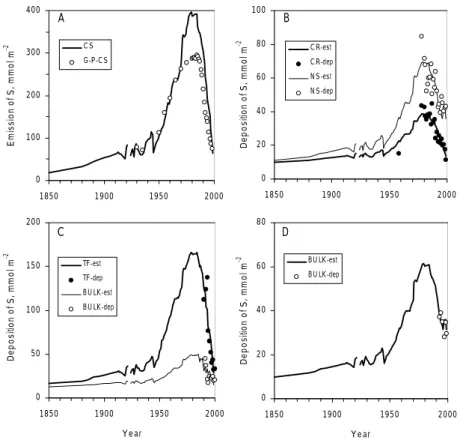
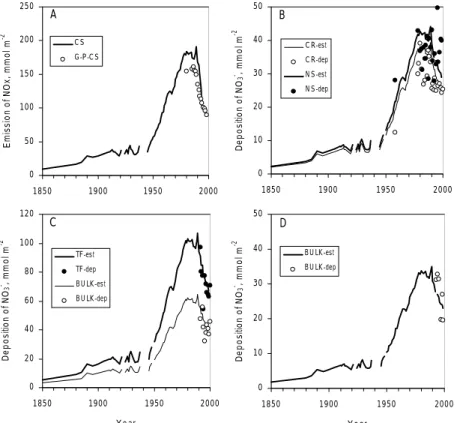
Emission rate of SO2 increased nearly linearly between 1850 and 1950 (from ~18 to ~100 mmol m-2 yr-1, respectively) in
the area of the Czech Republic and Slovakia (Fig. 1A). Heavy industrial production in this area after World War II resulted in a sharp increase in energy consumption, primarily based on lignite combustion, and consequently in an extremely high annual increase in SO2 emissions (~10 mmol m-2 yr-1). Emissions of SO
2 increased four-fold
between 1950 and the middle 1980s, levelled off at 390 mmol m-2 yr-1 in the first half of the 1980s, and then
decreased sharply (~21 mmol m-2 yr-1) in the 1985-1999
period (Fig.1 A). In 1999, CS emissions of SO2 were similar to those in the 1930s. Large reduction in lignite combustion and sulphur emission controls were the primary reasons for these recent changes (Kopácek et al., 1997, 1998).
The long term trend in CS emissions of SO2 is similar to the Central European trend, except for the 1970s and 1980s (Fig. 1A), when CS emissions of SO2 increased more sharply, due to extremely high emission rates in the German-Polish-Czech border area with numerous electric power plants, to a maximum SO2 emissions of ~800 mmol m-2 yr-1.
Consequently, the decrease in SO2 emissions was more pronounced in CS (~85%) than the Central European trend (~70%).
Deposition rates of S in the Czech Republic and northern Slovakia, which were estimated from the trend in CS emissions of SO2, are given in Fig. 1B. The estimated deposition agrees well (P < 0.001) with measured deposition. Trends in estimated S deposition in BF and TM are given in Figs. 1C and 1D, respectively. Deposition was relatively stable in both areas in the first half of the 20th century, rapidly
increased between 1950 and 1980, and reached a maximum in the early 1980s. Estimated deposition maxima were ~165 and ~50 mmol m-2 yr-1 in BF (throughfall and bulk
deposition, respectively) and ~60 mmol m-2 yr-1 in TM.
Recent S deposition has been ~80% lower than in the 1980s in BF, being similar to the 1930s, and ~50% lower in TM, approaching levels from the late 1950s (Figs. 1C and D).
Fluxes and mass budget of sulphur
Comparison between S fluxes estimated from Eqns. (1) and (2) and measured by mass budget studies (Kopácek et al., 2000a; and unpubl. data) are given for CT catchment-lake ecosystem in Table 2. There are only small differences between the results primarily due to different precipitation
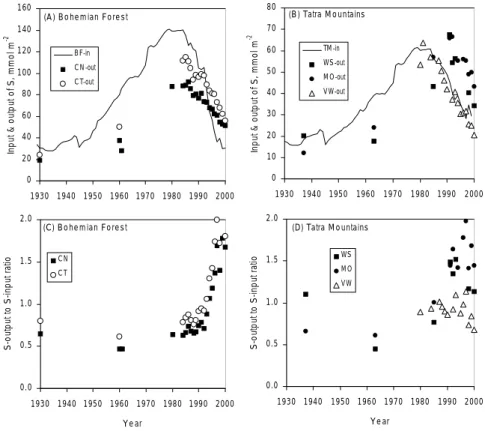
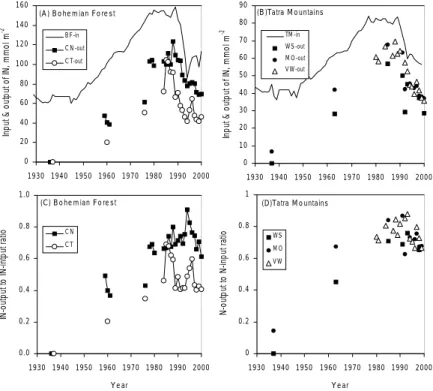
and output fluxes of S in BF and TM catchment-lake ecosystems, while the lower part shows historical changes in ratios of S-output to S-input (Sout : Sin). Sulphur input exceeded S output only slightly in the 1930s in both mountain areas and Sout:Sin ratios were between 0.5 and 1 (Figs. 2C and D). This suggests low accumulation of S in soils and more or less steady state conditions. Under increasing S atmospheric input, however, the soil in both areas started to accumulate more S. Even in the early 1980s, Sout:Sin ratios were < 1 despite the highest deposition rate of S. There were only small changes in the rate of S retention in forest soils between the 1960s and 1980s and they still continued to accumulate S (Fig. 2C). In contrast, alpine ecosystems of TM with thinner soil cover showed more pronounced signs of S-saturation (higher Sout : Sin ratios), and after the decline in S deposition rate, Sout : Sin ratios increased to > 1 indicating that alpine ecosystems have become a source of S (Fig. 2D).
While both BF lakes, with comparable terrestrial characteristics and relatively abundant soils, have responded nearly uniformly and Sout : Sin ratios remained high in the 1990s (Fig. 2C), responses of alpine TM lakes differed
Fig. 1. Trends in emission and deposition rate of S: (A) Emissions of SO2 in the area of the Czech Republic and Slovakia (CS) and in Central Europe (Germany, Poland, Czech Republic and Slovakia, G-P-CS; Mylona, 1993; Berge, 1997). (B) Comparison between estimated and measured wet-only and
bulk deposition of SO4-S in the Czech Republic (CR) and northern Slovakia (NS), respectively. (C)
Comparison between estimated and measured throughfall (TF) and bulk (BULK) deposition of SO4-S in
the Bohemian Forest. (D) Comparison between estimated and measured bulk (BULK) depositions of
SO4-S in the Tatra Mountains. All data are based on annual means.
Table 2. Comparison between S fluxes in the Certovo
catchment-lake ecosystem (CT), estimated from Eqns. (1) and (2) and measured (Kopácek et al. 2000a; and unpubl. data). Data are averages for 1998-2000 period; units are kmol yr-1. estimated measured MINPUT 29.1 31.4 MOUTPUT 56.3 61.8 ∆MLAKE N* -3.5 RLAKE 1.9 4.3 RSOIL 29.1 31.3 *N, neglected
levels (long-term average vs. real data) and the neglected change in S storage in the lake (dilution) in the more simple approach. Estimated data based on only sparse observations thus provide a reasonable estimation of the real S fluxes.
The upper part of Fig. 2 shows trends in estimated input
0 20 40 60 80 100 1850 1900 1950 2000 D epos iti on of S , m m ol m -2 C R-est C R-dep N S -est N S -dep B 0 100 200 300 400 1850 1900 1950 2000 E m is si on of S , mm ol m -2 C S G -P -C S A 0 50 100 150 200 1850 1900 1950 2000 Y e ar D epos iti on of S , m m ol m -2 TF-est TF-dep B U LK -est B U LK -dep C 0 20 40 60 80 1850 1900 1950 2000 Y e ar D epos iti on of S , m m ol m -2 B U LK -est B U LK -dep D
according to the amount of soil (Figs. 2B and 2D). The smallest amount of soil is in the VW catchment where the low S retention capacity has resulted in relatively small changes in Sout : Sin ratio (around 1) throughout the 1980-2000 period. Catchments of WS and MO lakes are covered with alpine meadows and have higher S retention capacity. Consequently, Sout: Sin ratios increased to >1, reached their maxima in 1997 and have been decreasing since. This suggests that new steady state conditions in the soil S pool of alpine ecosystems can be reached relatively rapidly after reduction of S deposition, while this process may last substantially longer in forest ecosystems with deeper soils (e.g. Torssander and Mörth, 1998; Prechtel et al., 2001).
Cumulative atmospheric input of S over the whole period of the Industrial Revolution (1850–2000) was estimated to be 7.2 mol m-2 in BF and 3.5 mol m-2 in TM. Most of this S
(70-80%) was deposited in the 1930–2000 period (Table 3). Differences in S loading between the mountain areas were due mainly to differences in vegetation cover (trees
vs. meadows). The forested area of BF had a higher specific
surface area and, consequently, higher dry and occult deposition of S (throughfall and bulk deposition in Fig. 1C). Cumulative S output from the forest sites was 67–82% of S deposition over the 1930–2000 period compared with S
accumulation in soils of 15-29% (Table 3). Lower cumulative output and higher accumulation of S in soils was observed in CN catchment and resulted in higher total S in the soil (Table 3). The difference between S concentration in BF soils in the year 2000 and S accumulation over the 1930–2000 period was used to assess soil S content in the 1930s, i.e. during equilibrium between S input and output. These estimated steady-state pools of S in BF soils were similar in both CT and CN catchments (1.6–1.8 mol m-2).
The Bohemian Forest soils became a net source of SO4-S around 1993–1994 (Fig. 2), similar to the most damaged Central European region (the Ore Mountains; Novák et al., 2000) but were one order of magnitude lower. The average annual SO4-S leaching from CN and CT soils was 19 and 31 mmol m-2 yr-1, respectively, over the 1994–2000 period.
Based on the amount of water extractable SO4-S in BF soils in 2000 (Table 3), it is estimated that a similar level of leaching would only continue for the next five years. The soil SO4-S pool, however, is also supplied by mineralisation of organic S (Novák et al., 1996; Torssander and Mörth, 1998), as well as from sources of inorganic S (e.g. Al-SO4 complexes; Nordstrom, 1982). Therefore, if all of the S accumulated in BF soils over the 1930–2000 period was
Fig. 2. Trends in S fluxes. Upper part: Comparison of S-input by atmospheric deposition in the
Bohemian Forest (A) and Tatra Mountains (B) to the S-output from catchment-lake ecosystems in the 1930-2000 period. Data on S output from CN and CT in 1930 are based on estimated background
concentrations of SO4 in the lakes (Veselý and Majer, 1992). Lower part (C,D): Ratio of S-output to
S-input. For lake codes see Table 1. All data are based on annual means.
0 20 40 60 80 100 120 140 160 1930 1940 1950 1960 1970 1980 1990 2000 In pu t & o utp ut o f S , m m ol m -2 B F-in C N -out C T-out (A ) B o he m ian Fo re s t 0.0 0.5 1.0 1.5 2.0 1930 1940 1950 1960 1970 1980 1990 2000 Y e ar S -o utp ut to S -in pu t r at io C N C T (C) B o he m ian Fo re s t 0 10 20 30 40 50 60 70 80 1930 1940 1950 1960 1970 1980 1990 2000 In pu t & o utp ut o f S , m m ol m -2 TM -in WS -out M O -out V W-out (B ) Tatra M o untains 0.0 0.5 1.0 1.5 2.0 1930 1940 1950 1960 1970 1980 1990 2000 Y e ar S -o utp ut to S -in pu t r at io WS M O V W (D) Tatra M o untains
available and could be transported at the present leaching rate, the process of S wash out would last about 26 years for CT and 84 years for CN. Part of the organically-bound S, however, may be volatised after its mineralisation by soil micro-organisms (Novák et al., 2000), which would reduce the time of S wash out. On the other hand, the S leaching rate may gradually decrease and S removal may last longer. The thinner soil cover in alpine catchments (TM soils) accumulated smaller amounts of S compared to the forest sites in BF. Sulphur accumulation in TM soils represented only ~10% of S deposited over the 1930-2000 period, while ~90% of this load was leached (Table 3). TM soils had already become a net source of SO4-S in the late 1980s with an average annual SO4-S leaching of 15 and 21 mmol m-2yr-1
(at WS and MO, respectively). The pool of water extractable SO4-S in TM soils was one order of magnitude lower than in BF soils (Table 3) and equalled approximately the average annual leaching of SO4-S from TM soils. Assuming S leaching from the total pool of S, which accumulated in the soil over the 1930–2000 period, the time for S wash out is estimated as 10 years for MO and 20 years for WS at the present S deposition rate. The process of total wash out of anthropogenic S, however, will probably last substantially longer in TM because SO4-S leaching decreased over the last decade, being 15–27 mmol m-2 yr-1 in 1991–1992 and
5–14 mmol m-2 yr-1 in 2000 (Fig. 2D).
NITROGEN
Trends in emission and deposition rates of oxidised nitrogen forms
The emission rate of NOx increased relatively slowly between 1850 and 1950 (from 10 to 55 mmol m-2 yr-1) and
then by ~4 mmol m-2 yr-1 up to around 190 mmol m-2 yr-1 in
the 1980s (Fig. 3A). Since 1989, NOx emissions have decreased primarily due to optimisation of combustion regimes at the main stationary sources. The decrease in NOx emissions was rapid (~17 mmol m-2 yr-1) up to 1994, then
less pronounced and by 1999 emissions were 88 mmol m-2 yr-1. Available data on Central European emissions
of NOx were similar to the CS emission trend (Fig. 3A). Estimated long-term trends in wet-only and bulk deposition of NO3 in the Czech Republic and northern Slovakia (Fig. 3B) agree well with the measured data (wet-only, P<0.001; bulk, P<0.05) and provide a reasonable background for estimation of throughfall and bulk deposition of NO3 in BF and TM (Figs. 3C and 3D). According to this estimation, NO3 deposition rapidly increased in both mountain areas between 1950 and 1980 and reached their maxima of ~100 and ~35 mmol m-2 yr-1
(throughfall in BF and bulk in TM, respectively) in the late 1980s. During the 1990s, NO3 deposition has decreased by 30-35% and 1999 levels are comparable to the middle 1960s.
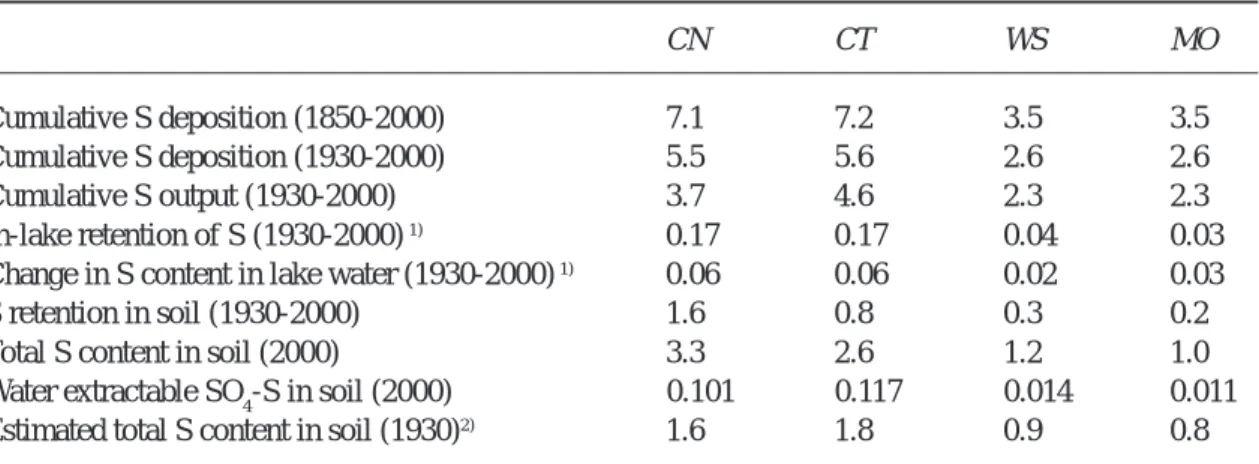
Table 3. Cumulative S budgets in the Bohemian Forest (CN and CT) and Tatra (WS and MO)
catchment-lake ecosystems. Numbers in brackets represent relevant year and/or period. For catchment-lake codes see Table 1. All units are mol m-2. ND, not determined.
CN CT WS MO
Cumulative S deposition (1850-2000) 7.1 7.2 3.5 3.5
Cumulative S deposition (1930-2000) 5.5 5.6 2.6 2.6
Cumulative S output (1930-2000) 3.7 4.6 2.3 2.3
In-lake retention of S (1930-2000) 1) 0.17 0.17 0.04 0.03
Change in S content in lake water (1930-2000) 1) 0.06 0.06 0.02 0.03
S retention in soil (1930-2000) 1.6 0.8 0.3 0.2
Total S content in soil (2000) 3.3 2.6 1.2 1.0
Water extractable SO4-S in soil (2000) 0.101 0.117 0.014 0.011
Estimated total S content in soil (1930)2) 1.6 1.8 0.9 0.8
1)In-lake SO
4 reduction and change in SO4 content in lake water (mol) were recalculated per total catchment
area (mol m-2).
2)Estimated total S content in soil in 1930 was the difference between the total S content in soil in 2000 and
Trends in emission and deposition rates of reduced nitrogen forms
The trend in emission rate of NH3 followed a different pattern to SO2 and NOx emissions (Fig. 4A) being mostly derived from agricultural production. CS emissions of NH3 were on average 25% lower than Central European emissions primarily due to the high emission rate of NH3 in Germany (Berge, 1997). Cattle and pig production contributed around 65% to 85% to the total anthropogenic CS emissions of NH3 over the whole 1850-2000 period. The emission rate of NH3 was already high (~40mmol m-2 yr-1) in 1850, increased only
slightly between 1850 and 1920 due to increasing number of inhabitants, and was relatively stable in the 1920-1950 period (~55 mmol m-2 yr-1). Between 1950 and 1980, NH
3
emissions increased by ~1 mmol m-2 yr-1 and levelled off at
88 mmol m-2 yr-1 in the 1980s (Fig. 4A). Then, NH
3 emissions
decreased primarily due to a 55% reduction in cattle production and fertilisation of farmland. As with NO3, this decrease was more rapid in the 1990–1994 period than in the second half of the 1990s. In 1999, CS emissions of NH3 were comparable to the situation one century ago (Fig. 4A).
Estimated long-term trends in wet-only and bulk deposition of NH4 in the Czech Republic and northern Slovakia agree well (P < 0.001) with the measured data (Fig. 4B) and provide a reasonable background for estimation of throughfall and bulk deposition of NH4 in BF and TM. According to this estimation (Figs. 4C and 4D), NH4 deposition was relatively stable in both mountain areas between 1850 and 1950, being 34–45 mmol m-2 yr-1 in BF
throughfall and 26-36 mmol m-2 yr-1 in TM bulk deposition.
Then, NH4 deposition increased by ~15 mmol m-2 in both
mountain areas between 1950 and 1980, stabilised in the 1980s and decreased 25–27% during the 1990s. Consequently, present NH4 deposition is comparable with levels in the 1900–1950 period in both areas (Figs. 4C and 4D).
Fluxes and mass budget of nitrogen
Trends in the atmospheric input of DIN and its output from catchment-lake ecosystems of BF and TM are shown in the upper part of Fig. 5. In both areas, DIN outputs were close to zero in the 1930s, increased in parallel with DIN
Fig. 3. Trends in emission and deposition rate of oxidised N forms: (A) Emissions of NOx in the area of
the Czech Republic and Slovakia (CS) and in Central Europe (Germany, Poland, Czech Republic and Slovakia, G-P-CS; Berge, 1997). (B) Comparison between estimated and measured wet-only and bulk
deposition of NO3-N in the Czech Republic (CR) and northern Slovakia (NS), respectively. (C)
Comparison between estimated and measured throughfall (TF) and bulk (BULK) deposition of NO3-N in
the Bohemian Forest. (D) Comparison between estimated and measured bulk deposition of NO3-N in the
Tatra Mountains. All data are based on annual basis.
0 50 100 150 200 250 1850 1900 1950 2000 E m is si on of N O x, m m ol m -2 C S G -P -C S A 0 10 20 30 40 50 1850 1900 1950 2000 D epos iti o n of N O3 - , m m o l m -2 C R-est C R-dep N S -est N S -dep B 0 20 40 60 80 100 120 1850 1900 1950 2000 Y e ar D epos iti o n of N O3 - , m m o l m -2 TF-est TF-dep B U LK -est B U LK -dep C 0 10 20 30 40 50 1850 1900 1950 2000 Y e ar D epos iti o n of N O3 - , m m o l m -2 B U LK -est B U LK -dep D
Fig. 4. Trends in emission and deposition rate of reduced N forms: (A) Emissions of NH3 in the area of the Czech Republic and Slovakia (CS) and in Central Europe (Germany, Poland, Czech Republic and Slovakia, G-P-CS; Berge, 1997). (B) Comparison between estimated and measured wet-only and
bulk deposition of NH4-N in the Czech Republic (CR) and northern Slovakia (NS), respectively. (C)
Comparison between estimated and measured throughfall (TF) and bulk (BULK) deposition of NH4-N
in the Bohemian Forest. (D) Comparison between estimated and measured bulk deposition of NH4-N
in the Tatra Mountains. All data are based on annual means.
Fig. 5. Trends in fluxes of dissolved inorganic nitrogen (DIN = NH4-N + NO3-N). Upper part:
Comparison of DIN input by atmospheric deposition in the Bohemian Forest (A) and Tatra Mountains (B) to the DIN output from catchment-lake ecosystems in the 1930-2000 period. Lower part (C, D): Ratio of
DIN output to DIN input. For lake codes see Table 1. All data are based on annual basis.
0 40 80 120 1850 1900 1950 2000 E m is si on of N H 3 , m m ol m -2 C S G -P -C S A 0 20 40 60 80 100 1850 1900 1950 2000 D epos iti on of N H 4 + , m m ol m -2 C R-est C R-dep N S -est N S -dep B 0 20 40 60 1850 1900 1950 2000 Y e ar D epos iti on of N H 4 + , m m ol m -2 TF-est TF-dep B U LK -est B U LK -dep C 0 20 40 60 1850 1900 1950 2000 Y e ar D epos iti on of N H 4 + , m m ol m -2 B U LK -est B U LK -dep D 0 20 40 60 80 100 120 140 160 1930 1940 1950 1960 1970 1980 1990 2000 In pu t & o utp ut o f IN , m m ol m -2 B F -in C N -out C T-out (A ) B o he m ian Fo re st 0.0 0.2 0.4 0.6 0.8 1.0 1930 1940 1950 1960 1970 1980 1990 2000 Y e ar IN -o ut pu t to IN -in tp ut r at io C N C T (C) B o he m ian Fo re st 0 10 20 30 40 50 60 70 80 90 1930 1940 1950 1960 1970 1980 1990 2000 In pu t & ou tp ut o f I N , m m ol m -2 TM -in W S -out M O -out V W -out (B )Tatra M o untains 0 0.2 0.4 0.6 0.8 1 1930 1940 1950 1960 1970 1980 1990 2000 Y e ar N -o utp ut to N -in pu t r at io W S M O V W (D)Tatra M o untains
deposition during the next four decades and reached a plateau in the 1980s. During the last decade, DIN outputs have decreased from all lakes. In contrast to S, ratios of N-output to N-input (Nout:Nin) paralleled the increase and decrease in deposition rate and did not exceed 1 in any lake after the deposition decline (lower part of Fig. 5). The estimated DIN fluxes reasonably reflect these trends, although the magnitude of the values is uncertain for two major reasons.
First, total deposition of DIN was probably higher than the estimated throughfall and bulk deposition given in Figs. 3-5. Throughfall DIN includes N derived from wet plus dry and cloud deposition less net N removal by canopy assimilation (e.g. Dise et al., 1998). The later process modifies significantly the composition of atmospheric deposition (Lovett, 1992). The average ratio between throughfall and bulk deposition of DIN was 1.3 in BF. Lovett (1992) has shown that total atmospheric deposition of DIN into forest sites generally exceeds bulk deposition by a factor of 1.2-1.9. Using the upper factor of 1.9 for BF (due to being in the vicinity of large NOx emissions sources), the estimated throughfall deposition of DIN into this area was 35–40% underestimated. Similarly, in TM, dry deposition was probably an important source of DIN. Lydersen et al. (1997) estimated dry deposition of oxidised and reduced N forms to be 7 and 12 mmol m-2 yr-1 in 1996 in TM, which
represented 25% of total DIN deposition.
Second, comparison between estimated fluxes and measured fluxes at CT provides evidence that DIN output from catchment-lake ecosystems was underestimated (Table 4). The 1998–2000 average output of DIN from CT was 35% higher than the estimated flux. This is due to the seasonality in NO3 concentrations in the lake outflow with minima during the vegetation growing season and maxima
in late winter. Historical NO3 concentrations on BF and TM lakes used in this study were mostly based on summer or early autumn observations and were lower than volume weighted mean concentrations. For example, in CT and CN lakes, volume weighted mean concentrations of NO3 were 12–44% higher than autumn concentrations in the 1998– 2000 period (e.g. in 2000, 56 v. 39 µmol l-1 in CT and 64 v.
57 µmol l-1 in CN). Consequently, the 30–40%
underestimation of DIN deposition was in part compensated by a similar underestimation of DIN output from the ecosystem which reduced the error in estimation of long-term retention of DIN in the soils.
In-lake retention of DIN was a significant component of N fluxes within the catchment-lake ecosystems. There was a good agreement between estimated and measured in-lake DIN retention for both CT (Table 4) and CN (42 and 53 kmol yr-1, respectively). Another approach to estimating
in-lake retention of DIN was used based on the accumulation rate of N in sediments. Veselý at al. (1993) estimated a mass accumulation rate of 53 g m-2 yr-1 in CT over the last century,
while the average N content of the uppermost (1-cm) layer was 2.4 mmol g-1 (Kopácek, unpubl. data) and the resulting
N retention in sediments was 13 kmol yr-1. This estimate is
in concordance with measured in-lake retention of DIN (Table 4), although somewhat lower because the measured in-lake N retention also includes N losses due to denitrification.
The cumulative atmospheric inputs of DIN in the 1930– 2000 period surprisingly represented “only” ~60% of cumulative DIN deposition from 1850 to 2000 (Table 5). The primary reason was high NH4 deposition throughout the whole period (Fig. 4). Between 30% to 60% of DIN inputs were leached from the catchments and 10–20% were removed by in-lake processes. Cumulative outputs of DON were higher than inputs and represented an important proportion (26–38%) of total N export from ecosystems (Table 5). The net N retention in BF soils based on Eqn. (1) was 20% and 40% of the N input (DIN plus DON) in CN and CT catchments, respectively, while the N budget for TM lakes indicates a similar relative retention (35% and 20%) of N in alpine soils but at lower absolute values (Table 5).
The N concentrations of BF and TM soils in 2000 was more than an order of magnitude higher than N retention in soils over the 1930–2000 period (Table 5). Ratios of C:N averaged 22 and 24 in forest catchments and 18 in alpine catchments. At soil C:N ratios of 25 or less, there is a potential risk of elevated export of DIN from soils (Gundersen et al., 1998b). Hypothetical soil C : N ratios in the 1930s, estimated from the present soil composition, were slightly higher but already ≤ 25 (Table 5). A relatively low
Table 4. Comparison between DIN fluxes in the Certovo
catchment-lake ecosystem (CT), estimated from Eqns. (1 and 2) and measured (Kopácek et al. 2000a; and unpubl. data). Data are averages for 1998-2000 period; units are kmol yr-1 estimated measured MINPUT 93.3 97.8 MOUTPUT 40.3 62.7 ∆MLAKE N* -0.3 RLAKE 18.6 22.8 RSOIL 34.4 12.7 *N, neglected
hypothetical decrease in C : N ratios of BF and TM soils fits well with conclusions made by Dise et al. (1998), which suggested that changes in soil C : N ratios may be a long-term process. The low soil C:N ratios (already in the 1930s) indicate a limited capacity of both mountain areas to assimilate elevated atmospheric deposition of DIN, even at the beginning of the mass budget period.
Response of forest and alpine ecosystems to DIN deposition
Estimated throughfall deposition of DIN was stable in BF during the 1880-1950 period (between 53 and 75 mmol m-2yr-1) (Figs. 3 and 4). The average value of 67 mmol
m-2yr-1 (9.5 kg ha-1 yr-1) was close to the empirically derived
threshold of 10 kg ha-1 yr-1 for European forest soils below
which DIN leaching from soils was not expected to occur (e.g. Dise et al., 1998; Curtis et al., 1998). This outcome is supported by historical data from BF lakes where concentrations of NO3 were < 2 µmol l-1 in 1936 (Veselý
and Majer, 1992), suggesting that nearly all DIN from throughfall deposition was removed by terrestrial and in-lake processes. Estimated DIN retention in soils, calculated on an annual basis from Eqn. (1), show that CN and CT catchments could assimilate high DIN deposition (50 and 60 mmol m-2 yr-1, respectively) during the 1930-1970 period.
However, DIN retention in BF soils has declined in the last
two decades, varying between 0-60 mmol m-2 yr-1 in CT,
and being close to zero or even negative (since the late 1980s) in CN catchment. Thus, soils in CN catchment have probably become a net source of DIN (practically all as NO3) since the second half of the 1980s. The Nout: Nin ratios for the whole CN catchment-lake ecosystem has remained < 1 (Fig. 5) mainly because of the elevated in-lake retention of N which increases as a function of N loading (Kelly et al., 1987).
Estimated bulk deposition of DIN varied between 35 and 45 mmol m-2 yr-1 (average of 41 mmol m-2 yr-1, i.e. ~6 kg
ha-1 yr-1) in TM during the 1880-1950 period (Figs. 3 and
4). In 1937, Stangenberg (1938) found NO3 concentrations between 0-4 µmol l-1 in 16 TM lakes. This low DIN leaching
suggested steady-state conditions within the catchment-lake ecosystem. As the in-lake retention of DIN was lower at that time, due to low DIN concentrations, most DIN input was probably retained in the soils. In the 1980–2000 period, estimated retention of DIN in alpine soils decreased to 10-20 mmol m-2 yr-1 in MO and WS catchments. In contrast,
the ability of VW catchment to assimilate DIN was negligible and estimated DIN retention varied between –9 and 7 mmol m-2 yr-1 in the 1980–2000 period. Such results
can be expected in VW catchment, where soil cover is sparse (Table 1). These sparse moraine soils with low C:N ratios (18) probably only adsorb and nitrify deposited NH4 but
Table 5. Cumulative budgets of N in the Bohemian Forest (CN and CT) and Tatra (WS and MO) catchment-lake ecosystems.
Numbers in brackets represent relevant year and/or period. For lake codes see Table 1. All units are mol m-2 except for C:N
ratios (mol mol-1).
CN CT WS MO
Cumulative DIN deposition (1850-2000) 11.5 11.6 6.9 6.9
Cumulative DIN input (1930-2000) 7.4 7.5 4.2 4.2
Cumulative ON input (1930-2000) 0.9 0.9 0.5 0.5
Cumulative DIN output (1930-2000) 3.5 2.4 2.0 2.7
Cumulative ON output (1930-2000) 1.3 1.5 0.7 0.7
In-lake retention of N (1930-2000)1) 1.7 1.1 0.4 0.4
Change in DIN content in lake water (1930-2000) 1) 0.13 0.08 0.05 0.04
N retention in soil (1930-2000) 1.7 3.3 1.6 0.9 N content in soil (2000) 64.9 53.2 24.0 19.9 C content in soil (2000) 1429 1263 437 362 C:N in soil (2000) 22 24 18 18 Hypothetical C:N in soil (1930) 2) 23 25 20 19 1)In-lake NO
3 reduction and change in DIN content in lake water (mol) were recalculated per total catchment area (mol m
-2).
2) Hypothetical C:N ratio in soil in 1930 was estimated using the C:N ratio in 2000, C and N concentrations in soil in 2000
are not able to accumulate N. This fact may explain negligible NH4 but high NO3 concentrations (roughly equal to DIN concentration in precipitation), which were found in VW and some other TM lakes with rocky catchments (Kopácek et al., 2000b).
The present DIN export from both BF and TM ecosystems fits well with the empirical models which link DIN leaching to current N deposition, soil pH or C : N ratios (Dise et al., 1998; Gundersen et al., 1998b), as well as to the ratios of DOC to dissolved DON in water (Harriman et al., 1998). The decreasing trends in retention of DIN within both BF and TM soils suggest, however, that these dose-response functions may change over time. The historical change in composition of atmospheric deposition might partly contribute to the lower N retention within BF and TM ecosystems. Dise et al. (1998) have reported increasing N retention with increasing proportion of NH4 in deposition. The NH4 to NO3 ratio in BF and TM bulk deposition is estimated to have decreased four-fold between the 1930s and 1990s (Figs. 3 and 4). Furthermore, increasing N deposition may induce changes in vegetation communities leading to changes in N leaching. Differences in vegetation status may also explain some inter-site variation in N export from BF and TM lakes (Kopácek et al., 2001). None of these factors, however, can explain the different abilities of geographically adjacent catchments, CN and CT, to accumulate and export N (Table 5). Clearly, other mechanisms are affecting the ability of ecosystems to immobilise N, some of which may change during the period of elevated N deposition. An example of such changes has been observed in the mineralisation rate of soil organic
matter (Gundersen et al., 1998a). In the BF lake catchments, Anderson et al. (2000) observed the highest rates of nitrification in the CN catchment. However, the reason is not clear and the processes involved require further study. Despite these differences in the ability of catchments to retain N, DIN concentrations and transport from lakes generally decreased in parallel with decreasing deposition rate (Figs. 5 and 6). A similar pattern was observed in artificial manipulation experiments, when NO3 leaching responded promptly to changes in N input (Gundersen et
al., 1998a). Consequently, N-saturation of BF and TM
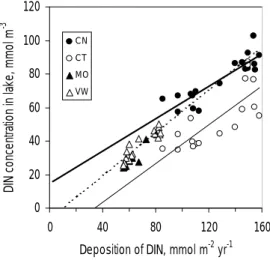
ecosystems seems to be reversible although the extent of change is difficult to predict. Linear regressions between DIN input and in-lake concentrations of DIN in the 1980-2000 period (Fig. 6) provide a rough estimate of critical levels of DIN deposition at which negligible concentrations of DIN were likely to leach. Critical DIN deposition of 32 and 25 mmol m-2 yr-1 (i.e. ~4 kg ha-1) were estimated for CT
and MO, respectively, which is < 50% of the steady-state DIN deposition in the 1930s. By comparison, the predominantly rocky catchment of VW with undeveloped moraine soils will only be able to assimilate a maximum 10 mmol m-2 yr-1 of DIN deposition. The worst situation, in
terms of ecosystem recovery from N-saturation, can be expected in CN which currently shows a net terrestrial loss of NO3. Even if DIN deposition falls to zero, DIN concentrations in CN would be ~15 µmol l-1, although this
may be an overestimate if steady-state is reached.
Conclusions
Negligible ecosystem outputs of S and DIN from BF and TM catchment-lake ecosystems in the 1930s suggested an equilibrium between deposition and retention. This equilibrium reflected relatively stable S and DIN emissions over previous decades. Then, the rapid increases of S and DIN deposition resulted in pronounced changes in the chemistry of both terrestrial and aquatic parts of these ecosystems. Sulphur accumulation in soils partly mitigated the increase in lake water SO4 during the 1930–1990 period, however, soil desorption has recently become an important source of SO4 for surface waters in both BF and TM after the respective 80% and 50% decline in S deposition. The new steady-state conditions in S dose and export will be reached sooner in the alpine than in forest ecosystems due to the lower amount of S accumulated in soils.
Lake water concentrations of NO3 generally followed the increasing, as well as decreasing, DIN deposition trends in both areas. Nitrogen saturation of these ecosystems seems to reflect DIN dose and is largely reversible despite the complexity of the N-biogeochemical cycle. The ability of
Fig. 6. Relationship between DIN deposition (throughfall for CN and CT and bulk for MO and VW lakes) and concentrations of DIN
in the Bohemian Forest and Tatra lakes in the 1980-2000 period. Equations of linear regressions: CN, y = 0.5x + 15; CT, y = 0.6x –
19; MO, y = 0.8x - 20; VW, y = 0.7x – 7; P<0.001 for allregressions. For lake codes see Table 1.
0 20 40 60 80 100 120 0 40 80 120 160
Deposition of DIN, mmol m-2 yr-1
DIN c on ce ntr at io n i n l ak e, m m ol m -3 CN CT MO VW
terrestrial ecosystems to assimilate DIN deposition, however, declined between 1930 and 2000 (CT, WS, and MO) and/or completely changed from N retention to N production (CN).
Using the status of BF and TM lakes in the 1930s as a measure of “unaffected” Central European mountainous ecosystems, the threshold levels of S and N emissions, which should be reached to enable recovery from acidification and N-saturation can be estimated. The present Central European emission rates of S have nearly declined to the required threshold level (< 60 mmol m-2 yr-1) and future soil and water
acidification due to SO4 leaching will result primarily from leaching of S accumulated in soils. To reach the DIN deposition of the 1930s, the recent Central European emissions of DIN should be reduced to < 80 mmol m-2 yr-1.
Even such a large reduction, however, will probably not be sufficient for the complete recovery of the ecosystems from N-saturation due to changes in their ability to retain N.
Acknowledgements
We thank M. Dvoøáková and M. Mitošinková from the Czech and Slovak Hydrometeorological Institutes, respectively, for data on atmospheric deposition in the Czech Republic and Slovakia, and Ron Harriman from Freshwater Fisheries Laboratory, Pitlochry, Scotland, for useful comments and language improvements. This study was partly supported by the Grant Agency of the Czech Republic (project No 206/00/0063), and the Commission of the European Community as part of the RECOVER:2010 (Project No. EVK1-CT-1999-00018) and EMERGE (EVK1-CT-1999-00032) projects.
References
Aber, J.D., McDowell, W., Nadelhoffer, K.J., Magill, A., Berntson, G., Marnakea, M., McNulty, S., Currie, W., Rustad, L. and Fernandez, I., 1998. Nitrogen saturation in temperate forest ecosystems: hypotheses revisited. BioScience, 48, 921–934. Alewell, C., 1998. Investigating sulphate sorption and desorption
of acid forest soils with special consideration of soil structure.
Z. Pflanzenernähr. Bodenk., 161, 73–80.
Alewell, C., Manderscheid, B., Meesenburg, H. and Bittersohl, J., 2000. Is acidification still an ecological threat? Nature, 407, 856–857.
Anderson, I.C., Tobias, C.R., Macko, S.A. and Poth, M.A., 2000. Sources and sinks of nitrogen in acidified glacial lakes of the Bohemian Forest, Czech Republic. Silva Gabreta, 4, 135–146. Asman, W.A.H., Drukker, B. and Janssen, A.J., 1988. Modelled historical concentrations and depositions of ammonia and ammonium in Europe. Atmos. Environ., 22, 725–735. Berge, E., 1997. Transboundary air pollution in Europe, Part 1.
EMEP MSC-W Report 1/97, Norwegian Meteorological Institute, Oslo, 108 pp.
Bombówna, M., 1965. Hydrochemical investigations of the Morskie Oko lake and the Czarny staw lake above the Morskie Oko in the Tatra Mountains. In: Limnological Investigations in
the Tatra Mountains and Dunajec River Basin, K. Starmach
(Ed.), 7-11. Zeszyt No 11, Komitet Zagospodarzovania Ziem Górskych, Polish Academy of Sciences, Kraków.
Bombówna, M. and Wojtan, K., 1996. Temporal changes in the water chemistry of the Tatra lakes. In: Przyroda Tatrzanskiego
Parku Narodovego a Czlowiek, Tom 3, Wplyw czlowieka, Z.
Krzan (Ed.), 56–59. TPN, Kraków-Zakopane, Poland (in Polish).
Buijsman, E., Maas, H.F.M. and Asman, W.A.H., 1987. Anthropogenic NH3 emissions in Europe. Atmos. Environ., 21, 1009–1022.
Curtis, C.J., Allott, T.E.H., Reynolds, B. and Harriman, R., 1998. The prediction of nitrate leaching with the first-order acidity balance (FAB) model for upland catchment in Great Britain.
Water Air Soil Pollut., 105, 205–215.
Dise, N.B. and Wright, R.F., 1995. Nitrogen leaching from European forests in relation to nitrogen deposition. Forest Ecol.
Manage., 71, 153–161.
Dise, N.B., Matzer, E. and Gundersen, P., 1998. Synthesis of nitrogen pools and fluxes from European forest ecosystems.
Water Air Soil Pollut., 105, 143–154.
Evans, C.D., Cullen, J.M., Alewell, C., Kopácek, J., Marchetto, A., Moldan, F., Prechtel, A., Rogora, M., Veselý, J. and Wright, R.F., 2001. Recovery from acidification in European surface waters. Hydrol. Earth Syst. Sci., 5, 283–297.
Galloway, J.N., Charlson, R.J., Andreae, M.O. and Rodbe, H., 1985. The Biogeochemical Cycling of Sulfur and Nitrogen in
the Remote Atmosphere. Reidel, Boston, USA, 249 pp.
Gundersen, P., Emmett, B.A., Kjonaas, O.J., Koopmans, C.J. and Tietema, A., 1998a. Impact of nitrogen deposition on nitrogen cycling in forests: a synthesis of NITREX data. Forest Ecol.
Manage., 71, 143–151.
Gundersen, P., Callesen, I. and de Vries, W., 1998b. Nitrate leaching in forest ecosystems is related to forest floor C/N ratios.
Environ. Pollut., 102, 403–407.
Harriman, R., Curtis, C. and Edwards, A.C., 1998. An empirical approach for assessing the relationship between nitrogen deposition and nitrate leaching from upland catchments in the United Kingdom using runoff chemistry. Water Air Soil Pollut.,
105, 193–203.
Henriksen, A., Mill, W.A., Kot, M., Rzychon , D. and Wathne, B., 1992. Critical loads of acidity to surface waters: A case
study from the Polish Tatra Mountains. Report 29/1992, NIVA,
Oslo, 34 pp.
Hruška, J., Kopácek, J., Hlavatý, T. and Hošek, J., 2000. Trend of atmospheric deposition of acidifying compounds at Certovo Lake, south-western Czech Republic (1992-1999). Silva
Gabreta, 4, 71–86.
Hultberg, H., Moldan, F., Anderson, B.I. and Skeffington, R., 1998. Recovery from acidification in the forested covered catchment experiment at Gardsjön: Effects on Biogeochemical output fluxes and concentrations. In: Experimental Reversal of Acid
Rain Effects. The Gardsjön Roof Project, H. Hultberg and R.
Skeffington (Eds.), 157–184. Wiley, Chichester, UK. Jírovec, O. and Jírovcová, M., 1937. Chemistry of the Bohemian
Forest lakes. Vìstník k. c. spol. nauk, Tr. II (13), 1–21 (in Czech). Kelly, C.A., Rudd, J.W.M., Hesslein, R.H, Schindler, D.W., Dillon, P.J., Driscoll, C.T., Gherini, S.A. and Hecky, R.E., 1987. Prediction of biological acid neutralisation in acid-sensitive lakes. Biogeochemistry, 3, 129–140.
Kopácek, J., and Stuchlík, E., 1994. Chemical characteristics of lakes in the High Tatra Mountains, Czechoslovakia.
Kopácek, J., Procházková, L., Stuchlík, E. and Blazka, P., 1995. The nitrogen-phosphorus relationship in mountain lakes: Influence of atmospheric input, watershed, and pH. Limnol.
Oceanogr., 40, 930–937.
Kopácek, J., Procházková, L., Hejzlar, J. and Blazka, P., 1997. Trends and seasonal patterns of bulk deposition of nutrients in the Czech Republic. Atmos. Environ., 31, 797–808.
Kopácek, J., Hejzlar, J., Stuchlík, E., Fott, J. and Veselý, J., 1998. Reversibility of acidification of mountain lakes after reduction in nitrogen and sulphur emissions in Central Europe. Limnol.
Oceanogr., 43, 357–361.
Kopácek, J., Hejzlar, J. and Porcal, P., 2000a. Mass balance of major ions in the Certovo watershed-lake ecosystem the 1998 hydrological year. Silva Gabreta, 4, 117–133.
Kopácek, J., Stuchlík, E., Straškrabová, V. and Pšenáková, P., 2000b. Factors governing nutrient status of mountain lakes in the Tatra Mountains. Freshwater Biol., 43, 369–383.
Kopácek, J., Stuchlík, E., Veselý, J., Schaumburg, J., Anderson, I.C., Fott, J., Hejzlar, J. and Vrba, J., 2001. Hysteresis in reversal of Central European mountain lakes from atmospheric acidification. Water Air Soil Pollut., (in press).
Lajczak, A., 1996. Hydrologia. In: Przyroda Tatrzañskiego Parku
Narodowego, Z. Mirek, Z. Glowaciñski, K. Klimek and H.
Piêkoœ-Mirkowa H. (Eds.), 169–196. Tatrzañski Park Narodowy, Zakopane–Kraków, (in Polish).
Lovett, G.M., 1992. Atmospheric deposition and canopy interactions of nitrogen. In: Atmospheric Deposition and Forest
Nutrient Cycling. Ecological Studies 91., D.W. Johnson and
S.E. Lindberg (Eds.), 152–166. Springer, New York.
Lydersen, E., Rzychon, D., Worsztynowicz, A., Torseth, K., Hanssen, J.E., Mill, W.A., Kot, M., Henriksen, A. and Wathne, B.M., 1997. Critical loads of acidity to lakes in the Polish Tatra
Mountains-Final report. Report 44/1997, NIVA, Oslo, 49 pp.
Mackù, M., Podzimek, J. and Šrámek, L., 1959. Results of chemical analyses of precipitation collected on territory of Czechoslovak Republic in IGY. Geofysikální Sborník, 124, 441– 519.
Mylona, S., 1993. Trends of sulphur dioxide emissions, air
concentrations and depositions of sulphur in Europe since 1880.
EMEP/MSC-W Report 2/93, Norwegian Meteorological Institute, Oslo, 35 pp.
Nordstrom, D.K., 1982. The effect of sulphate on aluminium concentrations in natural waters: some stability relations in the system Al2O3-SO3-H2O at 298 K. Geochim. Cosmochim. Acta,
46, 681–692.
Novák, M., Bottrell, S.H., Fottová, D., Buzek, F., Groscheová, H. and Zák, K., 1996. Sulphur isotope signals in forest soils of Central Europe along an air pollution gradient. Environ. Sci.
Technol., 30, 3473–3476.
Novák, M., Kirkner, J.W., Groscheová, H., Havel, M., Cerný, J., Krejcí, R. and Buzek, F., 2000. Sulphur isotope dynamics in two Central European watersheds affected by high atmospheric deposition of SOx. Geochim. Cosmochim. Acta, 64, 367–383. Pacyna, J.M., Larssen, S. and Semb, A., 1991. European survey for NOx emissions with emphasis on Eastern Europe. Atmos.
Environ., 25A, 425–439.
Prechtel, A., Alewell, C., Armbruster, M., Bittersohl, J., Cullen, J.M., Evans, C.D., Helliwell, R., Kopácek, J., Marchetto, A., Matzner, E., Meesenburg,H., Moldan, F., Moritz, K., Veselý, J. and Wright, R.F., 2001. Response of sulphur dynamics in European catchments to decreasing sulphate deposition. Hydrol.
Earth Syst. Sci., 5, 311–325.
Procházková, L., 1960. Einfluss der Nitrate und Nitrite auf die Bestimmung des organischen Stickstoffs und Ammonimus im Wasser. Archiv für Hydrobiologie, 56, 179–185.
Procházková, L. and Blazka, P., 1999. Chemistry and biology of the Bohemian Forest lakes in the early 1960s. Silva Gabreta, 3, 65–72 (in Czech).
Stangenberg, M., 1938. Zur Hydrochemie der Tatraseen.
Verhandlungen der internationalen Vereinigung für theoretische und angewandte Limnologie, 8, 211–220.
Stoddard, J.L., Jeffries, D.S., Lükewille, A., Clair, T.A., Dillon, P.J., Driscoll, C.T., Forsius, M., Johannessen, M., Kahl, J.S., Kellogg, J.H., Kemp, A., Mannio, J., Monteith, D.T., Murdoch, P.S., Patrick, S., Rebsdorf, A., Skjelkvale, B.L., Stainton, M.P., Traaen, T., van Dam, H., Webster, K.E., Wieting, J. and Wilander, A., 1999. Regional trends in aquatic recovery from acidification in North America and Europe. Nature, 401, 575– 578.
The MOLAR Chemistry Group, 1999. The MOLAR project: atmospheric deposition and lake water chemistry. J. Limnol.,
58, 88–106.
Torssander, P. and Mörth, C.-M., 1998. Sulphur dynamics in the Roof experiment at Lake Gardsjön deduced from sulphur and oxygen isotope ratios in sulphate. In: Experimental Reversal of
Acid Rain Effects. The Gardsjön Roof Project , H. Hultberg and
R. Skeffington (Eds.), 185–206. Wiley, Chichester, UK. Várhelyi, G., 1985. Continental and global sulphur budgets - I.
Anthropogenic SO2 emissions. Atmos. Environ., 19, 1029–1040. Veselý, J., 1994. Investigation of the nature of the Šumava lakes: a review. Casopis Národního Muzea, Praha, Øada
pøírodovìdná, 163, 103–120.
Veselý, J. and Majer, V., 1992. The major importance of nitrate increase for the acidification of two lakes in Bohemia. Doc. Ist.
Ital. Idrobiol., 32, 83–92.
Veselý, J., Almquist-Jacobson, H., Miller, L.M., Norton, S.A., Appleby, P., Dixit, A.S. and Smol, J.P., 1993. The history and impact of air pollution at Certovo Lake, southwestern Czech Republic. J. Paleolimnol., 8, 211–231.
Veselý, J., Hruška, J., Norton, S.A. and Johnson, C.E., 1998. Trends in water chemistry of acidified Bohemian lakes from 1984 to 1995: I. Major solutes. Water Air Soil Pollut., 108, 107– 127.
Williams, M.W., Bales, R.C., Brown, A.D. and Melack, J.M., 1995. Fluxes and transformations of nitrogen in a high-elevation catchment, Sierra Nevada. Biogeochemistry, 28, 1–31. Wright, R.F. and Hauhs, M., 1991. Reversibility of acidification:
soils and surface waters. Proc. Roy. Soc. Edinburgh, 97B, 169– 191.
Wright, R.F., Lotse, E. and Semb, A., 1993. RAIN project: results after 8 years of experimentally reduced acid deposition to a whole catchment. Can. J. Fisheries Aquat. Sci., 50, 258–268.
Appendix 1
Trends in emissions of sulphur and nitrogen compounds
The historical Czech and Slovak (CS) emission trends for SO2 and NOx were reconstructed using data from Yearbooks of the Czech and Slovak Statistical Offices for the 1980– 1999 period and calculated data (1850–1980 period). Anthropogenic emissions of SO2 were calculated according to Várhelyi (1985) on the basis of fuel consumption (burning of brown and hard coal, oil, and wood). Historical trends in the average S content of coal and S retention in ash were obtained from Mylona (1993). Production of SO2 from
smelting of sulphidic ores, which was an important source of S emission in the Czech Republic and Slovakia before 1900, was estimated by Holub (pers. comm.). When compared to the statistical yearbook data, the calculated data on anthropogenic SO2 emissions were on average 8% higher in the 1980-1990 period. Emissions of SO2 from natural sources were assumed to be 9 mmol m-2 yr-1 (non-sea salt S
deposition in remote continental areas; Galloway et al., 1985) throughout the 1850–2000 period.
Anthropogenic emissions of NOx were calculated according to Pacyna et al. (1991) on the basis of fuel consumption (lignite and hard coal, oil, gas, and wood) in stable and mobile sources. Emissions of NOx from natural sources (soil processes, burning of straw and stubble) in Europe were estimated as 3% of anthropogenic emission in the 1980s (Pacyna et al., 1991). Applying this approach, the natural NOx production in the Czech Republic and Slovakia was estimated as ~5 mmol m-2 yr-1 and was assumed
to be constant throughout the 1850–2000 period. The difference between the calculated total emission rate of NOx and statistical yearbook data varied from –6% to 6% in the 1980-1990 period.
The historical Czech and Slovak emission trends for NH3 were calculated for the whole 1850-2000 period according to Asman et al. (1988) from data on livestock production (cattle, pigs, sheep, goats, horses and poultry) and nitrogenous fertiliser production and consumption. Emissions of NH3 from natural sources (~9 mmol m-2 yr-1)
was roughly estimated according to Buijsman et al. (1987) as ~12% of anthropogenic emissions in Europe in the 1980s and was assumed to be constant throughout the 1850–2000 period. The difference between the calculated total emission rate of NH3 and statistical yearbooks data varied from –14% to 3% in the 1985–1999 period, with the average of –5%.
Data on Central European (Germany, Poland, Czech Republic, and Slovakia) emissions of SO2, NOx, and NH3 after 1980 came from Berge (1997) and Yearbooks of the National Statistical Offices. The historical trend for Central European emissions of SO2 before 1980 came from Mylona (1993).
Appendix 2
Estimated trends in deposition of sulphur and nitrogen compounds
Data on atmospheric deposition of SO4, NO3, and NH4 came from the following sources: (1) Wet-only deposition in the Czech Republic (CR), based on data from stations
Svratouch, Košetice, and Hradec Králové (Mackù et al., 1959, and the Czech Hydrometeorological Institute, 1978– 2000 period). (2) Bulk deposition in northern Slovakia (NS) from the Chopok station, situated at 2008 m a.s.l. ~40 km south-west of TM (Mackù et al., 1959, and the Slovak Hydrometeorological Institute, 1978-1999 period). (3) Atmospheric deposition in BF in the 1992-2000 period, based on one bulk and two throughfall sites differing in altitude (Hruška et al., 2000). (4) Bulk deposition in TM, measured at Starolesnianske Lake (southern part; 2000 m a.s.l.) in the 1997-1999 period (Stuchlík, unpubl. data) and at Hala Gasienicowa (northern part; 1520 m a.s.l.) in the 1993-1998 period (Lydersen et al., 1997, The MOLAR Chemistry Group, 1999).
Relationships used for estimation of SO4, NH4, and NO3 deposition in CR (wet-only) and NS (bulk) from the respective CS emissions of SO2, NH3 and NOx were as follows: (1) SO4 in CR: linear regression between measured SO4deposition in CR and CS emissions of SO2 (P<0.001). (2) NH4 in CR: linear regression between measured NH4 deposition in CR and CS emissions of NH3 (P<0.001). (3) NO3 in CR: ratio of 0.21±0.03 (average ± standard deviation) between measured deposition of NO3 in CR and CS emissions of NOx. (4) SO4 in NS: linear regression between measured SO4deposition at Chopok and CS emissions of SO2 (P<0.01). (5) NH4 in NS: linear regression between measured NH4deposition at Chopok and CS emissions of NH3 (P<0.01). (6) NO3 in NS: ratio of 0.23±0.08 between measured deposition of NO3 at Chopok and CS emissions of NOx.
Estimation of SO4, NH4 and NO3 deposition in the Bohemian Forest (BF) and Tatra Mountains (TM) were based on estimated trends in their deposition in CR and NS, respectively, using the following ratios: (1) Measured throughfall deposition in BF to measured wet-only deposition in CR: SO4, 4.5±0.8 and 1.6±0.4 for the period of CS emission higher and lower than 100 mmol m-2 yr-2,
respectively; NH4, 1.4±0.3; and NO3, 2.7±0.5. (2) Measured bulk deposition in BF to measured wet-only deposition in CR : SO4, 1.2 ± 0.3; NH4, 1.2 ± 0.3; and NO3, 1.6 ± 0.2. (3) Measured bulk deposition in TM to measured bulk deposition in NS (Chopok): SO4, 0.9 ± 0.3; NH4, 0.7 ± 0.1; and NO3, 0.8 ± 0.2. The ratios were calculated for all available paired data and arithmetic means were used in the above calculations. Uncertainty associated with the deposition estimates was estimated as coefficient of variation of the mean, i.e. < ±30%.