Volume 46 (2)
Summer/été 2020
Defining the Visual Complexity of Learning Management Systems Using Image Metrics
and Subjective Ratings
Définir la complexité visuelle des systèmes de gestion de l'apprentissage à l'aide de
mesures d'images et de notations subjectives
Brenda M. Stoesz, University of Manitoba Mehdi Niknam, University of Manitoba Jessica Sutton, University of Manitoba
Abstract
Research has demonstrated that students’ learning outcomes and motivation to learn are influenced by the visual design of learning technologies (e.g., learning management systems or LMS). One aspect of LMS design that has not been thoroughly investigated is visual complexity. In two experiments, postsecondary students rated the visual complexity of images of LMS after exposure durations of 50– 500 ms. Perceptions of complexity were positively correlated across timed conditions and working memory capacity was associated with complexity ratings. Low-level image metrics were also found to predict perceptions of the LMS complexity. Results demonstrate the importance of the visual design of learning technologies and suggest that additional research on the impact of LMS visual complexity on learning outcomes is warranted.
Keywords: eye tracking, learning management system, user interface design, visual complexity, visual perception
Résumé
La recherche a démontré que les résultats d'apprentissage et la motivation des étudiants à apprendre sont influencés par la conception visuelle des technologies d'apprentissage (par exemple, les systèmes de gestion de l'apprentissage ou SGA). Un aspect de la conception des LMS qui n'a pas été étudié de manière approfondie est la complexité visuelle. Dans deux expériences, des étudiants en enseignement supérieur ont évalué la complexité visuelle des images des SGA après des durées d'exposition de 50 à
500 ms. Les perceptions de la complexité ont été positivement corrélées à travers les conditions
temporelles et la capacité de la mémoire de travail a été associée aux évaluations de la complexité. Des mesures d'images de bas niveau ont également été trouvées comme étant indicateurs des perceptions de la complexité des SGA. Les résultats démontrent l'importance de la conception visuelle des technologies d'apprentissage et suggèrent que des recherches supplémentaires sur l'impact de la complexité visuelle des SGA sur les résultats d'apprentissage sont justifiées.
Mots clés : suivi oculaire, système de gestion de l'apprentissage, conception de l'interface utilisateur, complexité visuelle, perception visuelle
Introduction
Postsecondary institutions in Canada (and around the world) continue to invest in online learning technologies and online course development (Bates et al., 2017) and, in doing so, increase students’ access to education and reduce their education-related costs (Coates, James, & Baldwin, 2005). Test scores, student engagement, and perceptions of learning (Nguyen, 2015) provide evidence that
delivering courses online may be as effective as traditional face-to-face delivery of content and learning activities (Ladyshewsky, 2004; Means, Toyama, Murphy, & Baki, 2013; Tallent-Runnels et al., 2006). These effects, however, may be attenuated by a number of factors (Lim, Ayesh, Stacey, & Chee, 2013), including the poor visual design of learning management systems (LMS), which can disorient learners and overload their cognitive resources (Eveland Jr. & Dunwoody, 2001). An LMS is a web-based software application that is used to organize and administer content and track and report progress for learning and training purposes (Ellis, 2009; Mabila, Gelderblom, & Ssemugabi, 2014). Describing the appearance of LMS accurately and determining how visual design influences student learning is important for making evidence-informed design modifications. Describing the visual complexity of LMS in efficient, meaningful, and reliable ways is a foundational step in the broader investigation of the impact of LMS design on student learning outcomes. Therefore, we explored whether low-level image metrics predicted judgements of the visual complexity of LMS and whether these judgements were influenced by viewer characteristics. We also sought to confirm the stability of first impressions of the visual complexity.
Visual Complexity of Learning Technologies
Early webpage design consisted of arranging static blocks of text with few graphics on a page (Berners-Lee, n.d.), as visual design was largely constrained by the state of hardware and software technology at the time. The persistent belief that functionality and efficiency were paramount to advancing networking technologies may also have slowed the development of more sophisticated and attractive webpage designs (Moshagen & Thielsch, 2010). Researchers soon realized, however, that visually pleasing designs could enhance the perceived usability, credibility, user satisfaction, and
One aspect of visual aesthetics that strongly influences visual attention and behaviour is
complexity (Wang, Yang, Liu, Cao, & Ma, 2014). Low-level image metrics, such as feature congestion (Corchs, Ciocca, Bricolo, & Gasparini, 2016; Madan, Bayer, Gamer, Lonsdorf, & Sommer, 2018), the numbers of text and image areas (Reinecke et al., 2013), and the numbers of words, links, fonts, and graphics (Geissler, Zinkhan, & Watson, 2006; Ivory, Sinha, & Hearst, 2001; Michailidou, Harper, & Bechhofer, 2008) have been used to predict viewers’ perceptions of visual complexity of consumer-based webpages. Past research on website complexity has drawn on Berlyne’s (1960) theory of stimulus complexity. Berlyne suggested that a stimulus becomes increasingly complex when the number of distinct elements increases, and the number of elements seen as a unit decreases. The theory goes on to predict that there is an optimal level of complexity–that too little or too much complexity decreases communication effectiveness and influences consumer attitudes and intensions negatively (Berlyne, 1960; see also Geissler et al., 2006).
Research also shows that reliable judgements about various aspects of webpages, including complexity, can be made after extremely brief exposure durations (e.g., 50 ms; Lindgaard, Fernandes, Dudek, & Brown, 2006; Tractinsky, Cokhavi, Kirschenbaum, & Sharfi, 2006), which is particularly problematic when first impressions are poor as these impressions are robust even in the face of evidence to the contrary (Lindgaard et al., 2006). Moreover, the strength of the relationships between objective metrics and subjective ratings may be influenced by several individual difference factors, including working memory capacity (Madan et al., 2018; Walhout et al., 2015) and familiarity with the stimuli presented (Forsythe, Mulhern, & Sawey, 2008; Gartus & Leder, 2017; McDougall, Curry, & de Bruijn, 1999) or the specific tasks assigned (Nadkarni & Gupta, 2007). Indeed, viewers describe simple
webpages as placing few decision-making demands on them, whereas complex webpages require
switches in one’s focus of attention that tax cognitive resources (Harper, Michailidou, & Stevens, 2009). Further, consumer-focused websites with a high degree of complexity, but that lack structure and order, typically result in significant levels of frustration and wasted time (Lazar, Bessiere, Ceaparu, Robinson, & Shneiderman, 2003; Tuch, Bargas-Avila, Opwis, & Wilhelm, 2009). Greater complexity combined with a highly structured or ordered spatial arrangement increases viewer preferences for web interfaces (Deng & Poole, 2010).
Design criteria for learning technologies has largely been based on ease of use rather than the evaluation of aesthetics (Liu, 2003); however, evidence is accumulating to demonstrate that visually pleasing learning technologies enhance learning (Pomales-García, Liu, & Mendez, 2005) and motivation to learn (Zain, Tey, & Goh, 2011). For example, ratings of perceived attractiveness of an e-learning module have been found to be positively correlated with the number of content relevant words recalled (Pomales-García et al., 2005). A limitation of this work is that it was unclear whether the aesthetics of the content or the web interface that the modules were displayed in were being evaluated. Nevertheless, these results suggest that judgements about visual aesthetics should not be ignored and are important for understanding how technology can be further developed to support student learning.
The Present Study
previous research (viz., Lindgaard et al., 2006; Reinecke et al., 2013; Tractinsky et al., 2006), and to provide a foundation to explore the impact of visual design of LMS on student behaviour and learning outcomes in future research. Although efforts have been made to define the complexity of consumer-focused websites, it is unclear whether the findings of previous research apply to LMS user interfaces. Fundamental differences might be expected as the purpose and use of LMS and consumer-based websites are quite different. Thus, our goals for the present experiments were to define visual complexity of LMS by examining whether low-level image metrics predicted viewer’s subjective complexity ratings; determine whether individual difference factors (e.g., age, education level, LMS familiarity, working memory capacity) influence complexity judgements; and verify that subjective complexity ratings correlate across various exposure durations, suggesting that first impressions of LMS are stable.
Experiment 1 Method
Participants. University undergraduate students (N = 29; 17 women; Mage = 20.8 years, SD =
3.8, Range: 18–36) with normal or corrected-to-normal vision and hearing, and fluent speakers of English were recruited from the University of Manitoba, Winnipeg, Canada, to participate in the present study. Twenty-three participants were right-handed. The sample consisted of individuals from a broad range of geographic and educational backgrounds. Participants received a $20 gift card following informed consent. The study procedures were approved by the university’s Research Ethics Board.
Materials and procedures. The study was conducted in individual sessions in a
sound-attenuated, well-lit, windowless laboratory in a single 1.5 hr session. Each session began with a detailed explanation of the procedures before written consent was obtained. Participants then completed general information, and computer proficiency (CPQ) questionnaires, and two subtests of the Wechsler Adult Intelligence Scale–Fourth Edition (WAIS-IV; Wechsler, 2008) in one of four test orders, such that the four experimental tasks they were asked to complete alternated with these questionnaires and WAIS-IV subtests.
General information questionnaire. An 11-item questionnaire was administered to collect information about age, gender, and geographic and educational background.
CPQ. The CPQ is a 33-item paper-pencil, self-report questionnaire designed to assess the level of computer proficiency in adults in six domains: Computer Basics, Printing, Communication, Internet, Scheduling, and Multimedia (Boot et al., 2015). Participants rated their perceived ability to perform a specific task on a 5-point scale (1 = Never tried to 5 = Very easily). We created an LMS domain to measure proficiency in using LMS. Domain scores were computed by averaging the responses to items in each domain. The six original domain scores were summed to produce the Total CPQ scores.
Digit Span and Coding. Scores generated from the administration of the Digit Span and Coding subtests of the WAIS-IV (an individually administered measure of cognitive ability for individuals aged 16–90 years; Wechsler, 2008) were used to estimate working memory capacity, and psychomotor and visual motor speed, respectively. These constructs are known to be related to performance on computer-based tasks (Ownby & Czaja, 2008). The Digit Span subtest has three parts: Forward (individual tries to repeat digits forward); Backward (individual tries to repeat digits backward); and Sequencing
(individual tries to repeat digits in ascending order). In the Coding subtest, individuals use a key to copy symbols that are paired with numbers within time limits. The normative mean scaled score for each subtest is 10 (SD = 1).
Experimental tasks. The stimulus set consisted of 400 screenshots of various LMS pages from trial versions and existing courses of the top 26 LMS used in post-secondary education in North America. LMS pages (above-the-fold or content that fills the screen) were captured at a resolution of 1920 x 1024 pixels in 24-bit true colour. Screenshots included course content to ensure that the images were representative of the visual display that learners would typically view. Objective measurements of complexity (see Table 1) were extracted from each of the 400 images using existing algorithms; the source code was obtained online at https://homes.cs.washington.edu/~reinecke/publications.html. These metrics were previously defined by Reinecke et al. (2013), Hasler and Suesstruck (2003), and Zheng, Chakraborty, Lin, and Rauschenberger (2009). The values for number of leaves classified as text area and vertical and horizontal balance were zero for our sample of images and could not be entered in our analyses. Predicted complexity values were calculated using the remaining image metrics (Reinecke et al., 2013) and were used to classify the 400 screenshots into three equal-sized categories for Experiment 2: low (lower 33% of values), medium, and high complexity images (upper 33% of values) (Gelman & Park, 2008) (Figure 1). We also noted JPEG (Joint Photographic Experts Group) file size.
Table 1
Definitions of the image metrics extracted from the images of learning management systems (LMS) Image metrics Definition
Colour
Hue Average pixel value of the purity of colours. Values range from 0 to 180. Saturation Average pixel value of the intensity of colours. Values range from 0 to 255. Value Average pixel value of the relative lightness or darkness of colours. Values
range from 0 to 255.
Colourfulness Weighted sum of the trigonometric length of the standard deviation in a*b* [green (-) to red (+)/blue (-) to yellow (+)] space and the distance of the centre to the neutral axis. Values can begin at 0 (not colourful) and have no upper limit, but values of 109+ have been interpreted as extremely
Image metrics Definition Space-based decomposition
Number of leaves
Recursive division of an image into N evenly spaced regions (leaves) until a region has no visible space divider or is too small. This is a continuous variable beginning at 0.
Number of image areas
Area identified as a separate image using an algorithm. Adjacent images may count as one image. This is a continuous variable beginning at 0.
Number of text groups
Number of horizontal groups of text characters. This is a continuous variable beginning at 0.
Text area and non-text area
Number of regions classified based on whether they contain text or non-text information.
Quadtree decomposition Number of
quadtree leaves
Recursive division of an image into subparts based on the amount or type of information until divisions can not longer be made. This is a continuous variable beginning at 0.
Symmetry Degree to which the arrangement of the leaves on the flips side of the
horizontal and vertical axes are similarly arranged. Values range from 0 (less symmetrical) to 1 (more symmetrical).
Balance Degree to which the top and bottom, and right and left parts of an image have similar optical weights (e.g., a similar number of leaves). Values range from 0 (less balanced) to 1 (more balanced).
Equilibrium Degree to which the quadtree leaves center around the midpoint of an image. Values range from 0 (less centering) to 1 (more centering).
Note. Adapted from “Predicting users' first impressions of website aesthetics with a quantification of perceived visual complexity and colorfulness,” by Reinecke et al., 2013, Proceedings of the SIGCHI Conference on Human Factors in Computing Systems - CHI '13, Table 1, p.3. Copyright 2013 by the Association for Computer Machinery. Adapted with permission.
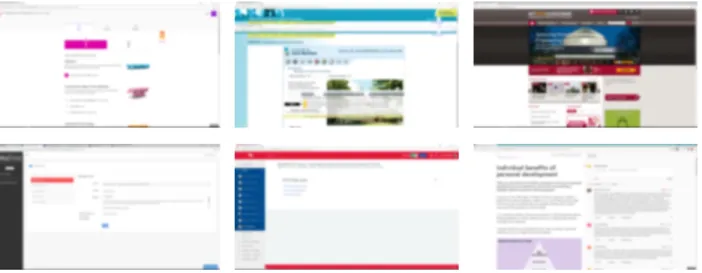
Figure 1. Examples of screenshots of LMS of low (left images), medium (centre images), and high (right images) complexity according to complexity values generated using an existing model (Reinecke et al., 2013). The images have been blurred for publication.
Stimuli were presented on a 24-in. widescreen LCD monitor with a 2000-MHz Pentium II computer, using Experiment Builder software (SR Research, ON, Canada). For two of the four
experimental tasks, participants viewed each of the 400 screenshots for 500 ms. This was followed by a screen asking them to rate (with a keypress) the visual complexity (or colourfulness as part of a separate investigation) by means of Likert-type scales (1 = not at all to 7 = extremely) (Reinecke et al., 2013; Tuch et al., 2009). Participants rated the screenshots in two separate blocks and took short breaks after every 50 trials. Ten practice trials were administered prior to the start of each task so that participants could become familiar with the task and could ask clarifying questions.
The procedures for the other two experimental tasks were similar to those described above except that participants viewed a subset of screenshots (n = 60) that varied in levels of complexity (simple, neutral, complex) while gaze behaviours were sampled (500 Hz, spatial resolution = 0.5°) using the EyeLink 1000 Plus eye-tracking system (SR Research, ON, Canada). An eye-tracker was employed to collect indices used to make inferences about visual attention (Holmqvist et al., 2015). Each
screenshot remained on the screen until the end of the participant’s first fixation, and then participants rated its complexity (or colourfulness as part of a separate investigation) by means of Likert-type scales. A break followed every 20 trials. Prior to administration of the two eye-tracking experiments, a 9-point calibration/validation procedure was performed. A chin rest was utilized to limit head movement and drift correction was performed on each trial to manage eye gaze drift due to fatigue and changes in head position.
Results
Mean ratings of visual complexity from participants’ ratings were computed for each of the 400 screenshots. Examination of various regression diagnostics revealed that six images had undue influence on the model in the preliminary stages of our analyses and were removed prior to running subsequent
analyses. Next, we entered the image metrics (predictors from Table 1, with the exception of number of leaves classified as text area and vertical and horizontal balance for reasons described above) and mean subjective complexity ratings for each screenshot (outcome) into two separate multiple linear
regressions with backward elimination to find the most parsimonious model. The metrics that did not contribute significantly to the prediction of the subjective ratings were removed in an iterative fashion. The final complexity model indicated that six image metrics (see Table 2) explained 46.6% of the variance of the subjective complexity ratings [R2 = .47, F(6, 387) = 58.13, p < .001].
Table 2
Final regression model for the perception of the visual complexity of learning management systems user interfaces, r(384) = .688, R2 = .47, p < .001 b SE b β p Constant 3.917 .478 < .001 Hue -.004 .001 -.144 .002 Value -.003 .001 -.146 .002 Colourfulnessa .007 .001 .251 < .001
Number of text groups .010 .001 .616 < .001
Number of image areas .011 .003 .167 < .001
Horizontal symmetry -1.459 .474 -.128 .002
aHasler & Suesstruck (2003)
Next, we calculated the complexity of each screenshot using the unstandardized coefficients from our final regression model and from a previous model (Reinecke et al., 2013), and examined their relationships with subjective complexity ratings (see Table 3). The correlation coefficients were
significantly different from each other (Z = 2.09, p = .04, two-tailed), perhaps reflecting fundamental differences in the purpose and use of LMS and consumer-focused webpages. As an additional test for operationalizing visual complexity, we ran correlations between subjective complexity ratings and JPEG file size and found a significant association between these two variables (p < .001), which may suggest that JPEG file size provides a relatively good estimate of LMS complexity without the need to collect subjective complexity ratings or using image metrics and may be a more practical proxy for complexity, particularly for LMS developers.
Table 3
Pearson product-moment correlation coefficients between participants’ subjective ratings of complexity, JPEG file size, and predicted complexity ratings
Complexity variables 1 2 3
1 Subjective complexity ratings -
2 JPEG file size .59* -
3 Predicted complexity ratings (our final model) .69* .69* -
4 Predicted complexity ratingsa .60* .69* .86*
a Reinecke et al. (2013)
*p < .001 †N = 391–395 screenshots
Negative correlations between digit span scaled scores and complexity ratings for each complexity level (low, medium, high; r(29) = -.43, -.41, -.40, p < .05, for all three correlations,
respectively) were evident. Other participant characteristics (i.e., age, years of education, CPQ Total and the LMS domain scores, coding subtests scaled scores) were not associated with subjective complexity ratings.
The mean subjective complexity ratings from the 400 trial (500 ms exposure duration) and the 60 trial (exposure duration limited to the end of the first fixation) conditions were highly correlated, r(58) = .755, p < .001, suggesting reliable complexity ratings regardless of exposure duration. The effect of complexity (low, medium, high) on mean fixation durations was significant, F(2, 57) = .10, p = .91. On average, participants fixated the images for 213 ms (SD = 63).
Experiment 2
In Experiment 1, participants perceived the LMS screenshots as similarly complex whether they viewed the images for 500 ms or to the end of their first fixation (M = 213 ms, SD = 63). To verify that first impressions of complexity are similar across various exposure durations, we presented a subset of images from Experiment 1 to a new group of participants in Experiment 2 and asked them to rate complexity after various presentation times while their gaze behaviours were recorded.
Method
Participants. Undergraduate students at the University of Manitoba, Winnipeg, Canada (N = 16; 9 women) with normal or corrected-to-normal acuity, colour vision, and hearing participated in
Experiment 2. Participants’ mean age was 22.1 years (SD = 3.2 years; Range: 18–30 years) and they had an average of 3.2 years of post-secondary education (SD = 2.4; Range = 1–8 years). The sample
represented individuals from a wide range of geographical and educational backgrounds and all participants spoke English fluently. Participants received a $20 gift card following written informed consent. Experiment 2 was approved by the university’s Research Ethics Board.
Materials and procedure. Participants completed the general information questionnaire, the CPQ, and the Digit Span and Coding subtests counterbalanced in four task orders. After each task, one block of the experiment was administered. As in Experiment 1, participants were seated at a desk and viewed the experimental stimuli on a high-precision 24-in. widescreen LCD monitor with a Pentium II computer, using Experiment Builder software (SR Research, ON, Canada). Prior to the eye-tracking experiments, a 9-point calibration/validation was performed. Drift correction was performed on every trial to ensure that data was adjusted for movement.
Sixty screenshots, classified as low (n = 20), medium (n = 20), and high (n = 20) complexity were selected from the sample of 400 screenshots in Experiment 1 (see Figure 2). Each participant completed three blocks of 10 trials (10 screenshots from each level of complexity). During a given block, the screenshot remained on the screen for 50 ms, 150 ms, 500 ms, or until the end of the participant’s first fixation (M = 235 ms, SD = 98). Participants then rated the complexity of the
screenshot by means of Likert-type scales. Experimental tasks and blocks were counterbalanced. Each screenshot was viewed by at least three participants and mean ratings of complexity were calculated for each screenshot.
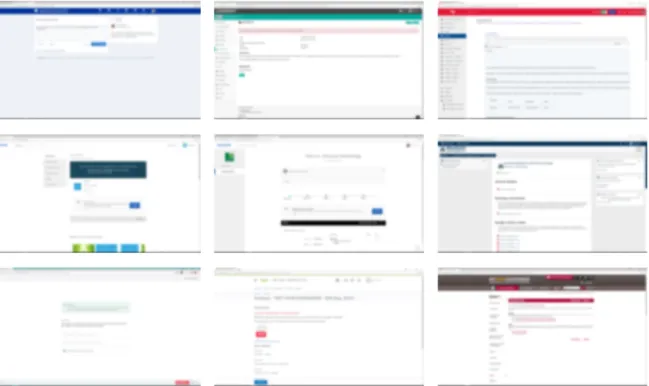
Figure 2. Examples of screenshots of LMS of low (left column), medium (centre column), and high (right column) complexity according to both participants’ subjective ratings of complexity and
Results
First, we examined the mean fixation durations across Exposure Duration conditions to verify that participants attended longer to the stimuli that were presented for longer durations. The results of a 3 (Complexity: low, medium, high) x 4 (Exposure Duration: 50 ms, 150 ms, 500 ms, End of first fixation) ANOVA, with repeated measures on the last factor, indicated a main effect of Exposure Duration, F(1.3, 72.9) = 137.78, p < .001, ηp2 = .71. Follow-up paired-samples t-tests confirmed that the
mean fixation durations increased with increasing exposure duration, t(58) > 4.05, p < .001, d > .53 (for 6 contrasts). Mean ratings in each of the Exposure Duration conditions were as follows: 50 ms (M = 47 ms, SD = 4), 150 ms (M = 133, SD = 13), 500 ms (M = 183, SD = 38), and End of first fixation (M = 236, SD = 99). The main effect of Complexity and the interaction between the two variables was not significant.
Next, mean subjective complexity ratings were submitted to a 3 (Complexity: low, medium, high) x 4 (Exposure Duration: 50 ms, 150 ms, 500 ms, end of first fixation) ANOVA, with repeated measures on the last factor. A main effect of Complexity was evident, F(2, 56) = 4.08, p = .02, ηp2 = .13.
Follow-up tests (LSD) confirmed that the mean ratings were significantly lower for low than for high complexity images (p = .006). There was no main effect of Exposure Duration and no interaction between the two variables. Together, these findings suggest stability in viewers’ perceptions of complexity across exposure durations.
General Discussion
In the present research, we found that image metrics could be used to predict students’ ratings of complexity of LMS user interfaces, and that this model was distinct from models reported in previous studies (Reinecke et al., 2013). For example, our model was unique in that value (a colour metric) and horizontal symmetry (a quadtree decomposition metric) were significant (negative) predictors of complexity (see Figure 3). Symmetry (or asymmetry), in addition to the number of elements, has been argued to be an important dimension of complexity (Nadal, Munar, Marty, & Cela-Conde, 2010). The human visual system is uniquely tuned to detecting symmetry in the environment (Wagemans, 1997). When the environment appears more symmetrical, viewers perceive it as less complex (Attneave, 1957) and more aesthetically pleasing (Jacobsen & Höfel, 2003) thereby eliciting positive affect (Pecchinenda, Bertamini, Makin, & Ruta, 2014). Although some contend that vertical symmetry is easier to detect than horizontal symmetry, thus is more important for judgements about attractiveness (Huang et al., 2018), overall mirror symmetry (average symmetry across four axes) may be more predictive of several types of viewer judgements (citation/citations). For example, decreased mirror symmetry along with increased GIF (Graphics Interchange Format) image compression (RMSGIF) predict increased perception of complexity for a set of black and white abstract patterns (Gartus & Leder, 2017). Our findings from the present study suggest that the degree of horizontal symmetry above the fold must be used carefully and intentionally when designing LMS user interfaces; however, symmetry may not be important when determining whether the interfaces appear professional or unprofessional (Zheng, Chakraborty, Lin, & Rauschenberger, 2009).
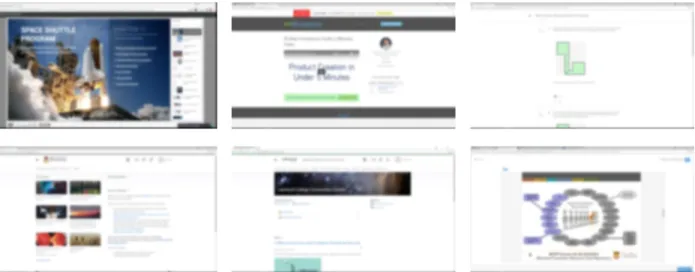
Figure 3. Examples of screenshots of LMS showing increasing horizontal symmetry from left to right. The images have been blurred for publication.
Slight decreases in hue and value and increases in colourfulness predicted higher ratings of LMS complexity. Our finding that value was a significant predictor of subjective complexity is a new finding but should not be surprising. Value is defined as the relative lightness or darkness of a colour, and contrasting values help to define specific aspects of a stimulus. When the overall value of a stimulus is low, boundaries between aspects of the stimulus are not easily seen by the viewer and may contribute to increased perceptions of complexity. Webpage colour, in general, strongly influence viewers’
satisfaction and trustworthiness ratings, which may in turn influence their intention to purchase (or e-loyalty). A blue colour scheme is universally linked to trust, whereas yellow is perceived as aversive causing feelings of hostility and distrust leading to greater or diminished e-loyalty, respectively (Cyr et al., 2010). Some research suggests that LMS interfaces with a black (or other dark colour fonts) on white backgrounds reduces viewers’ processing time and increase their memory for words, and that overall colour schemes of blue, green, pink, and orange are preferred (Tharangie, Irfan, Marasinghe, & Yamada, 2008). Further study on the effects of colour, hue, and value in LMS is warranted.
Consistent with previous findings (Lindgaard et al., 2006; Reinecke et al., 2013; Tractinsky et al., 2006), the results from our experiments demonstrated that complexity ratings were consistent across exposure durations ranging from 50 to 500 ms. Consistency in judgements about stimuli across time has been referred to as the “mere exposure effect” (Bornstein & D’Agostino, 1992; Zajonc, 1968). When first impressions of visual aesthetics are positive, a “halo effect” can occur whereby good first impressions influence perceptions of usability (Sonderegger & Sauer, 2010). The opposite is true for very poor first impressions (Lindgaard et al., 2006) that leave viewers feeling unimpressed and may lead to distrust (Cyr et al., 2009). While we did not ask our participants about whether the levels of
perceptions of reduced reliability or trustworthiness of the course content, and the subsequent avoidance of use and engagement with the LMS. This would be detrimental to learning.
Lastly, we found negative correlations between Digit Span scaled scores (Wechsler, 2008) and complexity ratings, suggesting that individuals with a reduced working memory capacity perceived LMS as more complex and perhaps more difficult to process than those with a greater working memory capacity. Working memory allows one to temporarily hold and process task relevant information
(Baddeley, 2012). Moreover, the ability to chunk information and having familiarity with the stimuli can increase working memory capacity (Shen, Popov, Delahay, & Reder, 2018). Thus, one might expect that experience with LMS and mean complexity ratings for screenshots of LMS would be negatively
correlated, however, we did not find this to be true in our study. One possible reason for this null finding may be that the university students participating in our research had limited experience with all the LMS from which our stimuli were derived.
Limitations and Future Research
Although investigations to define the visual complexity of consumer-focused websites (Harper et al., 2009; Ivory et al., 2001; Reinecke et al., 2013) and other types of visual stimuli (Corchs et al., 2016; Goldberg, 2014; Madan et al., 2018) have been conducted, to our knowledge, we are the first to examine the visual complexity of LMS using image metrics and students’ ratings of complexity. However, we must acknowledge several limitations of our research. First, although we used a large stimulus set, the number of participants in both experiments was relatively small, which reduces the generalizability of our findings. Therefore, it is important that additional research be conducted to replicate and extend our findings.
A second limitation of our research is that the images we used were screenshots of LMS that contained course content in addition to the visual design of the LMS itself. Students would rarely (if ever) view entirely blank course shells, however, we acknowledge that this decision may have added a potential confound. Additionally, if content included images of salient objects or people, students’ attention may be preferentially drawn to these aspects of the LMS screenshot. Regardless of age, we have a strong tendency to attend to faces more than the background when viewing scenes presented on a computer screen (Stoesz & Jakobson, 2014). Moreover, the presence of human images on consumer-based websites has been linked to higher levels of perceived warmth and social presence and greater image appeal (Cyr et al., 2009). Unfortunately, very few of our stimuli included images of people’s faces and we could not test whether this had an impact on complexity ratings. Thus, the presence of human faces is an important consideration for online teaching and learning environments and suggests that online courses include images or videos of the instructor teaching. Future research studies could involve the development of one course placed within various LMS so that content is kept constant and the impact of the visual design of specific LMS could be examined directly. Additional factors such as the presence of text-based instruction and instruction from a person in a video could also be examined.
Another limitation of our research is that we did not examine the impact of the complexity or other facets of visual aesthetics (e.g., craftsmanship; Moshagen & Thielsch, 2010) on learning outcomes. Direct relationship between visual complexity and learning outcomes are likely to be moderated or
mediated by several other factors. For example, researchers have shown that feelings of frustration, anger, and boredom are problematic as negative affect can dramatically reduce task performance and impede learning in traditional face-to-face educational settings (Christianson, 1992; Sharp, Hemmings, Kay, & Sharp, 2017). A clear understanding of the relationships between LMS engagement, attitudes towards such technologies, affect when using LMS, and then how those relationships impact student learning outcomes is an important consideration for future research (Coates et al., 2005). Such investigation would likely require various pillars of assessment including self-report, physiological assessment, and test scores to measure learning of content.
Finally, we examined the concept of complexity and examined relationships to viewers’ individual difference factors (e.g., working memory capacity), however, we did not ask participants to provide information about their preferences for the visual design of an LMS. Personalization by the system being used and customization by the user may improve the user experience and increase benefits to retailers, for example, by increasing buying and customer loyalty (Smith, 2017). Social media
platforms and other applications also allow users to modify the user interface (e.g., white vs. black background; modern vs. standard views); these ideas could be translated to LMS. Many LMS already allow instructors to customize the student view by reducing or adding the number of tools displayed, so it may be possible to add the ability for students to customize their view of the LMS. Learners may also benefit from personalization of a learning path based on their performance on certain tasks as they proceed through an online course (Niknam & Thulasiraman, 2020). The impact of personalization of the visual aspects of the LMS itself or how this variable interacts with the learning path approach or other teaching and learning strategies on student learning requires more investigation. This research may reveal, however, that limits to customization are necessary to avoid creating an overly complex learning environment (Berlyne, 1960; Geissler et al., 2006).
Conclusions
Objective characteristics of webpages, including image metrics generated from algorithms, can be used to predict more complex psychological principles and human behaviour (Harper et al., 2009; Ivory et al., 2001), which can be incredibly useful when planning studies to examine how the visual and navigational designs of LMS affects the student experience and learning outcomes. Limited empirical work has been done in the area of the visual perception of LMS; thus, examining postsecondary students’ perceptions of the visual complexity of LMS establishes the existence of visual design for LMS as a distinguishable and measurable construct in the field of education. Combining behavioural and physiological methodologies is also unique in education research and these methodologies may prove useful to further examine postsecondary students’ perceptions of LMS and their overall online learning experiences, and how these relate to academic outcomes.
Authors’ Note:
We gratefully acknowledge McKenna Brown who assisted with the collection of the stimuli for this research. We also thank the editor and reviewers for their valuable insights and comments that were used to enhance the quality of the manuscript.
References
Attneave, F. (1957). Physical determinants of the judged complexity of shapes. Journal of Experimental Psychology, 53(4), 221–227. doi:10.1037/h0043921
Baddeley, A. (2012). Working memory: Theories, models, and controversies. Annual Review of Psychology, 63(1), 1–29.
Bates, T., Desbiends, B., Donovan, T., Martel, E., Mayer, D., Paul, R., … Seaman, J. (2017). Tracking online and distance education in Canadian universites and colleges: 2017. The National Survey of Online and Distance Education in Canadian Post-Secondary Education, Vancouver, BC. Retrieved from https://www.newswire.com/files/e8/b0/f52d2613bf54ec6b35a454a344a0.pdf Berlyne, D. E. (1960). Conflict, arousal, and curiosity. New York: McGraw Hill.
Berners-Lee, T. (n.d.). The WorldWideWeb browser. Retrieved from https://www.w3.org/People/Berners-Lee/WorldWideWeb.html
Boot, W. R., Charness, N., Czaja, S. J., Sharit, J., Rogers, W. A., Fisk, A. D., … Nair, S. (2015). Computer proficiency questionnaire: Assessing low and high computer proficient seniors. Gerontologist, 55(3), 404–411. doi:10.1093/geront/gnt117
Bornstein, R. F., & D’Agostino, P. R. (1992). Stimulus recognition and the mere exposure effect. Journal of Personality and Social Psychology, 63(4), 545–552. doi:10.1037/0022-3514.63.4.545 Brunner-Sperdin, A., Scholl-Grissemann, U. S., & Stokburger-Sauer, N. E. (2014). The relevance of
holistic website perception. How sense-making and exploration cues guide consumers’ emotions and behaviors. Journal of Business Research, 67(12), 2515–2522.
doi:10.1016/j.jbusres.2014.02.004
Christianson, S. (1992). The handbook of emotion and memory: Research and theory. Hillsdale, NJ: Erlbaum Associates.
Coates, H., James, R., & Baldwin, G. (2005). A critical examination of the effects of learning
management systems on university teaching and learning. Tertiary Education and Management, 11(1), 19–36. doi:10.1080/13583883.2005.9967137
Corchs, S. E., Ciocca, G., Bricolo, E., & Gasparini, F. (2016). Predicting complexity perception of real world images. PLoS ONE, 11(6), 1–22. doi:10.1371/journal.pone.0157986
Cyr, D., Head, M., & Larios, H. (2010). Colour appeal in website design within and across cultures: A multi-method evaluation. International Journal of Human Computer Studies, 68(1–2), 1–21. doi:10.1016/j.ijhcs.2009.08.005
Cyr, D., Head, M., Larios, H., & Pan, B. (2009). Exploring human images in website design: A multi-method approach. MIS Quarterly, 33(3), 539–566. doi:10.2307/20650308
Ellis, R. K. (Ed.). (2009). Field guide to learning management systems. American Society for Training & Development Learning Circuits Retrieved from
https://web.csulb.edu/~arezaei/ETEC551/web/LMS_fieldguide_20091.pdf
Eveland Jr., W. P., & Dunwoody, S. (2001). User control and structural isomorphism or disorientation and cognitive load? Learning from the web versus print. Communication Research, 28(1), 48–78. doi:10.1177/009365001028001002
Forsythe, A., Mulhern, G., & Sawey, M. (2008). Confounds in pictorial sets: The role of complexity and familiarity in basic-level picture processing. Behavior Research Methods, 40(1), 116–129. doi:10.3758/BRM.40.1.116
Gartus, A., & Leder, H. (2017). Predicting perceived visual complexity of abstract patterns using computational measures: The influence of mirror symmetry on complexity perception. PLoS ONE, 12(11), 1–29. doi:10.1371/journal.pone.0185276
Geissler, G. L., Zinkhan, G. M., & Watson, R. T. (2006). The influence of home page complexity on consumer attention, attitudes, and purchase intent. Journal of Advertising, 35(2), 69–80. doi:10.1080/00913367.2006.10639232
Gelman, A., & Park, D. K. (2008). Splitting a predictor at the upper quarter or third and the lower quarter or third. The American Statistician, 62(4), 1-8. doi:10.1198/000313008X366226 Goldberg, J. H. (2014). Measuring software screen complexity: Relating eye tracking, emotional
valence, and subjective ratings. International Journal of Human-Computer Interaction, 30(7), 518–532. doi:10.1080/10447318.2014.906156
Harper, S., Michailidou, E., & Stevens, R. (2009). Toward a definition of visual complexity as an implicit measure of cognitive load. ACM Transactions on Applied Perception, 6(2), 1–18. doi:10.1145/1498700.1498704
Hasler, D., & Suesstrunk, S. E. (2003). Measuring colourfulness in natural images. Proceedings SPIE 5007 – Human Vision and Electronic Imaging VIII, 87–95. doi:10.1117/12.477378
Jacobsen, T. , & Höfel, L. (2003). Descriptive and evaluative judgment processes: Behavioral and electrophysiological indices of processing symmetry and aesthetics. Cognitive, Affective & Behavioral Neuroscience, 3(4), 289–299. doi:10.3758/CABN.3.4.289
Holmqvist, K., Nystrom, M., Andersson, R., Dewhurst, R., Jarodzka, H., & van de Weijer, J. (2015). Eye tracking: A comprehensive guide to methods and measures. Oxford, UK: Oxford University Press.
Huang, Y., Xue, X., Spelke, E., Huang, L., Zheng, W., & Peng, K. (2018). The aesthetic preference for symmetry dissociates from early-emerging attention to symmetry. Scientific Reports, 8(1), 1–8. doi:10.1038/s41598-018-24558-x
Ivory, M. Y., Sinha, R. R., & Hearst, M. A. (2001). Empirically validated web page design metrics. Proceedings of the SIGCHI Conference on Human Factors in Computing Systems - CHI ’01, 53– 60. New York, NY: Society for Computing Machinery. doi:10.1145/365024.365035
Ladyshewsky, R. K. (2004). E-learning compared with face to face: Differences in the academic
achievement of postgraduate business students. Australasian Journal of Educational Technology, 20(3), 316–336. doi:10.14742/ajet.1350
Lazar, J., Bessiere, K., Ceaparu, I., Robinson, J., & Shneiderman, B. (2003). Help! I’m lost: User frustration in web navigation. IT & Society, 1(3), 18–26.
Lim, Y. M., Chee, K. N., Ayesh, A., & Stacey, M. (2013). Designing learning management system to encourage e-Learning sustainability. In: Proceedings of Innovation and Transformation in Learning and Teaching, Kauala Lumpure: Tunku Adbdul Rahman University College (pp. 76– 83). http://hdl.handle.net/2086/13847
Lindgaard, G., Fernandes, G., Dudek, C., & Brown, J. (2006). Attention web designers: You have 50 milliseconds to make a good first impression! Behaviour & Information Technology, 25(2), 115– 126. doi:10.1080/01449290500330448
Liu, Y. (2003). Engineering aesthetics and aesthetic ergonomics: Theoretical foundations and a dual-process research methodology. Ergonomics, 46(13–14), 1273–1292.
doi:10.1080/00140130310001610829
Mabila, J., Gelderblom, H., & Ssemugabi, S. (2014). Using eye tracking to investigate first year students' digital proficiency and their use of a learning management system in an open distance environment. African Journal of Research in Mathematics, Science and Technology Education, 18(2), 151–163. doi:10.1080/10288457.2014.928449
Madan, C. R., Bayer, J., Gamer, M., Lonsdorf, T. B., & Sommer, T. (2018). Visual complexity and affect: Ratings reflect more than meets the eye. Frontiers in Psychology, 8(JAN), 1–19. doi:10.3389/fpsyg.2017.02368
McDougall, S. J., Curry, M. B., & de Bruijn, O. (1999). Measuring symbol and icon characteristics: Norms for concreteness, complexity, meaningfulness, familiarity, and semantic distance for 239 symbols. Behavior Research Methods, Instruments, & Computers: A Journal of the Psychonomic Society, Inc, 31(3), 487–519.
Means, B., Toyama, Y., Murphy, R., & Baki, M. (2013). The effectiveness of online and blended learning: A meta-analysis of the empirical literature. Teachers College Record, 115(030303), 1– 47.
Michailidou, E., Harper, S., & Bechhofer, S. (2008). Visual complexity and aesthetic perception of web pages. SIGDOC 2008 - Proceedings of the 26th ACM International Conference on Design of
Moshagen, M., & Thielsch, M. T. (2010). Facets of visual aesthetics. International Journal of Human Computer Studies, 68(10), 689–709. doi:10.1016/j.ijhcs.2010.05.006
Nadal, M., Munar, E., Marty, G., & Cela-Conde, C. J. (2010). Visual complexity and beauty
appreciation: Explaining the divergence of results. Empirical Studies of the Arts, 28(2), 173–191. doi:10.2190/EM.28.2.d
Nadkarni, S., & Gupta, R. (2007). A task-based model of perceived website complexity. MIS Quarterly, 31(3), 501–524. doi:10.2307/25148805
Nguyen, T. (2015). The effectiveness of online learning: Beyond no significant difference and future horizons. MERLOT Journal of Online Learning and Teaching, 11(2), 309–319. Retrieved from https://jolt.merlot.org/Vol11no2/Nguyen_0615.pdf
Niknam, M., & Thulasiraman, P. (2020). LPR: A bio-inspired intelligent learning path recommendation system based on meaningful learning theory. Education and Information Technologies, 25, 3797–3819. doi:10.1007/s10639-020-10133-3
Ownby, R., & Czaja, S. (2008). Cognitive abilities that predict success in a computer-based training program. Gerontologist, 48(2), 170–180. doi: 10.1093/geront/48.2.170
Pecchinenda, A., Bertamini, M., Makin, A. D. J., & Ruta, N. (2014). The pleasantness of visual symmetry: Always, never or sometimes. PLoS ONE, 9(3), 1–10.
doi:10.1371/journal.pone.0092685
Pomales-García, C., Liu, Y., & Mendez, D. (2005). Web-based distance learning technology: Does appearance matter? Proceedings of the Human Factors and Ergonomics Society, 49(7), 755–758. doi:10.1177/154193120504900703
Reinecke, K., Yeh, T., Miratrix, L., Mardiko, R., Zhao, Y., Liu, J., & Gajos, K. Z. (2013). Predicting users’ first impressions of website aesthetics with a quantification of perceived visual complexity and colorfulness. Proceedings of the SIGCHI Conference on Human Factors in Computing Systems – CHI ’13, 2049–2058. doi:10.1145/2470654.2481281
Sharp, J. G., Hemmings, B., Kay, R., & Sharp, J. C. (2017). Academic boredom and the perceived course experiences of final year education studies students at university. Journal of Further and Higher Education, 2017(5), 600–627. doi:10.1080/0309877X.2017.1386287
Shen, Z., Popov, V., Delahay, A. B., & Reder, L. M. (2018). Item strength affects working memory capacity. Memory and Cognition, 46(2), 204–215. doi:10.3758/s13421-017-0758-4
Smith, A. D. (2017). Exploring the inherent growth of e-tailing via e-personalization and technological innovations. International Journal of Innovation in the Digitial Economy, 8(1), 1–28.
doi:10.4018/IJIDE.2017010102
Sonderegger, A., & Sauer, J. (2010). The influence of design aesthetics in usability testing: Effects on user performance and perceived usability. Applied Ergonomics, 41(3), 403–410.
Stoesz, B. M., & Jakobson, L. S. (2014). Developmental changes in attention to faces and bodies in static and dynamic scenes. Frontiers in Psychology, 5(193), 1–9. doi:10.3389/fpsyg.2014.00193 Tallent-Runnels, M. K., Thomas, J. A., Lan, W. Y., Cooper, S., Ahern, T. C., Shaw, S. M., & Liu, X.
(2006). Teaching courses online: A review of the research. Review of Educational Research, 76(1), 93–135. doi:10.3102/00346543076001093
Tharangie, K. G. D., Irfan, C. M. ., Marasinghe, C. ., & Yamada, K. (2008). Kansei engineering assessing system to enhance the usability in e-learning web interfaces: Colour basis.
Supplementary Proceedings of the 16th International Conference on Computers in Education, 145–150. Taipei, Taiwan.
Tractinsky, N., Cokhavi, A., Kirschenbaum, M., & Sharfi, T. (2006). Evaluating the consistency of immediate aesthetic perceptions of web pages. International Journal of Human Computer Studies, 64(11), 1071–1083. doi:10.1016/j.ijhcs.2006.06.009
Tuch, A. N., Bargas-Avila, J. A., Opwis, K., & Wilhelm, F. H. (2009). Visual complexity of websites: Effects on users’ experience, physiology, performance, and memory. International Journal of Human Computer Studies, 67(9), 703–715. doi:10.1016/j.ijhcs.2009.04.002
Wagemans, J. (1997). Characteristics and models of human symmetry detection. Trends in Cognitive Sciences, 1(9). 346–352. doi:10.1016/S1364-6613(97)01105-4
Walhout, J., Brand-Gruwel, S., Jarodzka, H., Van Dijk, M., De Groot, R., & Kirschner, P. A. (2015). Learning and navigating in hypertext: Navigational support by hierarchical menu or tag cloud? Computers in Human Behavior, 46, 218–227. doi:10.1016/j.chb.2015.01.025
Wang, Q., Yang, S., Liu, M., Cao, Z., & Ma, Q. (2014). An eye-tracking study of website complexity from cognitive load perspective. Decision Support Systems, 62, 1–10.
doi:10.1016/j.dss.2014.02.007
Wechsler, D. (2008). WAIS-IV administration and scoring manual. San Antonio, TX: Psychological Corporation.
Zain, J. M., Tey, M., & Goh, Y. (2011). Does aesthetics of web page interface matters to Mandarin learning?, International Journal of Computer Science and Network Security, 7(8), 43–51. Retrieved from arXiv:1101.1608
Zajonc, R. B. (1968). Attitudinal effects of mere exposure. Journal of Personality and Social Psychology Monographs, 2(2 Pt. 1), 1-27. doi:10.1037/h0025848
Zheng, X. S., Chakraborty, I., Lin, J. J.-W., & Rauschenberger, R. (2009). Correlating low-level image statistics with users - rapid aesthetic and affective judgments of web pages. Proceedings of the 27th International Conference on Human Factors in Computing Systems - CHI 09, 1–10.
Authors
Brenda M. Stoesz, PhD, is a Faculty Specialist, The Centre for the Advancement of Teaching and Learning, University of Manitoba, Canada, where she develops resources and professional development opportunities for academic staff, and conducts research on various topics in higher education, including academic integrity and perceptions and use of learning management systems.
brenda.stoesz@umanitoba.ca
Mehdi Niknam, PhD, is a Senior Instructional Technology Specialist, The Centre for the Advancement of Teaching and Learning, University of Manitoba, Canada, where he develops integrated technology solutions supporting teaching and learning, and conducts research in various topics in eLearning including adaptive learning and the use of learning management systems.
Mehdi.Niknam@umanitoba.ca
Jessica Sutton, BKin, is a graduate student in the Master of Occupational Therapy program at the University of Manitoba and served as the research assistant at The Centre for the Advancement of Teaching and Learning during the completion of this project.
Jessica.Sutton@umanitoba.ca
This work is licensed under a Creative Commons Attribution-NonCommercial CC-BY-NC 4.0 International license.