Disrupting dynamic f-actin enhances skeletal muscle contraction due to
mechanical softening
by
Vivek Sivathanu
B.Tech. Mechanical Engineering (2010), Indian Institute of Technology, Madras
S.M. Mechanical Engineering (2013), M.I.T.
Submitted to the Department of Mechanical Engineering
in Partial Fulfillment of the Requirements for the Degree of
Doctor of Philosophy in Mechanical Engineering
at the
MASSACHUSETTS INSTITUTE OF TECHNOLOGY
MASSACH SETS INSTITUTE OF TECHNOLOGY
FEB
0
9 2018
LIBRARIES
February 2018
2018 Massachusetts Institute of Technology. All rights reserved.
Signature redacted
Signature of Author:
Certified by:
Accepted by:
ARCHIVES
Department of Mechanical Engineering January 08, 2018
Signature redacted
Roger D. Kamm Professor of Mechanical Engineering Professor of Biological Engineering Thesis Supervisor
Signature redacted
Rohan Abeyaratne Chairman, Committee on Graduate Students Professor of Mechanical Engineering
77 Massachusetts Avenue
Cambridge, MA 02139
MITLibranies
http://Iibraries.mit.edu/askDISCLAIMER NOTICE
Due to the condition of the original material, there are unavoidable
flaws in this reproduction. We have made every effort possible to
provide you with the best copy available.
Thank you.
The images contained in this document are of the
best quality available.
Disrupting dynamic f-actin enhances skeletal muscle contraction due
to mechanical softening
By
Vivek Sivathanu
Submitted to the Department of Mechanical Engineering
on January 08, 2018 in Partial Fulfillment of the Requirements for the Degree of Doctor of Philosophy in Mechanical Engineering
ABSTRA CT
Skeletal muscle wasting disorders such as sarcopenia affect the daily mobility of millions of aging people globally due to decreased muscle mass and decreased muscle efficiency. In this study we discover a novel target to improve the efficiency of skeletal muscle by targeting the dynamic f-actin cytoskeleton.
Using two model systems, an ex-vivo mouse muscle model and a novel in vitro optogenetic skeletal muscle micro-tissue model, we show that disruption of the dynamic f-actin cytoskeleton using small molecule actin dynamics inhibitors leads to a persistent 2-fold improvement in muscle active contractility. We explored possible drawbacks of f-actin disruption, including loss of mechanical integrity, cell death, and intracellular organelle damage. None of these downsides actually present themselves with f-actin disruption. Muscle fatigue resistance however does seem to be slightly affected. We performed a detailed characterization of the cytoskeletal modifications that occur during f-actin
disruption using dose-response-recovery studies, live f-actin imaging, fluorescence recovery after photobleaching and more targeted f-actin disruption. Using these studies we conclude that treatments which shorten f-actin filaments seem to improve contraction. We also uncovered previously unidentified
roles of branched and tropomyosin stabilized f-actin in force transmission.
Biomechanical testing at the cell level using AFM and at the tissue level using a micro-tensile test shows a drop in mechanical stiffness that correlates well with a corresponding improvement in muscle force. We ruled out a range of alternate hypotheses involving changes to sarcomeric proteins and energetic activity, that could explain the force improvement, concluding that the force improvement due to f-actin disruption is due to mechanical softening of the cells which pose to a lower resistance to their own contraction. As a potential application, we show that a weak 3D printed muscle powered biological robot starts walking with f-actin disruption. This target has significant therapeutic potential in muscle disorders due to its disease non-specificity. We conclude by discussing possible future experiments that could reveal the best therapeutic applications.
Key words: Muscle strength, f-actin, cytoskeleton, Skeletal Muscle Tissue Engineering, Muscle Disorders
Thesis Advisor:
Roger D. Kamm, Professor of Biological and Mechanical Engineering, MIT
Thesis Committee Members:
Alan Grodzinsky, Professor of Biological, Electrical and Mechanical Engineering, MIT Michael Levin, Professor of Biology, Tufts University
Acknowledgements
First and foremost, I would first like to thank Professor Roger Kamm, my thesis advisor for inviting me to join his lab and mentoring me as a scientist, while giving me ample room to develop my independence and explore the wealth of opportunities MIT has to offer. Working with Roger has been one of the great honors of my life. His critical nature when it comes to the science, coupled with his pleasant personality and great leadership have all significantly molded my own style. It has given me the confidence to take on the next challenges in life.
I would also like to thank my thesis committee members, Professor Alan Grodzinsky, Professor
Michael Levin and Professor Rohit Karnik. Each time I have a meeting with them, I would be left with many more ideas to progress our scientific work. Their inputs were critical in shaping the thesis to its current form.
I owe special thanks to my collaborator Dr. Hesham Azizgolshani, one of the most skilled
scientists and engineers I've known, for his critical insights in shaping this work and in help with the mechanical designs used throughout this work. In aggregate, I'd estimate his inputs to have saved me years of time. I would also like to thank Dr. Emad Mooendarbary for his mentorship and collaboration. His inputs have been pivotal to defining the scope of this work. I would like to acknowledge Dr. Brianne Connizzo for her help with the mouse explant studies discussed herein. Dr. Sebastien Uzel and Dr. Devin Neal deserve special thanks for introducing me to the world of skeletal muscle biology and leaving me with the initial skillset required to get started with this work. Dr. Tatsuya Osaki and Dr. Ran Li have provided immense help both with experiments and with ideas throughout this thesis. My collaborator Dr. Stefano Ugolini, present during the initial phase on this work, was a great partner to provide the initial momentum for this work. I would also like to thank my collaborators Dr. Ritu Raman, Dr. Caroline Cvetkovic, Professor Rashid Bashir and Jorge Escribano for their great inputs to this work. The talented undergraduates who I've had a chance to work and mentor over the years include Zhuoning Zou, Blake Zhou, Divya Ravinder, Noopur Ranganathan, Licelotte Fernandez and Sarah Clarkson. It is tough to overestimate how much the youthful energy of each of these undergraduate students contributed to the momentum of the work.
Working in the Kamm lab has been an immense pleasure due in large part to the camaraderie. Roger has a fantastic ability to fill his lab with people who are not only great scientists, but also have wonderful personalities. Special gratitude goes to Dr. Jordan Whisler, Dr. Michelle Chen and Dr. Ran Li who have been an immense source of mental support over the years and have significantly shaped my personality and my future directions. Over the years, the Kamm lab members including Dr. loannis Zervantonakis, Dr. Michael Mak, Dr. Andrea Malandrino, Jean Carlos Serrano, Dr. Giovanni Offeddu and Anya Roberts have always been wonderful to be around.
I would like to thank the brilliant and inspiring folks I've met over the years in the MIT
community. Special thanks to my MIT Global Startup Workshop family, especially to Dr. Anurag Bajpayee, Dr. Nevan Hanumara, Dr. Melinda Hale, Joshua Schuler, Professor Ambika Goel Bajpayee, Abhishek Bajpayee and Dr. Rohit Singh. I should thank them for initiating my interest in business. I would also like to thank the range of business mentors I've had over the years through the MIT Legatum Center for Entrepreneurship and Development, the MIT IDEAS Global Challenge, the MIT Public Service Center, the MIT $100K Competition, the MIT Sloan School of Management and Flagship Ventures. Special thanks also goes to all my friends in Boston, in the US and elsewhere.
I would not have had any of these opportunities if my teachers didn't believe in me. Special
thanks go to my undergraduate mentor Professor Sarit K. Das who has been a great mentor, persuaded me to shift fields in to the life sciences at just the right time and has been a tremendous source of inspiration from near and far.
Finally, I would like to thank my family. My parents Sivathanu Pillai and Dr. Shobhana Sivathanu have been remarkable. The sacrifices they've made over the years to provide for every opportunity I've desired has been inspiring and left me with a debt I can only pay forward. Both of them, my sisters Shreaya and Priya, as well as my extended family have always believed me, even during my formative years when I've doubted myself. I thank all of them for their unconditional support.
This thesis work is supported by funding from National Science Foundation Emergent Behavior on Integrated Cellular Systems (NSF EBICS STC) as well as BioSym.
Dedication
Table of Contents
ABSTRACT ... 3
ACKNOW LEDGEM ENTS ... 4
DEDICATION ... 6
TABLE OF CONTENTS ... 7
LIST OF FIGURES ... 10
CHAPTER 1: INTRODUCTION ... 19
1.1 M OTIVATION ... 19
1.2 STRATEGIES TO COMBAT DECLINING MUSCLE FUNCTION ... 20
1.3 THESIS DIRECTION AND OUTLINE ... 21
CHAPTER 2: EFFECT OF F-ACTIN DISRUPTION ON SKELETAL MUSCLE FUNCTION ... 27
2.1 ACTIN DISRUPTION IN AN EX VIVO MOUSE MUSCLE ... 27
2.1.1 27 2.1.2 Does f-actin disruption enhance muscle contraction ex vivo? ... 27
2.1.3 Experimental model ... 27
2 .1.3 .1 T issue d issectio n ... 27
2.1.3.2 Contractility measurement ... 30
2.1.4 Results and Discussion ... 32
2.1.4.1 F-actin disruption in ex vivo mouse muscle improves contractility in a responsive subset of specimens 32 2.1.4.2 Conclusion and limitations of the explant model ... 35
2.2 F-ACTIN DISRUPTION IN A 2D IN VITRO MODEL ... 36
2.2.1 Hypothesis: F-actin disruption improves 2D myotube contraction ... 36
2.2.2 Experimental model ... 36
2.2.2.1 Optogenetic C2C12 2D myotube differentiation ... 36
2.2.2.2 Optogenetic stimulation ... 37
2.2.3 Results and Discussion ... 38
2.2.3.1 CytoD increases 2D myotube active contractions 14-fold ... 38
2.2.3.2 Conclusion and limitations of the 2D myotube model... 40
2.3 F-ACTIN DISRUPTION IN A 3D IN VITRO MODEL ... 41
2.3.1 Hypothesis: F-actin disruption improves 3D muscle force ... 41
2.3.2 Experimental model ... 41
2.3.2.1 Fabrication of the force sensing support and mount... 41
2.3.2.2 Fabrication of the 3D differentiated muscle bundle ... 42
2.3.2.3 Optical stimulation and active force quantification ... 46
2.3.3 Results and Discussion ... 47
2.3.3.1 3D mouse muscle contractility increases with f-actin disruption ... 47
2.4 POTENTIAL DRAWBACKS OF F-ACTIN DISRUPTION ... 49
2.4.1 Evolutionary advantages of f-actin ... 49
2.4.2 Increased cell death ... 50
2.4.2.1 Hypothesis: f-actin disruption leads to apoptosis and/or cell death ... 50
2.4.2.2 Experiment: Caspase3 qPCR and Live/Dead assay ... 50
2.4.2.3 Result: Mild f-actin disruption does not increase apoptosis or cell death ... 51
2.4.3 Structural integrity of myotubes ... 52
2.4.3.1 Hypothesis: f-actin disruption worsens sarcolemmal integrity... 52
2.4.3.2 Experiment: Creatine Kinase assay using exercising myotubes ... 53
2.4.3.3 Result: Mild f-actin disruption leaves the sarcolemmal integrity intact ... 54
2.4.4 Lowered fatigue resistance ... 55
2.4.4.2 Experiment: fatigue loading of 3D muscle for 15 minutes... 55
2.4.4.3 Result: Small change in fatigue resistance at short term ... 56
2.4.5 Intracellular organelle or protein dam age... 56
2.4.5.1 Hypothesis: f-actin disruption increases autophagy ... 56
2.4.5.2 Experiment: CytolD test of myotubes ... 56
2.4.5.3 Result: No change in autophagy ... 58
2.5 CONCLUSION AND NEXT STEPS ... 58
CHAPTER 3: CYTOSKELETAL CHANGES UNDERLYING F-ACTIN DISRUPTION ... 59
3.1 INTRODUCTION ... 59
3.2 REVERSIBILITY OF FORCE CHANGES DUE TO F-ACTIN DISRUPTION ... 59
3.2.1 Hypothesis: CytoD associated force improvem ent is reversible... 59
3.2.2 Experim ental methods ... 60
3.2.3 Results and conclusions ... 61
3.2.3.1 DM SO treatment ... 61
3.2.3.2 Cyto D 0.3pM treatment ... 62
3.2.3.3 CytoD 3 M treatment ... 62
3.2.3.4 Pulsed high-dose CytoD & continuous low-dose CytoD treatment ... 65
3.2.3.5 Conclusion and next steps...69
3.3 DYNAMICS OF CYTOD PENETRATION ... 69
3.3.1 Hypothesis: CytoD fully penetrates the muscle 3D tissue within a day...70
3.3.2 Experim ental m ethods ... 70
3.3.3 Results and conclusions ... 70
3.4 VISUALIZATION OF F-ACTIN BREAKDOWN ... 71
3.4.1 Hypothesis: Sarcom ericf-actin is not broken down by CytoD... 71
3.4.2 Experim ental m ethods ... 71
3.4.3 Results and discussion...72
3.4.4 Conclusions and next steps ... 77
3.5 THE SHIFTING POLYMERIZATION DYNAMICS OF F-ACTIN... 78
3.5.1 Hypothesis: CytoD depolymerizes the fast-turnover f-actin filam ents... 78
3.5.2 Experim ental methods ... 80
3.5.3 Results and discussion...85
3.6 TARGETING F-ACTIN SUBCOMPARTMENTS ... 88
3.6.1 Introduction to the different non-sarcom eric f-actin subtypes ... 89
3.6.2 Inhibiting formin-m ediated actin assem bly ... 91
3.6.3 Disruption of Arp2/3 mediated branched f-actin...93
3.6.4 Tropom yosin stabilized stable f-actin ... 94
3.6.5 Conclusions ... 95
CHAPTER 4: MECHANICAL SOFTENING IMPROVES MUSCLE FORCE ... 96
4.1 M ECHANICAL HYPOTHESIS ... 96
4.2 CHANGES IN SARCOMERIC FORCE PRODUCING PROTEINS ... 97
4.3 CHANGES IN CELL LEVEL STIFFNESS WITH AFM ... 98
4.3.1 Hypothesis: CytoD lowers the apparent elastic modulus of myotubes ... 98
4.3.2 Experim ental m ethods ... 99
4.3.3 Results and discussion...99
4.4 CHANGES IN TISSUE LEVEL STIFFNESS WITH A MICRO-TENSILE TEST ... 101
4.4.1 Hypothesis...101
4.4.2 Experim ental m ethods ... 101
4.4.3 Results...103
4.5 CHANGES IN ENERGETIC CONSUMPTION ... 104
4.5.1 Hypothesis: CytoD treatm ent does not increase glucose consumption ... 104
4.5.2 Experim ental methods ... 104
4.6 CHANGES IN ENERGETIC SIGNALING AND METABOLIC ACTIVITY ... 105
4.6.1 Hypotheses...105
Hypothesis 1: F-actin disruption does not affect AKT phosphorylation ... 105
Hypothesis 2: F-actin disruption does not change overall cellular metabolism...105
Hypothesis 3: F-actin disruption does not change mitochondrial activity ... 106
4.6.2 Experim ental m ethods ... 106
For hypothesis 1: W estern blot of AKT phosphorylation. ... 106
For hypothesis 2: MTT assay for mitochondrial succinate dehydrogenase activity...106
For hypothesis 3: TMR E assay for changes in mitochondrial membrane potential. ... 107
4.6.3 Results and conclusion...107
4.7 F-ACTIN STABILIZATION REVERSES THE PHENOMENON...110
4.7.1 Hypothesis: Stabilizing f-actin decreases the active force ... 110
4.7.2 Experimental m ethods ... 111
4.7.3 Results...111
4.8 CONCLUSION...113
CHAPTER 5: SUM M ARY, APPLICATIONS AND FUTURE STUDIES ... 115
5.1 SUMMARY...115
5.2 CHANGES IN ENGINEERED BIOLOGICAL ROBOT WALKING ... 116
5.3 HYPOTHESIS: F-ACTIN DISRUPTION COULD IMPROVE SKELETAL MUSCLE POWERED WALKING...116
5.3.1 Experim ental model ... 116
5.3.2 Results...119
5.4 FUTURE STUDIES ... 120
5.4.1 Recovery of function in muscle disease m odels ... 120
5.4.2 Drug delivery system...120
5.4.3 Targeted f-a ctin disruption ... 121
APPENDIX 1: PRIMER SEQUENCES FOR RT-PCR USED IN SEC. 2.4.2 AND 4.2...122
APPENDIX 2: CODE FOR CANTILEVER EDGE DETECTION ... 123
List of Figures
Fig. 0: US population demographics aged 60+ (U.S. Bureau of the Census)
Fig. 1. Cow with defective myostatin gene, as well as myostatin knockout mice displaying increased muscle mass
Fig.2: The unclear role of the non-sarcomeric f-actin in skeletal muscle force transmission. (A) Figure from 74. Protein binding studies have led to the hypothesis that f-actin links the sarcomeres to the costameres (which are the sites of connection of myotubes to extracellular sites). If this f-actin link is critical, disrupting non-sarcomeric f-actin may negatively affect force transmission. (B) Alternatively the non-sarcomeric f-actin may make the cell more rigid mechanically impeding contraction. In the Hill muscle model shown, the non-sarcomeric f-actin may contribute additional mechanical resistance to the parallel element, thereby mechanically posing an additional barrier to muscle contraction. In this case, disrupting the non-sarcomeric f-actin may enhance muscle contraction.
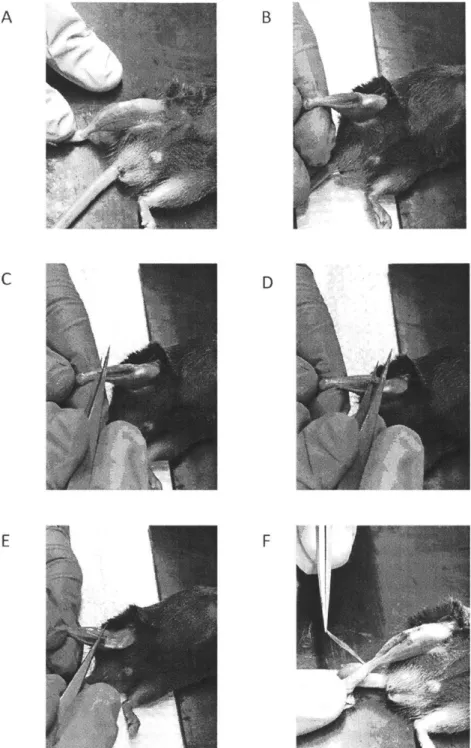
Fig. 3: Euthanized 2-3 month old wild type male mouse with skin removed ready for muscle dissection. Dissection was complete within an hour of sacrificing the animal.
Fig. 4: EDL Muscle dissection from the hindlimb. (A-E): Sequential steps of dissection involving
removing the tibialis anterior muscle as well as isolating the EDL muscle from the rest of the muscle belly. (F): dissection of the proximal tendon of the EDL muscle.
Fig. 5: Tissue mount for the EDL muscle explant with adjustable length and built-in electrodes
for electrical stimulation. (A and B) The CAD models show the top (A) and bottom (B) of the assembly respectively, with the slidable anchor that is used to adjust the resting length of the muscle. (C) Kapton based cantilevers are held together with an acrylic-silicone-acrylic sandwich and inserted in to the rectangular through-holes of the anchor. Furthermore, an EDL muscle tissue is bonded to the cantilever anchors as shown (D) An Arduino and motor driver setup is used for electrical stimulation of the muscle tissue.
Fig. 6: Overall EDL muscle explant assembly connected to a circuit for electrical stimulation.
(A) Zoomed-out view of the tissue mount with the EDL muscle connected to the
micromanipulator for length adjustment. (B) Zoomed-in view showing the mounted EDL muscle with platinum wire electrodes on either side of the muscle
Fig. 7: CytoD disrupts f-actin in mouse explant muscle tissues. (A) Phalloidin (Alexfluor 647)
stained tissues of muscle EDL explants with CytoD 3[tM or DMSO for 1 hour reveal that CytoD does disrupt the f-actin structures as reflected by lower phalloidin intensity under identical fluorescence microscopy settings. Scalebar is 60jim. (B) The intensity changes were quantified with respected to the mean DMSO intensity (n=6). The changes are statistically significant, as
analyzed by a one-tailed 2-sample t-test p = 7.59*10-6
Fig. 8: Decline of EDL muscle explant contractility with time, normalized with respect to the
contractility at 60mins. The two colored envelopes represent the 68% and 95% confidence intervals (1 and 2 sigma) of the data. The data represents the average and variation of 14 explant samples.
Fig. 9: About half of the CytoD treated tissues (n=5) decline in contraction just like DMSO
treated controls (n=5). The natural decline of all tissues was measured once every 10 minutes for 1 hour. After 1 hour, either DMSO or CytoD 3pM was applied to the tissues. The two colored envelopes of each kind grey, blue and red each represent the 68% and 95% confidence intervals (1 and 2 sigma) of the corresponding data
Fig. 10: About half of the CytoD treated tissues (n=4) exhibit a transient improvement in
contraction just like DMSO treated controls (n=5). The natural decline of all tissues was measured once every 10 minutes for 1 hour. After 1 hour, either DMSO or CytoD 3iiM was applied to the tissues. The two colored envelopes of each kind grey, blue and red each represent the 68% and 95% confidence intervals (1 and 2 sigma) of the corresponding data
Fig. 11: C2C12-ChR2[H134R] plasmid schematic
Fig. 12: Effect of CytoD 3 M (30 mins) on change in morphology of C2C12 myotubes grown on
IBIDI-treat dishes. Scalebar is 100um. Also shown is the change in index of movement with CytoD application, which is a measure of change in local pixel grayscale values with time. Closer to red is indicative of larger pixel changes, which happens when there are larger displacements. Closer to blue indicates almost no displacement, indicating areas without any contraction.
Fig. 13: Effect of CytoD 3 M (30mins) and DMSO on change in active displacements of C2C12
myotubes grown on IBIDI-treat dishes. CytoD treatment dramatically increases the active displacements of the myotubes, while DMSO treated controls result in only a very mild increase. The five point star points to the mean values of the displacements, which are also shown in green below the swarm plot. * p = 0.0045 One-tailed Mann Whitney U-test. ** p <
0.0001 One-tailed Mann Whitney U-test
Fig. 14: Acrylic/kapton base mount for 3D muscle formation and force sensing. The distance between the faces of the 2 cantilevers is 3mm. Also the entire acrylic base was inserted to fit snugly in a regular 35mm petri dish.
Fig. 15: Sequential process for the fabrication of a 3D muscle bundle attached to a compliant and a rigid cantilever, for measurement of optically stimulated contractile force. Process adapted from the sacrificial molding process described elsewhere1
Fig. 16: Phase contrast images of the development of the muscle fiber bundle. The myoblast/ECM gel compacts soon after cell seeding and compacts successively over the course of the differentiation. In this case, the culture was switched to differentiation medium 2 days after cell seeding and the final assay (force, stiffness etc.) was conducted on day 12 after switching.
Fig. 17: Image processing pipeline to detect (A) cantilever active movement. (B) A typical
pipeline is shown with the final output of the algorithm being the position of the edge of the cantilever as shown in red overlaid on top of the raw image. The green lines are many lines output by the Hough transform algorithm which detects many lines along the cantilever edge.
A linear regression is then performed to estimate a single edge based on all these edged
(shown in red). The position of this cantilever is tracked over time to estimate the displacement (both the x-location and slope of the line are considered).
Fig. 17: Image processing pipeline to detect cantilever active movement. A typical pipeline is
shown with the final output of the algorithm being the position of the edge of the cantilever as shown in red overlaid on top of the raw image. The green lines are many lines output by the Hough transform algorithm which detects many lines along the cantilever edge. A linear regression is then performed to estimate a single edge based on all these edged (shown in red). The position of this cantilever is tracked over time to estimate the displacement (both the x-location and slope of the line are considered).
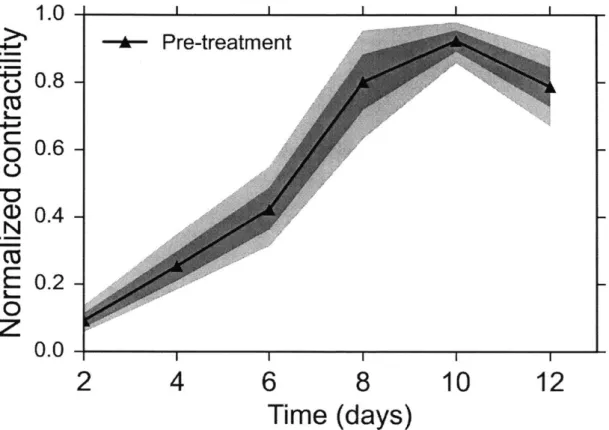
Fig. 18: Timecourse of active contraction of C2C12 based 3D muscle tissues. The contractility
seems to saturate (or change slower) after day 8 and peak contraction is reached between day
8-12. The two colored envelopes represent the 68% and 95% confidence intervals. n = 10
independent muscle fibers were used for this experiment. The contractility of each muscle fiber was normalized with respect to its respective maximum during the timecourse of differentiation.
Fig. 19: Timecourse of active contraction changes of C2C12 based 3D muscle tissues, within 3
hours. Statistically significant differences (p < 0.05) between the CytoD (n=5) and the DMSO
(n=5) are observed as early as 15 minutes
Fig. 20 Dose response test of 3D muscle active contractility with Cytochalasin D. The
contractions are measure prior to treatment (Pre-Treatment) as well as 2 hours after CytoD or
DMSO treatment. Normalization is with respect to the contraction prior to treatment. In the
case of Blebbistatin, treatment with 50ptM of this myosin inhibitor completely nullified the active force within 5 minutes of treatment. ** One-tailed Mann-Whitney test p = 0.00539. NS, p
> 0.05 One-tailed Mann-Whitney test. * p = 0.0105 One-tailed Mann-Whitney U-test
Fig. 21 Dose response test of 3D muscle active contractility with Latrunculin A. The contractions are measure prior to treatment (Pre-Treatment) as well as 2 hours after LatA or
DMS0 treatment. Normalization is with respect to the contraction prior to treatment.
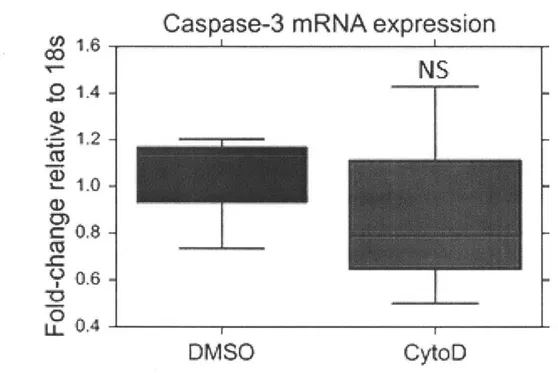
Fig. 22 Caspase-3 mRNA quantification (n=3) after 2 hours of CytoD 0.3ptM or DMSO treatment. p = 0.37. A one-tailed 2-sample t-test was used for statistical significance testing.
Fig. 23 Cell viability changes (n=6) after 52 hours of CytoD 0.3iiM or DMSO treatment. p = 0.46
A one-tailed 2-sample t-test was used for statistical significance testing.
Fig. 24 CytoD treatment likely leaves the plasma membrane intact. It does not significantly change the activity of Creatine Kinase in the supernatant of the optically stimulated C2C12 myotubes relative to DMSO treated and optically stimulated controls. However, as expected for positive controls, Triton 0.1% treated samples as expected, show a significant 4-fold increase in CK activity relative to DMSO controls, indicating the presence of CK in the cells. A one-tailed 2-sample t-test was used for statistical significance testing. p = 0.16 NS for CytoD (n=6) vs
DMSO(n=6). p = 7.5*10- for Triton (n=3) vs DMSO(n=6)
Fig. 25 Effect of a fatigue loading optical stimulus on muscle active contractility with (or
without) f-actin disruption using CytoD (or DMSO). DMSO controls show a self-strengthening behavior after 15minutes of fatigue load, while CytoD treated tissues do not. A one-tailed Mann
Whitney U-test was used for statistical significance testing. NS (p>0.05). *(p=0.032). N=3 samples were used for each condition.
Fig. 26 F-actin disruption with CytoD does not affect autophagy as indicated by the CytoID fluorescent based assay. N=3 samples were used for each condition. A 2-sample one-tailed t-test was used for statistical significance t-testing.
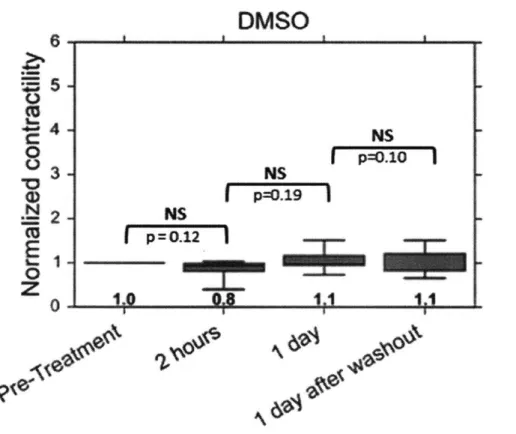
Fig. 27 The DMSO control tissues don't show any significant change in active muscle
contractility. Shown are the effects of DMSO application to C2C12 skeletal muscle active contractility 2 hours after treatment, 1 day after treatment, as well as 1 day after washout (which is 2 days after the treatment was initiated). The active force measured at different times for each device are normalized to the corresponding pre-treatment force (n=5). Statistical significance tests were conducted using a paired one-tailed t-test to check if any potential increases are significant.
Fig. 28 Mild f-actin disruption with CytoD 0.3[iM shows a significant increase in active muscle
contractility within 2 hours (1.6X) and a smaller (but not statistically significant) increase a day after treatment. The plot shown is the effect of CytoD 0.3kM application to C2C12 skeletal muscle active contractility 2 hours after treatment, 1 day after treatment, as well as 1 day after washout (which is 2 days after the treatment was initiated). The active force measured at different times for each device are normalized to the corresponding pre-treatment force (n=7). Statistical significance tests were conducted using a paired one-tailed t-test to check if any potential increases are significant. There is a statistically significant drop in active contraction
1 day after washout of CytoD 0.3[iM indicating at least partial reversibility of CytoD's effect,
partial because the force is still 50% greater than force prior to treatment (statistically significant).
Fig. 29 Strong f-actin disruption with Cyto 3iiM shows a significant increase in active muscle contractility within 2 hours (2.6X), a deleterious decrease relative to the peak of nearly 50% down to 1.4X and a recovery to nearly the level of the 2 hour peak (2.3X) within a day of CytoD washout. The plot shown is the effect of Cyto 3 M application to C2C12 skeletal muscle active contractility 2 hours after treatment, 1 day after treatment, as well as 1 day after washout (which is 2 days after the treatment was initiated). The active force measured at different times for each device are normalized to the corresponding pre-treatment force (n=10). Statistical significance tests were conducted using a paired one-tailed t-test to check if any potential increases are significant. There is a statistically significant drop in active contraction
1 day after washout of Cytod 0.3 M indicating at least partial reversibility of CytoD's effect,
partial because the force is still 50% greater than force prior to treatment (statistically significant).
Fig. 30 Comparison of the effect of CytoD for longer term (2hrs to 2 days) on muscle
contractility relative to the forces during muscle differentiation. In the case of CytoD 3kM and
DMSO, a 2 hour pulse was applied and then washed out to test the recovery and reversibility
days. Clearly, both the high dose (3 M) pulse of CytoD and the low dose continuoud treatment both led to sustainable improvement in active contraction beyond the DMSO pulse control and relative to the maximum force during differentiation (all fibers were normalized with respect to their respective peaks during days 2-12 of differentiation. The colored envelopes around each means curve (black, blue, green and red) represent 68% and 95% confidence intervals.
Fig. 31 Fluorescence intensity of CytoD EverFluor-TMR measured 2 hours after treatment and after washout. (A) a phase contrast image showing a typical 3D muscle fiber. (B) The first row of images contains the raw images used for quantification purposes in Fig. 32. The second row contains histogram normalized versions of images in the first row. The normalization with respect to the 2 day washout image in order to make the visibility of the muscle fiber clear, while still maintaining the relative intensity. Clearly there is a significant drop in intensity, almost imperceptible by 1 or 2 days after washout. Scalebar 300[im
Fig. 32 Fluorescence intensity of CytoD EverFluor-TMR measured 2 hours after treatment and
after washout. All the intensities were normalized between 0 and 1 with respect to the maximum average intensity measured as well as the minimum (throughout the experiment). The background intensity could vary from day to day, due to changes in environmental conditions as well as variations in the laser. So the intensity values corresponding to zero CytoD concentration are - 6*10-4 for both the pre-treatment and 2 hour cases. In the 2 hour image, the background is high because it contain CytoD-EverFluor. However, the intensity of the muscle fiber is even higher than that as it seems that CytoD reacts with f-actin and accumulates inside the muscle. 2 hours after treatment, the average intensity on the muscle fiber is -1000-fold larger than the pre-treatment background. One day 1 after washout, the muscle intensity drops to being 5-fold larger than background (-200-fold reduction) and on day 2, it drops to being 1.4-fold larger than background (i.e. a -700-fold reduction compared to the 2 hour peak)
Fig. 33: Diffusion of Cytochalasin D - Everfluor conjugate through a muscle fiber. (A) Confocal fluorescence timelapse images of the Cytochalasin D - Everfluor conjugate penetrating the 3D muscle tissue. Scale bar in images is 100im. (B) Quantification of the fluorescence intensity variation, with time. All intensities are normalized with respect to the same maximum 16-bit greyscale spectrum. Every line at any given time point represents the average intensity across the muscle fiber averaged over 30 cross sections along the length of the muscle.. 3 of the cross sections are shown in the first image in (A).
Fig. 34: Visualization of f-actin in mature and immature myotubes using Sir-Actin and confocal
timelapse microscopy reveals that sarcomeric f-actin in mature myotubes is not depolymerized by CytoD 0.3ptM. However, a small fraction of the non-sarcomeric f-actin is depolymerized with CytoD. For instance, in window 2: the arrows mark areas with f-actin clustering at T=30 and 150mins(dark rounded spots), which is typical when filamentous actin breakdown appears (also see Fig. 36B for more obvious clustering). Also shown using arrows in window2 (between T=60 and 90mins) as well as in window 3 (T= 90mins) is the sudden appearance of a lighter background, indicating the disappearance of the dark f-actin. Scalebar is 10pm.
Fig. 35: Visualization of f-actin (Sir-Actin) in mature sarcomeric myotubes with CytoD 0.3 IM
application using confocal timelapse microscopy reveals that while sarcomeric f-actin in mature myotubes are not depolymerized by CytoD 0.3pM, the non-sarcomeric non-specific f-actin (darker) around the periodic f-f-actin structures do get depolymerized. This is also illustrated in the intensity line plot showing that the periodic structures remain after 12 hours, while the overall intensity level comes down, due to depolymerization of some of the non-specific, non-periodic background f-actin. The scalebar is 10 m.
Fig. 36: Visualization of f-actin (Sir-Actin) in immature sarcomeric myotubes as well as
immature non-sarcomeric myotubes with CytoD 0.3[.M application using confocal timelapse microscopy reveals that (A) Even the period sarcomeric f-actin gets disrupted if the myotube organization is immature as seen in A with the imperfectly aligned developing sarcomeric structure. (B) Several f-actin filaments in the non-sarcomeric immature myotubes are severed. There is also a lot of f-actin clustering (all within 2 hours). Scalebar is 10pm.
Fig. 37: (A) Quantification of the non-sarcomeric stress-fiber like f-actin breakdown in
pre-sarcomeric immature myotubes shows that the distribution of linear f-actin filaments gets skewed towards shorter filaments with CytoD treatment (B) There seem to be many more stress-fiber like f-actin filaments with CytoD treatment. i.e. CytoD treatment converts a few long f-actin filaments into many more shorter filaments. (C) Quantification is performed by
manually counting stress-fiber like f-actin structures and measuring their length using the length tool of ImageJ software. An example of an stress-fiber like actin filament in shown with a red curly brace showing the extent of the filamentous. The beginning and ends were chosen (subjectively) based on the location where there appears to be a branching of the bundled stress-fiber like f-actin or a clear stop.
Fig. 38: Schematic of fluorescence recovery after photobleaching of GFP-tagged actin
monomers. Monomer recovery occurs first and is the most rapid (GFP-tagged monomers indicated by the green blobs and the background green used to doubly emphasize the location of unbleached GFP-tagged monomers). F-actin turnover driven recovery is slower than the diffusion of monomers (10X slower), and so can be considered to occur after monomer recovery is complete. This is schematically indicated by the grey (bleached) f-actin filaments acquiring some green blobs (unbleached monomers) from the barbed/polymerizing end of f-actin. Some of the bleached f-actin filaments recover much more slowly (10s of minutes) due to protective capping proteins. These are schematically shown to never recover (always grey after bleaching) in the timescale of the experiments conducted (2-3 minutes).
Fig. 39: A typical FRAP recovery curve and pictures from actual experiments. C2C12 myotubes
with GFP-actin monomers are bleached with a rectangular window covering the entire width of the cell throughout the entire depth. Scalebar is 10im. By plotting the intensity recover within the bleach window over time and by using the remaining image to compute the rate of photobleaching we obtain a corrected recovery curve, which has a rapid diffusion limited recovery in the -1s timescale followed by a slower turnover limited recovery.
Fig. 40: The first few seconds of the FRAP recovery curve, plotted based on 19 individual FRAP
driven purely by diffusion of monomers. We use this recovery profile to compute the timescale of diffusion and estimate the diffusion coefficient (shown in the inset).
Fig. 41: Relative change ratio of the fractions of the various actin compartments (actin monomer, dynamic f-actin and stable f-actin). The Y-axis represents the ratio of (Dynamic F-actin fraction after treatment)/(Dynamic F-F-actin fraction before treatment) etc for the various compartments (Dynamic, stable F-actin as well as Monomeric actin). The various treatment conditions (DMSO, CytoD) are shown in shades of green. The red dots represent the mean values. * p = 0.029 with a one-tailed unpaired 2-sample t-test with respect to the DMSO
controls. N=5 was used for DMSO and CytoD 3IiM conditions. N = 9 was used for the CytoD
0.3pM condition.
Fig. 42: Relative change ratio of the timescales of dynamic f-actin turnover with the various
treatments. Significance tests were 1-tailed t-tests. The turnover time change with CytoD 0.3 [M is barely statistically significant, while the change due to CytoD 3[IM is highly statistically significant relative to the DMSO treated controls. A one-tailed unpaired 2-sample t-test with respect to the DMSO controls. N=5 was used for DMSO and CytoD 3[tM conditions. N = 9 was used for the CytoD 0.3 [M condition.
Fig.43: Treatment with 100 [M SMIFH2, a small molecule inhibitor of formin homology domain 2 improves active skeletal muscle contractility within 2 hours of treatment. This is likely due to inhibition of the FH2 domain of formins which leads to disruption of formin associated f-actin filaments and/or inhibition of formation of such filaments as formin is an f-actin nucleator. At SMIFH2 doses of 20pM or lower, no improvement in contraction was observed. Statistical significance testing was performed with a one-tailed unpaired 2-sample t-test with respect to the DMSO controls.
Fig.44: Treatment with CK666 100[tM, an inhibitor of the Arp2/3 complex leads to a gradual decline of contractility. The data for the change in contraction 2 hours (not-significant) and 1 day (statistically significant) after treatment with CK666 100pM are shown. This makes it plausible that the branched Arp2/3 mediated f-actin filaments do help in sarcomeric force transmission. At SMIFH2 doses of 20p.M or lower, no statistically significant change in contraction was observed after 2 hours (shown) of contraction or after 1 day (not shown). Statistical significance testing was performed with a one-tailed unpaired 2-sample t-test with respect to the DMSO controls.
Fig. 45: Treatment with TR100, an anti-tropomyosin compound targeting the non-sarcomeric
tropomyosin isoform Tpm3.1 leads to a decline in muscle contractility 2 hours after treatment. Statistical significance testing was performed with a one-tailed unpaired 2-sample t-test with respect to the DMSO controls.
Fig. 46: Treatment with ATM3507, another anti-tropomyosin compound targeting the
non-sarcomeric tropomyosin isoform Tpm3.1 leads to a decline in muscle contractility 2 hours after treatment. Statistical significance testing was performed with a one-tailed unpaired 2-sample t-test with respect to the DMSO controls.
Fig. 47: Gene expression analysis using RT-PCR for 21 genes including housekeeping gene 18s
rRNA, with CytoD 0.3pM application for 2 hours. The relative expression levels are colored with a log2 scale (10-3 to 103). No significant changes in gene expression were found. There
were 3 samples used for both CytoD and the control (DMSO), labeled 1-3. A 2 sample t-test was used to obtain significance levels of the relative expression, with samples made in triplicate.
Fig. 48: AFM indentation of C2C12-based myotubes reveals a drop in mechanical stiffness. (A)
AFM approach retraction curve (red) with a curve-fit (green) to the approach curve. A Hertz model was fit to the data to compute the apparent elastic modulus. (B) CytoD treatment clearly lowers the apparent elastic modulus relative to DMSO treated controls (AFM) by 50%. N=30 cell indentations were used for this test.
Fig. 49: Micro-tensile testing of a muscle tissue. (A) The setup used for testing of the axial
stiffness of a muscle tissue. The typical muscle tissue used in this study is -100lm in diameter, 3mm in length anchored between two clamped kapton cantilevers (orange in color), one relatively compliant and the other relatively rigid (as described earlier in Chapter 2). The setup allows simultaneous measurement of the active contraction by observing the movement of the compliant cantilever (see the text in Sec. 4.2.2). Furthermore, the slidable rigid cantilever allows the muscle to be stretched and relaxed by 50 [tm steps, which also allows estimation of the axial stiffness. For a sense of scale, the circular tissue mount fixture is -6cm in diameter. The distance between the cantilevers in the fixture is 3mm. (B) The image processing pipeline used for stiffness computation. The first image represents the raw image of the initial position of the compliant cantilever edge. The second image represents difference image between the initial and final positions of the compliant cantilever as the rigid cantilever is moved to stretch the muscle tissue. The thickness of the bright rectangular zone is the displacement. An edge detection algorithm similar to the one described in Chapter 2 (see appendix 2) is used to detect the two edges of the bright strip. (C) Shows the cantilever position displacement (black), the cantilever displacement (red) and the normalized stiffness (blue).
Fig. 50: CytoD treatment leads to a simultaneous decrease in axial tissue stiffness and
improvement in active contraction as measured by the micro-tensile testing assay. The timescale of the 2 changes match each other well. (n=5) was used for this experiment.
Fig. 51: CytoD (0.3 M) treatment does not significantly change the baseline glucose
consumption rate of the differentiated C2C12 cells. A 1-tailed 2 sample t-test was used for statistical significance testing.
Fig. 52: CytoD treatment (0.3[tM or 3pM) for 2 hours does not significantly change the
phosphorylation of AKT at the 2 phosphorylation sites (Ser473 and Thr308). A) Western blots showing pAKT expression levels for both sites Ser473 and Thr308 along with AKT as a function of CytoD concentration.
P-tubulin
andp-actin
are also shown as loading controls B) Averaged results showing the ratio of phosphorylated AKT to total AKT. A 2-sample 1-tailed t-test was used for statistical significance t-testing (p > 0.05). N=3 for all experiments.Fig. 53: CytoD treatment (0.3ptM or 3[tM) does not significantly change cellular metabolic
activity as assessed by an MTT assay. See text for details about the time of exposure. A 2-sample 1-tailed t-test was used for statistical significance testing (p > 0.05). N=4 was used for these experiments.
Fig. 54: CytoD treatment does not significantly change mitochondrial activity as assessed by no significant changes in accumulation of TMRE a fluorescent dye that accumulates only in active mitochondria. A 2-sample 1-tailed t-test was used for statistical significance testing NS (p >
Fig. 55: Mechanical basis of active force improvement due to f-actin disruption in skeletal muscle.
Fig. 56: Jasplakinolide 5[iM treatment decreases active contractility of C2C12 based 3D engineered muscle by 25% within 2 hours of exposure and 33% within 24 hours of exposure. Statistical significance testing is based on the 1-tailed 2 sample t-test
Fig. 57: Phalloidin 100ptM treatment decreases active contractility of C2C12 based 3D engineered muscle by 25% within 24 hours of exposure. 2 hours after treatment, there was no significant change in contractility relative to DMSO treated controls. Statistical significance testing is based on the 1-tailed 2 sample t-test
Fig. 58: Biobot fabrication process involving 3D printed hydrogel molds, molding optogenetic skeletal muscle and assembly of the bio-hybrid structure.
Fig. 59: CytoD treatment increases the twitch length of a weak biobot and this improvement
also results in translation of the biobot (which was so weak prior to treatment that it didn't exhibit net translation upon optogenetic stimulation). The yellow lines are fixed and were overlaid on the timelapse for easier visualization of the translation.
j
Chapter 1: Introduction
1.1 Motivation
We live in historic times due to advances in modern medicine. The discovery of antibiotics and vaccines has eradicated many fatal infectious diseases and widespread access to the modern healthcare infrastructure is transforming our lives. A byproduct of this transformation is that we live longer today than ever before; we live in an aging world. The population of people aged 60+ is increasing each year, with an expected 100M+ Americans aged 60+ expected by 2050 (Fig. 0). The unfortunate side effect of this aging demographic is the increase in age-associated diseases and disorders. Such disorders include age-related neurological diseases such Alzheimer's and Parkinson's disease, age-related visual disorders such as macular degeneration and glaucoma and age-related muscle disorders such as Sarcopenia. 7D.74 65.50 50-54 45.49 40.44 35-39 30,4 2549 20-24 16-is 10-14 4-9 0-4
By 2050, People Age 65 and Older Will Equal 20% of the Population
U.S. Population land Forecast) by Age Category and Gender
1900 1960 2000 2025 2050
U.S. Poplation: 76 Million U.S. Population: 151 Million U.S. Poolatio: 281 Million Popu ation (forecas ) 340 Mi li tioPopuln eca t 392 Miflion
R maim HW
MiMins of Totel Popsaaon fo Each Genaiar
wean
eOSCeia asn M
*
Fesna RMaaNFig. 0: US population demographics aged 60+ (U.S. Bureau of the Census)
Sarcopenia is a skeletal muscular disorder characterized by decline in skeletal muscle mass and strength of muscle function. It is part of the so-called frailty syndrome, which is characterized by excessive decline in one's health worse than what is expected due to normal aging. Decline in muscle mass and strength leads to increased weakness and decreasing mobility for performing the same daily tasks. This leads the typical patient to exert themselves
less and less. Such lack of activity further worsens muscle function which worsens mobility even more. This vicious cycle of loss of muscle function in Sarcopenia is surprisingly common, thought to affect 1 in 4 people aged 65+.
1.2 Strategies to combat declining muscle function
Efforts combating declining muscle function could be characterized in to two types: pharmacological or non-pharmacological. Non-pharmacologically, exercise and resistance training have been shown to demonstrably improve muscle function 2-27. However, this doesn't
stop the vicious cycle of muscle loss without significant self-motivation. Pharmacologically, there have been several targeted attempts at improving muscle function. Muscle function is driven by muscle mass and muscle contractility per unit mass.
The vast majority of pharmacological strategies today target improvement of muscle mass (eg. see Fig. 1) .Examples include anabolic steroids that have been shown to increase muscle hypertrophy as well as formation of new muscle fibers partially through the activation of satellite cells. Landmark discoveries 28,29 about the role of the AKT/mTOR pathway in
increasing muscle hypertrophy has opened up a whole decade of research 28-47 dedicated to
understanding this mechanism.
Likewise, inhibiting myostatin 48-71 decreases protein breakdown and increases muscle
mass as a result (Fig. 1).. All the above modalities have received significant attention both from academia and commercial entities pursuing therapeutic programs based on them. However, there is a lack of pharmacological interventions directly targeting the improvement of muscle contractility. Intr
Muscle contractility per unit area is driven by the intrinsic strength of the muscle fibers as well as the effectiveness of neuro muscular coupling which may change the fraction of activated muscle fibers at any given time. Both of these targets have received relatively little attention from a pharmacological standpoint. In this study, we focus on the intrinsic strength of muscle fibers and explore strategies to improve this metric.
Fig.1. Cow with defective myostatin gene, as well as myostatin knockout mice displaying
increased muscle mass 72
1.3 Thesis direction and outline
Even decades after Huxley's Nobel prize winning discovery of acto-myosin sliding contraction73 ,74 in striated muscle, we still don't completely understand how the acto-myosin force transmits from the sarcomeres to perform external work. We hypothesize that the non-sarcomeric cytoskeleton (f-actin structures that are not part of the non-sarcomeric f-actin, intermediate filaments and microtubules) plays a significant role in muscle force transmission. This is plausible because these 3 cytoskeletal structures are the usual load bearing networks within cells.
Among these 3 structures, it is likely that the non-sarcomeric f-actin is especially important as a mechanical link that helps in force transmission because of the known f-actin binding sites on the Z-disk of the sarcomeres, on dystrophin and in the integrin complex7
5(Fig.
2A).Furthermore, the sarcomeric acto-myosin cytoskeleton follows an exquisite periodic structure that is intact even in the mechanically active environment of skeletal muscle. This leads to the hypothesis that there may be cytoskeletal structures (beyond the titin molecule that runs along each sarcomeric unit), that scaffold the sarcomeres holding them in place. If the non-sarcomeric f-actin is involved in either of these 2 roles (force transmission or non-sarcomeric scaffolding), it is likely that disrupting f-actin would be deleterious to muscle force transmission.
On the other hand, it is known that f-actin adds rigidity to cells. So the very presence of non-sarcomeric f-actin may impede contraction according to the Hill model of muscle contraction (Fig. 2B), due to the additional parallel resistance. Based on this purely biomechanical model, disrupting f-actin could improve contraction.
Non-sarcomericf-actin is useful A
B Non-sarcomericf-actin
is
a mechanical hindranceNon-Sarcomeric act n
Parallel resistance
F
+--+F
ISeries resistance Contractile element
Sarcomeric actin
Fig.2: The unclear role of the non-sarcomeric f-actin in skeletal muscle force transmission. (A) Figure from 7s. Protein binding studies have led to the hypothesis that f-actin links the sarcomeres to the costameres (which are the sites of connection of myotubes to extracellular
sites). If this f-actin link is critical, disrupting non-sarcomeric f-actin may negatively affect force transmission. (B) Alternatively the non-sarcomeric f-actin may make the cell more rigid
mechanically impeding contraction. In the Hill muscle model shown, the non-sarcomeric f-actin may contribute additional mechanical resistance to the parallel element, thereby mechanically posing an additional barrier to muscle contraction. In this case, disrupting the
So there are 2 alternate hypotheses for the role of the non-sarcomeric f-actin:
1. Disrupting non-sarcomeric f-actin is deleterious to muscle force transmission due to
interference with the ability of the sarcomere-generated force to be transmitted to external structures.
2. Disrupting non-sarcomeric f-actin enhances muscle force transmission since in normal muscle it acts to constrain contraction, acting against the muscle.
Surprisingly, to-date there is very little evidence that would conclusively support one hypothesis over another. The goal of this thesis is to elucidate the role of the non-sarcomeric f-actin to answer the question: Is the non-sarcomeric f-f-actin beneficial to contraction, or does it biomechanically impede contraction?
The thesis is organized as follows:
In Chapter 2, we develop an ex vivo murine skeletal muscle model and measure the contractile response of the tissue to actin disruption with Cytochalasin D. If the presence of f-actin helps force transmission, we expect the disruption of f-f-actin to have a significant deleterious effect on the muscle function. On the contrary, CytoD treatment of the explant reveals two distinct phenotypes, one of which shows a 2-fold improvement in muscle contractility, until the muscle stops contracting due to rigor mortis hours later. In order to verify if this phenotype of functional improvement due to actin disruption is a real biological phenomenon or merely artifactual, we need a more stable muscle model that doesn't undergo rigor mortis.
To overcome the shortcomings of the ex vivo model, we use an in vitro muscle model using optogenetically engineered skeletal myoblasts. This model doesn't undergo rigor mortis and is stable for days after peak differentiation, during which time we may perform detailed actin disruption experiments. Furthermore the optogenetic activation of muscle contraction helps decouple neuro-muscular coupling from the intrinsic muscle strength. With a 2D differentiated myotube model, we show that the active displacements of the myotubes improve almost 15-fold after actin disruption with CytoD. However, this apparent functional improvement could be due to weaker cell substrate adhesions that occur during actin disruption.
In order to rule out this possibility and to test if increased active displacements translate to increased active forces, we developed a 3D engineered mouse muscle in vitro model. This model has a muscle tissue cast on flexible supports and differentiated in situ. The displacement of the supports provides a measure of the active contractile force. Even the 3D engineered model shows a dramatic 2-fold improvement in contractile force with actin disruption with CytoD. Furthermore, we show that Latrunculin A treatment also leads to a similar level of improvement in contractility showing that f-actin disruption underlies the force improvement, not other non-specific pleiotropic effects of CytoD.
This counterintuitive functional improvement due to actin disruption led us to consider potential downsides of actin disruption. We tested if there are changes in apoptosis, cell death, mechanical integrity of the cell under an exercising stimulus, intracellular protein/organelle damage and fatigue resistance. The assays show almost no downside, with no detectable changes in apoptosis, cell death, autophagy or mechanical integrity with mild f-actin disruption. The only potential functional downside we have uncovered so far is a small decrease in fatigue resistance. This is indeed promising and very surprising that f-actin disruption, which is typically thought to have negative functional consequences, shows such a positive functional improvement in active force in skeletal muscle, with seemingly very few measured tradeoffs.
In Chapter 3, we perform experiments that pinpoint the dynamics of the cytoskeletal changes underlying the observed functional improvement. Using a dose response of the force to Cytochalasin D and the force recovery after washout, we hypothesize that both dynamic f-actin components as well as some of the stable f-actin must be disrupted. Longer term exposure to CytoD still seems beneficial at low doses, leading to the hypothesis that the sarcomeric f-actin must not be affected by CytoD.
To test these hypotheses, we performed live 3D confocal timelapse microscopy to visualize changes in f-actin structure using low doses (100nM) of a fluorogenic small molecule that binds to f-actin. These experiments reveal that Cytochalasin D disrupts the non-specific f-actin structures and long f-actin cables, while leaving the sarcomeric f-actin structures remain intact, agreeing with our earlier hypothesis. Presumably some of these well-defined f-actin cables do not recover soon after washout and this explains the irreversible improvement in contraction even after complete CytoD washout.
Furthermore, we also performed a fluorescence recovery after photobleaching (FRAP) assay to study f-actin dynamics in further detail. GFP-tagged actin monomers were transfected in to differentiated myotubes and a FRAP assay conducted. The FRAP assay revealed that the speed of actin turnover slows down with increasing doses of CytoD, implying that dynamic f-actin filaments that have fast turnover increasingly get disrupted with increasing doses of CytoD. This confirms our hypothesis that dynamic f-actin is getting disrupted.
To further narrow down the specific sub-compartments of f-actin that lead to functional improvement, we tested the changed in contractility with more specific actin inhibitors. As a result we found that disruption of formin mediated actin assembly also improves muscle contraction. The commonality between the CytoD treatment and formin inhibition is the disruption of several f-actin filaments leading to shorter filaments.. On the other hand, disrupting Arp2/3 mediated branched actin or f-actin filaments stabilized by tropomyosin seems to have a deleterious effect on muscle contraction, implying an essential functional role of these specific f-actin subtypes in sarcomeric force transmission.
In Chapter 4, we analyze the mechanistic underpinning of the force improvement. We test a mechanical hypothesis that the force improvement is due to a drop in internal mechanical resistance of the cell. To test the hypothesis, we performed experiments that capture changes in internal mechanical resistance (AFM, micro-tensile testing) as well as changes in the energetic activity of the cell. This is because, for the output contractility of a "motor" such as the muscle tissue to increase, either the input (energetic consumption) increases, energetic metabolism changes, or the efficiency of force transmission changes due to a lower internal resistance. We find that there is no significant change in energetic consumption (glucose), mitochondrial TCA cycle enzymatic activity (MTT) or mitochondrial activity (TMRE). There are no significant changes in a range of genes involved in energy metabolism as well as sarcomeric protein activity, pointing towards mechanical resistance changes as a likely candidate. Both the AFM and micro-tensile testing reveal a 50% drop in mechanical stiffness. This was to be expected as f-actin is known to have a structural role in most cells. It's just that in skeletal muscle, it seems to be over-expressed impeding its contraction. We also tested if f-actin stabilization which would potentially lead to increased internal resistances decreases force, and indeed it does. All of the above data point towards a mechanical effect that leads to functional improvement in skeletal muscle.
In Chapter 5, we explore practical applications of f-actin disruption and propose several
future studies. The preceding sections show that the twitch force improves with f-actin disruption. Here we discuss the practical significance of this. We explore a model of walking using a 3D printed biohybrid skeletal muscle powered robot and demonstrated significant improvement in the functional performance of the bio-bot due to f-actin disruption. Future studies could be directed towards 1) testing f-actin disruption in muscle disease models 2) developing drug delivery systems and 3) discovering better targets for f-actin disruption.
Chapter 2: Effect of f-actin disruption on skeletal muscle
function
2.1 Actin disruption in an ex vivo mouse muscle
2.1.2 Does f-actin disruption enhance muscle contraction ex vivo?
In this thesis, we primarily explore the role of the actin cytoskeleton on the functional output of skeletal muscle, namely active force transmission. As a model system, we start with an ex
vivo mouse muscle to study this. To re-iterate the two alternative theories discussed in the
previous chapter (Sec. 1.3), it is unclear if disrupting f-actin might improve skeletal muscle contraction (if f-actin mechanically impedes contraction) or worsen it (if f-actin has an essential function in skeletal muscle cells, perhaps in linking the sarcomeres to the ECM)? In this section, we experimentally measure the change in contraction due to f-actin disruption to test these two theories.
2.1.3 Experimental model
2.1.3.1 Tissue dissectionWe measure the change in muscle function in a mouse hindlimb extensor digitorum longus
(EDL) muscle explant model due to f-actin disruption using Cytochalasin D (CytoD). Our
rationale for choosing the EDL explant model is as follows:
The mouse EDL muscle explant model is an appropriate model for 3 reasons: 1) mouse hindlimb muscles have been used for several studies of human muscle disorders 76-83 2) mature muscle tissues such as this are more appropriate to test our hypothesis that dynamic f-actin may not be essential for mature skeletal muscle tissue function than using in vitro engineered muscle models which are still developing tissues 3) EDL muscles are structurally convenient to test this hypothesis. Being thinner than other muscle tissues (the tibialis anterior or soleus muscle tissues), we hypothesize that EDL tissues may be more viable after dissection than much thicker muscle tissues such as the tibialis anterior or soleus muscles. Furthermore, small molecule actin disrupters such as CytoD may diffuse through the EDL muscle tissue more completely in shorter timescales than thicker alternatives. Furthermore, it