A Discussion of the Development Process, Identification
of Design Requirements, and Implementation of
Improvements to a Point-of-Use Water Purifier in India
by
Sean T. Ricks
B.S. Mechanical Engineering
Brigham Young University, 2013
ARCHIVES
MASCHt; rn 1ST1,)TF MASsOF IHNLuY
JUL 3
0
2015
LIBRARIES
SUBMITTED TO THE DEPARTMENT OF MECHANICAL ENGINEERING IN
PARTIAL FULFILLMENT OF THE REQUIREMENTS FOR THE DEGREE OF
MASTER OF SCIENCE IN MECHANICAL ENGINEERING
AT THE
MASSACHUSETTS INSTITUTE OF TECHNOLOGY
June 2015
Massachusetts Institute of Technology 2015. All rights reserved.
Author...
Certified By...
Accepted By...
Signature redacted
Department of Mechanical Engineering
May_22, 2015
...
Signature redacted
A
S
Winter, V
Assistant Professor of Mechanical Engineering
Signatu
re redacted-
Thesis Supervisor
David E. Hardt
Professor of Mechanical Engineering
Chairman, Graduate Committee
A Discussion of the Development Process, Identification of
Design Requirements, and Implementation of Improvements to
a Point-of-Use Water Purifier in India
by
Sean T. Ricks
Submitted to the Department of Mechanical Engineering on May 22, 2015, in partial fulfillment of the
requirements for the degree of
Master of Science in Mechanical Engineering
ABSTRACT
Over 780 million people worldwide do not have access to clean drinking water. In India, one product that attempts to address this issue is the Tata Swach, a home purifier which makes water biologically safe to drink by neutralizing bacteria and viruses using silver nanoparticles. This thesis presents research which focuses on improving adoption of this life-saving technology. A holistic approach is followed which takes into consideration the product's technical performance as well as socioeconomic factors that may influence user acceptance. A mathematical model of flow through the purifier is developed and a design tool based on this model is created to allow the optimization of flow rate while maintaining purification efficacy. The development process used to design the Swach is analyzed and compared to literature to determine how this may have affected the product's ultimate success. The importance of incorporating the voice of the customer is emphasized. To that end, surveys among current Swach users are conducted and the responses are applied to Fishbein's Multi-Attribute Attitude Model to determine which design parameters are most important to the customer. "Quality of filtered water" and "ease of maintenance" are identified as the factors that most affect a user's overall satisfaction with the product. A technical issue that may affect these parameters - non-uniform flow through the purifier's porous medium - is identified and experimentally confirmed. Finally a design change to minimize the effects of non-uniform flow in the porous medium is suggested.
Thesis Supervisor: Amos G. Winter, V Title: Assistant Professor
ACKNOWLEDGEMENTS
I would like to first of all thank my family and friends who have supported me throughout this
program. Also, my advisor Amos for his direction and constant words of encouragement. Many colleagues have also contributed to progress in my research as well as my own professional development including all of my peers in the GEAR Lab, CITE, David Taylor, Chintan Vaishnav and Nevan Hanumara. Finally, Tata Chemicals, Ltd. for partnering in this research and the Tata Center for Technology and Design at MIT for funding this research.
CONTENTS
1
IN TRO D UCTIO N ... 11
1.1 PRIO R A RT IN W ATER PURIFIERS... 12
1.2 WHY WORK WITH THE SWACH?...13
2 MODELING FLOW THROUGH THE TATA SWACH ... 15
2.1 IN TROD U CTIO N ... 15 2.2 FILTER O PERATION ... 16 2.3 PAST W ORK ... 17 2.4 M A TH EM A TICAL M O D EL... 18 2.4.1 RH A Resistance ... 19 2.4.2 M ajor Losses ... 20 2.4.3 M inor Losses ... 22
2.4.4 Residence Tim e... 23
2.5 D ESIGN TO O L A N D O PTIM IZA TIO N ... 24
2.6 EXPERIM EN TA L VERIFICATIO N ... 26
2.7 CO N CLU SIO N ... 31
3 TH E D EVELOPM EN T S ... 33
3.1 IN TROD U CTIO N ... 33
3.3 TA TA CH EM ICA LS' PRO CESS... 38
3.4 D ISCU SSIO N ... 42
3.5 CO N CLU SIO N ... 43
4 ID EN TIFYIN G D ESIG N REQ U IREM EN TS... 45
4.1 IN TRO D U CTIO N ... 45
4.2 D A TA CO LLECTIO N PRO CED U RE...46
4.2.1 Survey A dm inistration... 46 4.2.2 Survey D escription...46 4.2.3 Survey Location...49 4.2.4 Identification of Participants ... 50 4.3 A N A LYSIS A N D RESU LTS...51 4.3.1 Choice of Proxies ... 51
4.3.2 Q uantifying the D ata... 52
4.3.3 Calculation of A ttribute Im portance... 54
4.3.4 A nalysis of Fit ... 55
4.4 D ISCU SSIO N ... 56
4.4.1 Significance of w eights... 56
4.4.2 Im proving Existing M odel... 58
4.4.4 Future W ork ... 59
4.5 CO N CLU SIO N ... 60
5 A PPLYIN G D ESIG N REQ U IREM EN TS ... 61
5.1 IN TRO D U CTIO N ... 61
5.2 LITERA TU RE REVIEW ... 62
5.3 PRELIM IN A RY EXPERIM EN TA TIO N ... 63
5.3.1 M ethodology ... 65
5.3.2 Results ... 66
5.3.3 D iscussion ... 66
5.4 FIN A L EXPERIM EN TA TIO N ... 67
5.4.1 Experim ental Setup ... 67
5.4.2 M ethodology ... 68 5.4.3 Results ... 69 5.4.4 D iscussion ... 72 5.4.5 Lim itations ... 75 5.5 SU G G ESTED D ESIGN CH A NG E ... 76 5.6 CO N CLU SIO N ... 77 6 CO N CLU SIO N ... 79 BIBLIO GRA PH Y ... 81
1 INTRODUCTION
Many millions of people around the world are affected by a lack of clean drinking water. According to the WHO/UNICEF JMP 2012 update, there are over 780 million people worldwide who do not have access to an improved drinking-water source [1]. This issue particularly affects the poor in developing countries and leads to many thousands of deaths each year due to water-borne illness [1].
Tata Chemicals Ltd. decided to address this problem by developing a point-of-use (POU) filtration system designed specifically for the Indian market. This product, the Tata Swach, provides bacteria- and virus-free water to households at an affordable price (approx. 25 USD).
Since its introduction to the Indian market in 2010, the Swach has achieved a limited degree of success and adoption. Many people are opting for other similar products from brands such as Kent, Unilever, Purelt, and Aquaguard. More importantly, a great number of people are still
choosing to use no purifier at all.
This thesis attempts to address issues that may affect adoption of this potentially life-saving technology from a product design and engineering perspective. By partnering with Tata Chemicals, an investigation is made into all aspects of the product from original development to design changes for future iterations that may increase user satisfaction. Special emphasis is given to the voice of the customer and understanding how technical performance affects user acceptance. In this way, rigorous engineering and physics is combined with socioeconomic considerations to form a holistic view of the product and implement design changes.
This thesis is organized more or less chronologically, in the order that research was performed. It is divided into six sections. The rest of this section provides some background on prior art in water purifiers and explains why research into improving the Tata Swach is a reasonable strategy for addressing India's clean water crisis. Section 2 gives a general description of the product and provides an understanding of the physics behind its operation. Specifically, a mathematical model is developed which allows designers to predict the purification rate based on the physical characteristics of the purifier. Section 3 compares Tata Chemicals' product development process to processes advocated in literature and suggests improvements to better capture the voice of the customer. Section 4 presents original research by the author to elucidate and rank the importance of design requirements through collecting feedback from Swach users. Specifically, factors which most dramatically affect user satisfaction with the product are identified. It is hoped that this knowledge can be used to improve customer perception of the product and increase adoption. In Section 5, the results of Section 4 are applied by solving a particular technical issue that the purifier is likely experiencing. Finally, Section 6 summarizes the outcomes of this research and gives concluding remarks.
1.1 PRIOR ART IN WATER PURIFIERS
In past decades, many devices and schemes designed to provide clean water to the developing world have been deployed with mixed success. This section will briefly present a few of these projects as well as some evaluations of purification technologies that are particularly relevant to the topic of this research.
Barstow, Dotson, and Linden describe the development of a point-of-use (POU), UV purification device for developing contexts which achieves sufficient purification at IL/min flow
rates. At $63 per unit, the cost is prohibitive and the device also requires consistent access to electricity [2]. Ngai et al. describe the development and deployment of an arsenic filter in Nepal and state that there is a barrier to increased adoption of the technology due to difficulties in scaling up [3]. Ogunyoku et al. describe the deployment of several types of POU purification methods in Uganda. They face similar difficulties to Ngai et al. when scaling up and they highlight the importance of understanding customer-imposed requirements of a purification method [4].
Regarding the relative merit of several technologies, Sobsey et al. evaluate the sustainability of 5 POU purification methods: chlorination, chlorination-coagulation, SODIS (solar disinfection), ceramic filtration, and biosand filtration. Based on their scoring of 5 elements of sustainability, they find biosand and ceramic filtration to be the most promising of the methods evaluated [5].
Much research has also been conducted to understand why the many technologies available for clean water have not been adopted at scale. Jalan et al. show that awareness among consumers of the importance of water hygiene is a barrier to demand for clean water in urban India [6]. Also, Sobsey et al. describe several other barriers including cost, the ability of the technology to provide a sufficient amount of clean water for daily use, efficacy at treating water of different qualities and from different sources, required input effort of the user, and reliability and affordability of supply chains for maintaining the technology [5].
1.2 WHY WORK WITH THE SWACH?
Though many solutions have been proposed, it seems clear that there has not yet been a great breakthrough of the type desired by the development community, and further work developing clean water technologies and understanding barriers to adoption is required. This thesis attempts
to contribute to this effort by understanding issues surrounding the Tata Swach and seeking ways to improve it.
Working with an established multinational corporation to improve an existing product holds certain benefits over developing a new purification technology and business from scratch. For one thing, Tata Chemicals has a well-developed supply chain and distribution channels as well as access to large amounts of capital. This will aid in the immediate deployment at scale of any improvements made to the purification technology.
The Tata Swach as a product is a good candidate for this type of partnership. The prior art in Section 1.1 show that common barriers to adoption include requiring access to electricity, difficulty in use, inability to provide sufficient amounts of purified water, and prohibitive prices. The Swach does not require electricity, is simple to use, provides enough purified water on a single cycle for a family of four for an entire day, and is the cheapest product among its competitors.
Considering this very reasonable baseline, improving this product to increase its adoption among consumers seems like a reasonable strategy for contributing to the effort to solve India's clean water crisis.
2 MODELING FLOW THROUGH THE TATA SWACH1
2.1 INTRODUCTION
One of the first steps taken in this research was developing a deeper understand of the physics that affect the filter's operation. Out of a desire to get the product to market as quickly as possible, Tata Chemicals designed the filter using an iterative approach, without mathematically modelling the flow characteristics. Components were prototyped and tested until an acceptable level of performance was reached. Now that there is a desire to optimize the product, it is necessary to understand the physical phenomena behind the filter's operation. This will allow designers at Tata Chemicals to improve the filter's performance, including increasing the rate at which it purifies water. A mathematical understanding of the filter's operation was also instrumental in the other research presented in this thesis including solving the issue of non-uniform flow in the porous medium (Section 5).
This section outlines the development of a mathematical model and design tool that can be used to optimize flow rate in the Tata Swach. A description of the filter's basic operation and key features is provided. The theory behind the mathematical model is also explained. A design tool is presented which allows filter designers to input certain physical parameters and predict the resulting flow rate through the filter. This design tool will be used to show that flow rate can be increased by 50% by making minimal changes to the design. Parameters for achieving the optimized flow rate are specified. Experimental results, which confirm the conclusions of the
This section comes from a paper by Ricks et. al. [31] and contains text authored by Ricks, Lewandowski, and Lim.
design tool, are presented. Finally, the broader implications of this research are provided, and recommendations for future development are given.
2.2 FILTER OPERATION
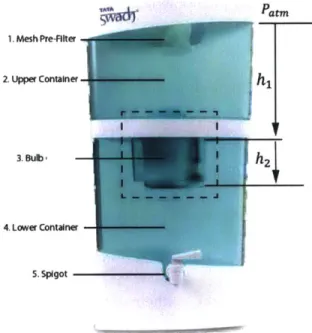
The Swach operates without electricity or access to a running water source. As shown in Figure 2.1, dirty water is poured into the upper container through a mesh pre-filter. The static water creates a pressure head, which drives the water through the filter element, or bulb, where the purification takes place. Once it has passed through the bulb, the water is stored in the lower
container until used by the consumer.
"Sk A atm 1. Mesh Pre-Fiter 2. Upper Container h 3. Bulb h 4. Lower Container 5. Spigot
Figure 2.1. Basic Conponents of the Tata Swach water
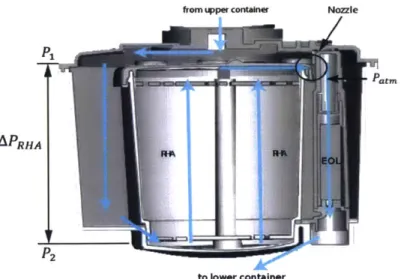
Figure 2.2 shows the path that water takes as it passes through the bulb. First it enters the outer body of the bulb and flows to the bottom where it begins to filter up through the inner body. The inner body contains compacted rice husk ash (RHA), which has been infused with silver nanoparticles. As the water passes through the RHA, silver ions are released into the water, neutralizing viruses and bacteria. This process is time sensitive (i.e. the longer the water is in
contact with the silver nanoparticles, the more ions will be released and the more microbes will be destroyed). For this reason residence time, defined as the amount of time the water spends within the RHA, is an important design parameter. After passing through the RHA, the water passes through a small nozzle (referred to as the flow-restricting nozzle) and enters the
end-of-life (EOL) mechanism. The EOL has a water-soluble tablet that is designed to dissolve completely after 3 m3(3000 L), allowing a spring to close a valve and stop flow through the bulb. This is meant
to provide a cue to the consumer that the effective life of the bulb is spent and the bulb requires replacement. After exiting the EOL, the water passes through a mesh post filter, which traps any RHA particles that escape from the bulb. Once through the post filter, the water enters the lower container and filtration is complete.
from upper contairw Nozzle
atM
to lower container
Figure 1.2. Tata Swach bulb and critical flow components.
2.3 PAST WORK
In order to ensure that the filter achieves a 6-log reduction of bacteria and a 4-log reduction of viruses (meeting or exceeding US-EPA standards), Tata Chemicals conducted extensive tests
on their prototypes [7]. Given a certain amount of RHA in a prototype, an acceptable flow rate was determined experimentally without respect to residence time. The flow rate was controlled
by the size of the orifice in the flow-restricting nozzle and successively lower flow rates were
tested until the desired purification was achieved. The current design of the bulb yields a maximum flow rate of 1.67E-6 m3/s (6 L/hr) when the upper container is full and the pressure head is at its greatest. By developing a physical understanding of how each element within the filter affects the flow rate and residence time, an optimized flow rate can be achieved while ensuring the same level of purification.
2.4 MATHEMATICAL MODEL
Flow through the bulb is analogous to current in an electrical circuit as shown in Eqs. (2.1) and (2.2). In an electrical circuit, current is equivalent to a potential difference divided by an electrical resistance; in a fluid circuit, flow rate is equivalent to a pressure difference divided by
a flow resistance.
I =V R (2.1)
Q
= (2.2)The total pressure difference of the system is created by the hydraulic head above the bulb and is given by the hydrostatic equation:
AP = P, - Patm = pgh1 (2.3)
where P is the pressure at location 1 (refer to Figure 2.2). The pressure just after the flow-restricting nozzle (inside the EOL) is atmospheric because vents in the side of the mesh post filter and the fact that the EOL never fills with water (flow is slow enough that water simply drips through the EOL) allow atmospheric air to reach the top of the EOL. In order to simplify
calculations, hi is measured to the top of the bulb rather than the bottom (i.e. h2 is neglected). The hydrostatic contribution of h2 is compensated for by the fact that elevation gain through the RHA is also neglected.
There are several resistances that contribute to the total resistance of the system: the resistance of the RHA, major losses, and minor losses.
2.4.1 RHA Resistance
The resistance of the RHA can be determined from Darcy's Law for flow through a porous medium:
Q
= kAAPRHA (2.4)ptL
where k is the permeability of the RHA, A is the cross-sectional area of the RHA, APRHA represents the change in pressure across the porous medium, p is the viscosity of the water, and L is the length of RHA. Note that this form of Darcy's Law assumes flow driven by pressure only (i.e. the elevation gain through the RHA is neglected). Comparing this equation with Eq. (2.2), it can be seen that the effective resistance of the RHA is given by
RRHA =A (2.5)
Because k is dependent on factors such as grain size and particle arrangement, which are difficult to determine, its value was chosen based on experimental results [8]. Several experiments were conducted (Section 2.6) during which flow rate and pressure were measured. With all other variables known, k was back-calculated to fit the data.
Note also that there are two mesh screens on either side of the RHA that prevent the medium from dispersing with the water. Since it was impossible to isolate these screens from the RHA
without disrupting the RHA and therefore changing its permeability, it was determined to lump the resistance of these screens into the value of k. In other words, the RHA and the mesh screens were treated as one resistor with an experimentally determined permeability.
2.4.2 Major Losses
Major and minor losses are pressure drops across elements due to viscous effects [9]. These viscous effects create flow resistances that, for the sake of simplicity, we will refer to as major and minor loss resistances.
Major losses are given by the Darcy-Weisbach equation:
AP = 2DH (2.6)
where
f
is the Darcy friction factor and is given byf = R (2.7)
L is the length of the element in the flow direction, v is the velocity of water through the element
and is given by
V (2.8)
DH is the hydraulic diameter and is given by
DH = 4A (2.9)
ReD is the Reynolds number and is given by
ReD = PVDH (10)
A is the area perpendicular to the direction of flow, and Pe, is the wetted perimeter of the element.
Substituting Eqs. (2.7), (2.8), and (2.10) into Eq. (2.6) yields
From Eqs. (2.2) and (2.11), it can be shown that the effective resistance associated with major
losses, RM, is given by
32 Lp(.2
RM = (2.12)
DH
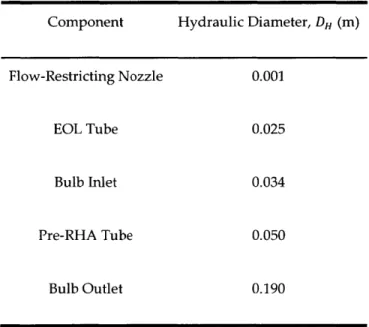
Since A c DH, RM cc DH4. Therefore, as DH becomes large, the major loss resistance quickly
becomes negligible. Table 2.1 shows the hydraulic diameter (or similar characteristic length) of several cross-sections within the system. Because the hydraulic diameter of the flow-restricting nozzle is much smaller than the hydraulic diameter anywhere else in the system (by at least an order of magnitude), major loss resistances can be neglected everywhere except in the flow-restricting nozzle.
Table 2.1. Hydraulic diameter of various components in system.
Component Hydraulic Diameter, DH (i)
Flow-Restricting Nozzle 0.001
EOL Tube 0.025
Bulb Inlet 0.034
Pre-RHA Tube 0.050
Bulb Outlet 0.190
Also, since Eq. (2.7) is only valid for laminar flow, care was taken to ensure that the Reynolds number did not exceed 2300 in the nozzle. For a flow rate of 1.67E-6 m3
/s (6 L/hr), the Reynolds
number in the nozzle was found to be 1870 (note that the nozzle has a square cross-section of edge length .001 m).
An assumption was made that flow in the nozzle is fully developed. This is unlikely to be true since the nozzle length is only .005 m. However, it was determined that since the major loss over the nozzle is the smallest of the losses considered to be significant, any error associated with this
assumption would be small when applied to the entire system.
2.4.3 Minor Losses
Minor losses are given by
AP = KLPV2 (2.13)
2
where KL is the minor loss coefficient and can be obtained from tabulated data. Substituting Eq.
(2.8) yields
AP = KLPQ2 (2.14)
2A2
Comparing with Eq. (2.2) gives the minor loss resistance as
Rm KLPQ (2.15)
For the situation of contraction of the fluid into the nozzle, KL = 0.48 and A is the area inside the nozzle [9]. Again, because the resistance is dependent on A2, minor losses in other parts of the
bulb can be neglected by the order of magnitude argument. Note that there is no corresponding resistance associated with expansion of the fluid after the nozzle. This is because flow stops after the nozzle and water simply drips through the EOL.
The only significant resistances in the system, then, are the resistance of the RHA, major loss resistance through the flow-restricting nozzle, and minor loss resistance due to contraction of the fluid into the nozzle. Because the fluid must pass through each of these resistances, they can be treated as resistors in series and summed to give a total resistance of the system. Thus,
Rtot = RRHA + RM + Rm (2.16)
Finally, for any chosen nozzle geometry and RHA configuration (assuming permeability is held constant), Eq. (2.1) can be used to predict flow rate:
Q
= Apt"t Rtot (2.17)Note that since Rm is dependent on
Q,
Eq. (2.17) is implicit and must be solved using numericalmethods.
2.4.4 Residence Time
The residence time is the amount of time the water spends inside the RHA and in contact with the purifying agent (silver nanoparticles). This is given by
V
T = (2.18)
L
where v is the velocity of water through the RHA and L is the length of the RHA in the flow direction. Substituting Eq. (2.8) yields
=. -Q- (2.19)
VRHA
where VRHA is the total volume of the rice husk ash. Because flow velocity may not be uniform throughout the cross section (see Section 5), this residence time must be considered an average rather than the residence time of a specific fluid element. It was assumed that as long as two prototypes had equivalent residence times, the purification level achieved by each would also be equivalent. Therefore, any increase in flow rate must correspond with an appropriate increase in
VRHA-2.5 DESIGN TOOL AND OPTIMIZATION
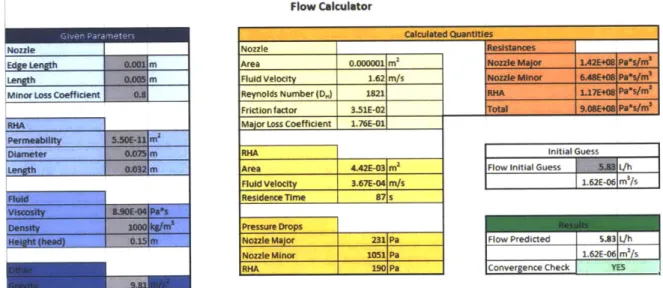
The equations described in the previous section were used to create a design tool in Microsoft Excel. This tool allows designers to input the physical parameters of the bulb (nozzle dimensions, RHA properties, and fluid properties) and predict the resulting flow rate through the bulb. Resistances are calculated using Eqs. (2.5), (2.12), and (2.15), and Eq. (2.17) is used to give the flow rate for a given pressure head. Because Rm is dependent on the flow rate, an initial guess for Q is required, and the solver is used to ensure that the initial guess and the predicted value of Q converge to the same value. The residence time is also calculated so that designers can ensure that minimum purification requirements are met. Figure 2.3 shows a screen shot of the design tool.
Flow Calculator
Nozzle Nozzle
Edge Len Area 0.000001 m2
L Fluid Velocity 1.62 m/s
Minor Loss Coeffijcent Reynolds Number (D,) 1821
I Fristinn f*r nr 431F-02
RHA
Area 4.42E-03 m
Fluid Velocity 3.67E-04 m/s
Residence Time 87 s prawn Drops Nozzle Major 231 Pa NozzleMinor 1051 Pa RHA 10 Pa Initial Guess Flow Initial Guess L/h
I1.62E-061ml/s
Flow Predicted 5.3 L/h 1.62E-06 m /s
Convergence Check YES
Figure 2.3. The Excel design tool allows designers to input parameters for filter geometry and see what the resultant flow rate for the purifier will be. Gray boxes may be edited by the user.
1.76E-011
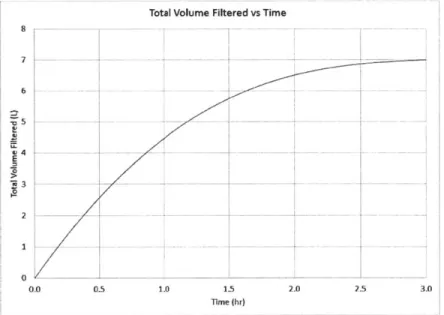
This provides a snapshot of the flow at a single moment in time. In order to see how the flow behaves with respect to time, the dynamic pressure head must be taken into account (i.e. as water is filtered and passes to the other side of the bulb, the pressure driving the flow is reduced). To accomplish this, the calculated values are used as initial conditions for a step-wise solution where the resistances and flow rate are recalculated every five seconds. Automatically-generated figures based on these data allow designers to see how the filter will operate for an entire filtration cycle. Figure 2.4 shows an example of these figures. The design tool thus provides a convenient method for designers to virtually prototype various bulb configurations and observe performance without developing expensive physical models.
Total Volume Filtered vs Time
7
0
0.0 0.5 1.0 1.5 2.0 2.5 3.0
Time (hr)
Figure 2.4. Automatically generated graph which shows the step-wise solution of volume filtered vs. time.
Once the design tool was complete, it was used to optimize the configuration of the Tata Swach bulb. The goal of the optimization problem was to reach a maximum flow rate with the constraints that the residence time could be no shorter than in the original bulb (to preserve efficacy) and the plastic body of the bulb could not be significantly altered (to preserve
manufacturability and cost). Measurements of bulb dimensions showed that the current length of the RHA is 32 mm, and there is approximately 16 mm of empty space between the top of the RHA and the bottom of the nozzle. The RHA length, therefore, could be increased by 50% without changing the plastic body of the bulb. This means that the flow rate could also be increased by
50% while maintaining the current minimum residence time. With this objective in mind, the
design tool was used to determine the nozzle parameters that would achieve the desired flow rate. It was determined that a nozzle orifice size of 4 mm would result in a new flow rate of
2.51E-6 m3/s (9 L/hr), a 50% increase from the current flow rate of 1.67E-6 m3
/s (6 L/hr). Note that these
flow rates are the maximum flow rate achieved when the upper container of the system is completely full. This was considered to be an optimized flow rate as it is the maximum allowable flow rate that can be achieved in the current embodiment of the bulb without altering residence time (efficacy) or manufacturability and cost associated with the plastic container.
2.6 EXPERIMENTAL VERIFICATION
Equation (2.19) shows that in order to increase volumetric flow rate through the bulb by a certain factor without changing residence time, the length of the RHA filtration element must be increased by the same factor (area held constant). This was the basis upon which a prototype was created.
The stock Swach bulb was first studied by measuring its total volume output at uniform time intervals, given 15 cm of initial pressure head, ho, as measured in the upper container (refer to Figure 2.1). The same method was used to generate similar data for other Swach bulbs that were modified from the original. A prototype bulb was made by removing the flow-restricting nozzle (making it a 4.0 mm wide square hole), and adding RHA material to the inner bulb to increase its
length by 50% (corresponding to a 50% increase in volumetric flow rate as per the logic above). Bulbs with different nozzle dimensions (1.3, 2.0, 8.0 mm side lengths) were fabricated by modifying nozzles of existing bulbs, and were tested in the same fashion as before. These experiments were performed to compare the original bulb with the prototype that was designed using the flow model described above, to demonstrate the sensitivity of volumetric flow rate to nozzle size when the nozzle is small (<2.0 mm), and to demonstrate the significance of the nozzle resistance for large nozzle dimensions.
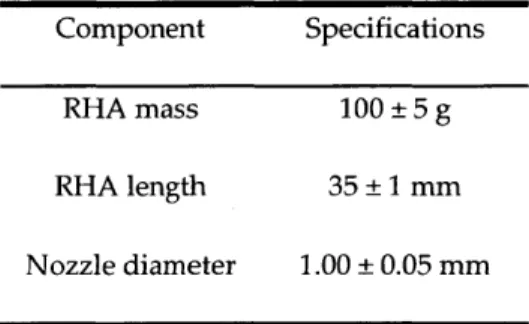
The manufacturing specifications and variation of the Swach bulb were measured for 5 samples and are shown in Table 2.2. Variation of measurement between these samples were used in the mathematical model to account for manufacturing error.
Table 2.2. Manufacturing specifications of RHA and nozzle.
Component Specifications RHA mass 100 5 g
RHA length 35 1 mm
Nozzle diameter 1.00 0.05 mm
The permeability of the RHA was found by fitting the mathematical model to 4 experimental data sets with different nozzle and RHA dimensions (Table 2.3), but with the same RHA medium. This was found to be approximately 5.5E-1 M2
. The strong consistency between experiment and
theory for all four data sets suggests the suitability of this model to the flow characteristics in the Swach bulb.
Table 2.3. Nozzle and RHA dimensions for experimental tests.
Test RHA Length, Nozzle Hydraulic
LRHA (mm) Diameter, DH (mm)
1 32 1.15
2 50 4
3 32 4
4 32 8
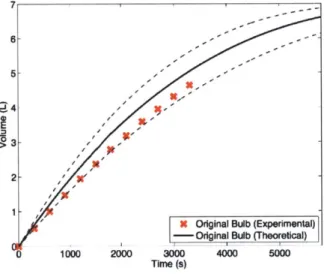
The mathematical model was found to agree with experimental results for a stock Swach bulb (Figure 2.5) as well as a prototype bulb (Figure 2.6). Both the variation in nozzle size and RHA length due to manufacturing error have been accounted for in the theoretical model (the error bars in the graphs represent the model with minimum and maximum observed dimensions).
7
6-5
0X
X Original Bulb (Experimental)
-- Odiginal Bulb (Theoretical)
1000 :206 3M0 406 5000 lime (a)
Figure 2.5. Theoretical flow model of original bulb with error bars and experimental validation.
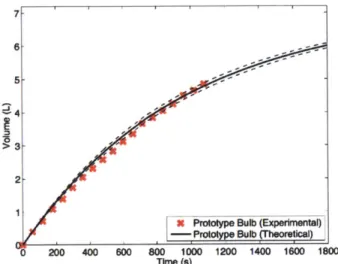
A 50% increase in the maximum volumetric flow rate from the original bulb was achieved in
the prototype bulb (Figure 2.6). Here, the flow restricting nozzle piece was removed to create a 4.0 mm square hole, which effectively removed this resistance. In order to maintain residence
time, the RHA length was increased by 50% by adding 18 mm of RHA length to the original 35 mm. 7- 6- 5-
2-S Protype Bulb (Experimenta) -Proty Bulb tical
200 400 600 SWo 1000 1200 1400 1600 18W0
Time (s)
Figure 2.6. Theoretical flow model of prototype bulb with error bars and experimental validation.
Error bars are more pronounced for the stock bulbs (Figure 2.5) because changes in nozzle size when the nozzle is small led to magnified changes in flow rate. The sensitivity in flow rate to nozzle size was demonstrated experimentally in Figure 2.7, which displays tests performed for bulbs with nozzles of 1.3 mm and 2.0 mm side lengths. Flow rate in the mathematical model was shown to be very sensitive to nozzle size below a 2.0 mm dimension due to the dominance of the nozzle resistance in the electrical circuit analogy, which was consistent with experimental results. On the other hand, the model shows that above certain nozzle dimensions (> 4.0 mm side lengths), the flow rate through the bulb is no longer sensitive. This was experimentally confirmed
by testing bulbs with the same RHA length but with 4.0 mm and 8.0 mm sized nozzles (Figure
2.8). In this size range the nozzle resistance is negligible, so any changes in size and therefore
1.6 1.4 1.2 1 90.8 0.6 0.4 0.2-. 2.0 mm Square Nozzle X 1.0 mm Square Nozzle 0.05 0.1 0.15 0.2 0.25 0.3 0.35 0.4 Time (h)
Figure 2.7. High sensitivihj of the flow rate to nozzle size when the nozzle is small (<2.0 mm).
7 -1 6 5N .2 S3-2 1 -XN 4.0 mm Square Nozzle X 8.0 mm Square Nozzle 0.05 0.1 0.15 0.2 0.25 Time (h)
Figure 2.8. Nozzle resistance is negligible when the nozzle is large (>4.0 mm).
Let R1 and R2 represent two flow resistances, where R2 is a flow-restricting nozzle (Figure
2.9). If R2 >> R1 (e.g. where R2 is a very small nozzle), then the system is very sensitive to R2.
Figure 2.7 demonstrates this sensitivity when the flow-restricting nozzle is <2.0 mm. On the other hand, if R2 is reduced and R2 K R1, then changes in R2 will not affect the flow. Figure 2.8
demonstrates the low sensitivity of flow rate to nozzle size when the flow restricting nozzle is > 4.0 mm.
RR
AP
Q
-Figure 2.9. A depiction of resistances in the Swach bulb, where R2 represents aflow-restricting nozzle.
The flow model was shown to closely track flow data from experiments performed using the Tata Swach. Its use as a design tool additionally describes sensitivities that Tata can now account for. It demonstrates that Tata may increase flow rate by increasing nozzle size while increasing RHA length. The existing dimensions of the Swach bulb allow this to be done without any drastic
changes to geometry. At the same time, if nozzle sizes were increased beyond 4.0 mm, Tata may
not need to improve manufacturing tolerances due to the reduced sensitivity of flow rate to
nozzle size in this regime.
2.7 CONCLUSION
The impact of this work is manifold. First, by developing a mathematical model of the flow, the effects of certain features on filter performance are elucidated. For example, it is now apparent that flow rate is highly sensitive to the size of the orifice in the flow-restricting nozzle. The model shows that RM and Rm are proportional to DH4. This means that very small changes in orifice size
can result in drastically different flow rates. The importance of tolerances is quantified and failure points are highlighted, allowing Tata Chemicals Ltd. to develop a more robust system.
Also, the design tool allows Tata Chemicals to create prototypes virtually before creating them physically. Concepts with poor performance can be ruled out before expensive building and testing occurs. This will reduce new product development times and costs.
The optimization methodology demonstrated here can be applied to other similar systems. Individuals or organizations interested in water purification or hydraulic systems can use a similar approach to characterize flow and optimize system performance.
Future work should focus on determining an accurate value for the permeability of the RHA. This should be left to Tata Chemicals as the value of k will be highly dependent on their standard packing and assembly procedure. At that point, it may also be useful to separate the effects of the two mesh screens from the permeability of the RHA. Finally, consideration of resistances that were neglected in this work may lead to greater accuracy, though researchers should bear in mind the relative magnitude of errors associated with each assumption as well as the ultimate purpose of the model in order to determine if such work is worthwhile.
3 THE DEVELOPMENT PROCESS
3.1 INTRODUCTION
The success of a product is strongly linked to the effectiveness of the process used to create it. For that reason, much research effort was dedicated to understanding the process that Tata Chemicals used to develop the Swach and how that ultimately affected its success in the market. In this section, an extensive review is given on literature about product design and development processes. Tata Chemicals' process is then described and compared to the literature. Finally, a discussion of potential improvements to their process is provided. As it is the foundation of Section 4, particular emphasis is given to the front end of the development process and identifying design requirements.
3.2 LITERATURE REVIEW
Product design and development has been a topic of academic and industry research for decades. Thousands of published and peer-reviewed works exist in the form of journal articles, conference papers, case studies, special-interest books, and texts. These publications teach various design methods and strategies for bringing products to market, a process which usually begins with understanding customer needs and translating them into design requirements. In their book, Product Design and Development, Ulrich and Eppinger approach product development from the perspectives of marketing, engineering design, and manufacturing, and provide a toolkit of product development methods that can be utilized by practitioners on development projects [10]. Specifically, the process of establishing design requirements is separated into two
parts: (1) identifying customer needs and (2) establishing product specifications. The five-step process for identifying customer needs involves:
1. Gathering raw data from consumers
2. Interpreting the raw data in terms of customer needs
3. Ordering the needs into a hierarchy of primary, secondary, and sometimes tertiary
needs
4. Establishing the relative importance of the needs
5. Reflecting on the results of the process
Methods for gathering raw data include conducting interviews and focus groups and observing the product in use. Once customer needs are identified, they are translated into the more technical and quantifiable language of product specifications. This multi-step process involves setting target specifications, benchmarking, and using technical and cost models to refine the specifications. Identifying customer needs and establishing product specifications are typically among the very first activities in Ulrich and Eppinger's development process. These ideas, however, are often revisited later in the process when new feedback from customers is received during the concept evaluation stage, and product specifications can be adjusted if necessary.
Pahl and Beitz also provide a text with general guidance on the design process [11]. The subject of identifying design requirements is treated in the section titled "Task Clarification" which describes a process of establishing a requirements list and using that list to direct later design activities. Similar to the hierarchy of needs discussed by Ulrich and Eppinger, requirements are classified as either demands or wishes. Tradeoffs or concessions that often must
be made later in the project are governed by this classification. Little guidance is given on how to actually identify these requirements beyond suggesting a review of the documents provided by the customer with the design task (assuming the customer is involved in commissioning the project) and a series of introspective questions that the designer must ask himself regarding the use scenarios of the product. Attention instead is given to creating a useful documentation of the requirements that can be both binding and able to grow as new information becomes available.
Another well-established text on product design and development is provided by Otto and Wood [12]. The methodology for determining design requirements here is similar to that presented by Ulrich and Eppinger. It involves gathering customer needs through a variety of activities and then sorting and ranking those needs. Methods for gathering customer needs include interviews, questionnaires, focus groups, and "being the customer", an activity where design teams travel to the location where the product will be used and use a competitor's product to get firsthand experience. Methods for ranking the needs can be simple, such as counting the number of times a need is mentioned in customer interviews, or more complex, such as performing a conjoint analysis, a method where several needs are ranked together in order to account for interdependencies. Detail is also given on the different types of needs that can be uncovered including direct needs, latent needs, constant needs, variable needs, general needs, and niche needs.
In addition to the texts providing general product development principles, there are many papers emerging in recent decades that aim to customize the process of identifying customer needs when designing in the developing world. In their review of over 200 academic publications on product development research, Krishnan and Ulrich state that product development
methodologies are "highly contingent on the market uncertainty and other environmental characteristics [13]." They conclude that "insights on customizing product development practices to diverse environments...should also help increase the relevance and applicability of the
development literature."
Donaldson corroborates this opinion in her review of design practices in Kenya when she states, "It may not be appropriate to promote 'MIE-style' [more industrialized economy] design to LIEs [less industrialized economies] [14]." Citing Bucciarelli, Minneman and Leifer, Rittel and Smaili, she says that because design is viewed as "a social process" that is intermediately linked with culture, it is reasonable to believe that different cultures would have different design processes which are most effective for them [15][16][17][18]. Donaldson does not suggest what the appropriate design process should be for a less industrialized economy. Rather, her paper accounts the processes that were observed to be in use by large and small firms in Kenya without evaluating their efficacy. Notably, she states that "tarmac bias," a condition where product designers give preferential attention to consumers in urban areas, often neglecting the needs of potential consumers in rural areas, is a common issue in LIEs. She also says that prototyping, a tool often used in product development to receive feedback from consumers on design requirements, is seen by many firms in Kenya as "extravagance" and a waste of precious resources.
A similar paper by Vechakul and Agogino describes the product development practices used
by two developing world design organizations: IDEO.org and the International Development
methods used; it simply compares the practices of each organization and leaves the reader to determine which practices are more or less appropriate for a given design scenario.
The Human-Centered Design (HCD) Toolkit, a publication by IDEO.org, gives a specific
methodology for designing products for emerging markets [20]. This resource divides the design process into 3 stages: (1) Hear, (2) Create, and (3) Deliver. It advocates close interaction with users throughout the process because consumers in emerging markets are assumed to have lifestyles and needs that are very distinct from those of the foreign designers that are often leading the product development process. Rather than relying on the intuition that designers bring to the project, methods are suggested which help the designers to develop empathy for users and give the users opportunities to directly contribute to the establishment of design requirements. In the Hear section of the toolkit, specific methods are given for elucidating customer needs. Some of these methods, such as interviewing and conducting focus groups, are the same as those discussed earlier in the general design texts. Other methods, however, are unique to this toolkit and may be especially suited to designing in emerging markets. Self-documentation, a method where potential users are given cameras or journals and asked to document their daily activities for a period of time, is used to help designers develop empathy and understand the possible use contexts of the products they are making. The Create stage also discusses the use of prototypes to elicit early feedback on the accuracy of design requirements. Throughout the HCD process, the necessity of immersion in the use context is emphasized.
The idea of immersion in the use context is also advocated in the book Reverse Innovation by Vijay Govindarajan [211. This book discusses how to customize the product development process to emerging markets from an operations management perspective. Govindarajan says that
multinationals designing for emerging markets should establish Local Growth Teams (LGTs), business units that live and operate in the country for which the product is being developed. He argues that it is impossible to correctly establish design requirements without gaining a deep understanding of the lives of the target consumers - an understanding which can only be gained
by living in proximity to them. This idea of immersion could be compared to the "being the
customer" exercise mentioned before by Otto and Wood [121, though unlike "being the customer", an activity which may be done in an afternoon, the kind of immersion and empathy development advocated by Govindarajan and the HCD Toolkit may require weeks, months, or even years.
3.3 TATA CHEMICALS' PROCESS
Through interviews with Tata Chemicals' engineers and business heads, a basic understanding of the process that they followed in developing the Swach was reached. This project was initiated when Ratan Tata, chairman of the Tata Group, announced a goal of providing clean water for the masses of underserved people in India somewhere around the end of 2009. Engineers at Tata Chemicals, in collaboration with other Tata subsidiaries, began brainstorming ideas for a purifier that could be both extremely affordable and effective at removing biological contaminants. In this early stage of the process, there was little interaction with customers. Instead of performing need-finding activities such as those suggested in much of the literature, design requirements were established primarily internally. In a process most similar to that described by Pahl and Beitz [11], engineers and marketing specialists established a list of requirements and ranked their importance primarily based on instruction that they were given in the design brief from upper management and their own intuition.
Once a design direction was established, engineers and industrial designers began making a series a prototypes and testing them internally, a process which culminated in the creation of a "green bulb" prototype which is similar to the current Swach filter element but does not include the upper and lower containers for storing water. Instead, the intention of the "green bulb" prototype was that it would be attached directly to clay matkas (traditional vessels for storing water) in the consumer's home which would serve the same purpose as the plastic containers seen in the current version of the product.
With this prototype complete, Tata Chemicals began seeking feedback from potential consumers. A pilot study was performed where the "green bulb" prototype was placed in approximately 300 homes for a month. Though it is unclear, it is likely that this pilot study occurred only in Mumbai (Tata Chemicals' HQ) among an urban population. After that, representatives from Tata Chemicals gathered feedback on what consumers liked and disliked about the product. A key outcome from this study was an understanding that the prototype may have missed the mark in several areas. First, consumers indicated that they were not interested in an ultra-cheap, "jugaad2
" solution, but favored instead a more polished and complete product, even if it required a bigger price tag. They also learned that consumers were not satisfied with the level of purification that the prototype achieved which required Tata Chemicals to begin researching ways to improve the purification technology.
Armed with the knowledge gained during this pilot study, engineers at Tata Chemicals again began brainstorming ideas and creating prototypes. From this point on, most decisions were
2 Jugaad is a term commonly used in India to refer to a solution which is improvised or "hacked together."
made internally, and interaction with the consumer was very limited. Their prototyping and testing process eventually led to the creation of the product which was launched in April 2010.
Somewhere along this process, they also decided to shift focus away from creating an immediate clean water solution for the masses (meaning rural India) and instead focused on serving urban communities which were more accessible and where distribution channels were more established. The move made strategic sense for Tata Chemicals, and the hope was that after gaining a foothold in urban centers, the technology would percolate outwards toward the masses in rural areas.
Ratan Tata declares goal of developing clean water system "for the masses" Use of RHA as purification medium developed by professor in-house placements (300) conducted with green bulb in rural/urban (unclear) households. Lasts -8
mos. with monthly feedback
A
Key Outcomes:
* "Only bulb" solution is undesirable.
Customers want "full solution"
* Use of own container
is complicated (user) and could be unsafe (TCL)
* 98% purification is
not acceptable
Oct. 2010 (Swach Smart)
April, 2010Product is launched A
Within 9 mos. of
launch, TCL decides to focus on urban target
A
Portfolio is expanded to include other
products
-A1 p p pp
Used to aid tsunami victims
Series of prototypes headed up by Tata Chemicals, ending with
"green bulb" 7 Innovation center brought on board to develop silver nanotechnology (reach
new purification goal) "
l
Tata Chemicals continues development of full solution. Partners: - Design Directions (industrial Design) * Titan (Machinery) * TACO (Plastics) * TBSSTTSL (Customer support) - Innovation center (Technology) Market feedback gathered continuallyAfter the initial in-home placements, most iteration and concept evaluation occurred just among the team (i.e. cocreation with the consumer was over). This is according to WUmg Dave but should
be verified if deemed important.
'3
t6)
3.4 DISCUSSION
Information regarding the development process for the Tata Swach was collected several years after-the-fact and often from second-hand accounts. It is possible that this is not the most accurate representation of how events unfolded. That being said, if this is assumed to be an accurate representation of their development process for the Swach, there are several areas of improvement that can be discussed.
The most critical component missing from this development strategy is an ongoing connection with the consumer throughout the entire process. Though some feedback from consumers was obtained through the pilot study with the "green bulb" prototype, design requirements should have been identified and verified even earlier through activities such as observation, interviews, and surveys. Relying on one's own intuition at the beginning of the development process can lead to biases that persist even when new information from the consumer becomes available. This may especially be the case with the Swach considering a fully functional prototype was created before interaction with the consumer began. This represents a considerable investment of time and effort that may effectually lock designers into an incorrect design trajectory.
Also, assuming one group's opinions and priorities align with those of another group is always risky in product development. This is why design literature advocates interacting directly with the end-user to establish design requirements rather than relying on one's own understanding of what is important in a product. This may be especially true when a designer is making a product for consumers from a different cultural background. The disparity in beliefs and priorities between the designer and the consumer in this case may be particularly
pronounced, and failing to get direct feedback from the consumer may cause the designer to miss the mark in a big way. Even though they are from the same country or even the same state in India, it would be a mistake for designers at Tata Chemicals to assume that their priorities for a water purifier align with those of others from a different social or economic class. Also, it may be a mistake to assume that a product which meets the needs of consumers in urban areas of India will also be acceptable to the rural masses and will be able to make that transition. All of this advocates the necessity of Tata Chemicals to do more need-finding throughout the development process and among different demographics.
3.5 CONCLUSION
This section has discussed product design and development processes in a conventional context as well as newer research on Design for the Developing World. The strategies advocated
by literature have been compared to the process Tata Chemicals used when developing the
Swach. While Tata Chemicals did many things right and were able to get a product to market very quickly, there is potentially room for improvement in the area of understanding the voice of the customer and establishing design requirements. The following section will describe work that the author did to rank design requirements according to what users of the Swach consider most important in a water purifier.
4 IDENTIFYING DESIGN REQUIREMENTS
4.1 INTRODUCTION
As emphasized in the last section, one of the key challenges of any consumer product development process is understanding design requirements imposed by the consumer. In order to create products which will meet user needs and be acceptable to the consumer, designers must understand which attributes of a product are valued by the consumer. When trade-offs need to be made during a development process, it is vital to know how changing each parameter of a product will affect its acceptability to the consumer.
To aid in this task, researchers have proposed a variety of models to represent how consumers evaluate products and make decisions. One of the earliest and most widely known models is Fishbein's Multi-Attribute Attitude Model which states that a person's overall attitude toward an object is the sum of his or her belief concerning each salient attribute of the object weighted by the importance of that attribute [22]. Represented mathematically, this is:
A o= EN=1 bje (4.1)
where A, is the overall attitude toward the object, bi is the strength of the belief that the object has attribute i, ei is the importance of attribute i, and N is the number of salient attributes. In prior research, Fishbein's model has been applied to consumer products and used as a means of anticipating consumer brand preference [23]. In this section, Fishbein's model will be applied to consumer preferences surrounding the Tata Swach. Data on consumers' beliefs concerning 10 salient attributes of the purifier and a measure of their overall attitude toward the product will be used to back-calculate the relative importance of each attribute. Understanding the relative
importance of each attribute will aid designers as they make future iterations of the product and attempt to improve overall acceptability to the consumer.
4.2 DATA COLLECTION PROCEDURE
4.2.1 Survey Administration
Data for this study were collected through the verbal administration of surveys by the researcher and a local translator in the homes of current Tata Swach users in India. The surveys were conducted in the language that the respondent was most comfortable speaking. Translators were local students or young professionals who were native speakers of the regional languages. They were trained by the researcher in the purposes of the study and coached in the manner in which questions should be asked in order to ensure consistency and minimize bias. Each interview was supervised by the lead researcher to ensure quality.
4.2.2 Survey Description
Each survey contained approximately 65 questions (the use of some questions was dependent on responses to previous questions) and required about 25 minutes to complete, though some interviews lasted as long as 40 minutes depending on the level of detail provided by respondents. Questions were primarily short answer and multiple choice and covered topics from basic water-use habits to product-specific feedback to demographics. The 11 questions pertinent to this analysis are shown in Table 4.1.
All of these questions were asked with respect to the Tata Swach which respondents were
currently using (or had been using in the recent past) in their homes. The survey was administered to a total of 39 participants, though only 35 participants provided answers to all 11 of these questions and could therefore be included in this study.
Question
Table 4.1. Survey questions
Options Provided
1. How would you rate the quality (1) Very Bad, (2) Bad, (3) Adequate, (4) Good, (5) Very Good of your filtered water?
My water filter:
2. Filters water quickly.
3. Has a good storage unit size.
4. Is easy to maintain.
5. Is easy to get parts for.
6. Replacement parts are
affordable.
7. Is durable/does not break.
8. Improves my water's taste.
9. Improves my water's color.
10. Improves my water's smell.
11. How would you rate the
product as a whole?
(1) Agree, (2) Disagree, (3) No Opinion
(1) Agree, (2) Disagree, (3) No Opinion
(1) Agree, (2) Disagree, (3) No Opinion
(1) Agree, (2) Disagree, (3) No Opinion
(1) Agree, (2) Disagree, (3) No Opinion
(1) Agree, (2) Disagree, (3) No Opinion
(1) Agree, (2) Disagree, (3) No Opinion
(1) Agree, (2) Disagree, (3) No Opinion
(1) Agree, (2) Disagree, (3) No Opinion
Score out of 5
As will be described in Section 4.3, each of the questions 1 through 10 describes a particular attribute which will be considered salient to determining the respondent's overall attitude towards the product. The inclusion of these particular attributes and the exclusion of others is the result of a couple of factors. First, an exploratory study was performed by the researcher in the
months preceding this study with the aim of identifying salient attributes. In the exploratory study, four individuals of Indian origin who were living in the Boston, Massachusetts, USA area were given a Tata Swach to use in their homes for a week. The researcher met with each participant at the beginning of the study to observe as he or she attempted to assemble the product and use it for the first time without guidance and again at the end of the study to interview the participant about his or her background and experience with the product. Each of these interviews lasted approximately 40 minutes and was very open-ended, asking participants to describe the product and comment on any problems they may have had with it throughout the week. The interviews were recorded, transcribed, and analyzed qualitatively to find attributes which the participants considered important. Second, a portion of this current study was performed in partnership with the Comprehensive Initiative on Technology Evaluation (CITE) at the Massachusetts Institute of Technology (MIT). CITE researchers prepared a survey to evaluate filter use in India, and upon comparison with results from the exploratory study, this researcher found that most emergent themes in the qualitative data were covered in CITE's survey. In the end, this researcher determined to move forward with a slight variation of CITE's survey in order to facilitate information sharing across studies. Each of the questions from Table 4.1 are found in CITE's survey.
Open-ended questions included in the survey such as "What do you like/dislike about the filter?" yielded rich qualitative data that will likely lead to the identification of other salient attributes in the future. Analysis of these data could not be included in this study, however, because they are not consistent across respondents (e.g. though many commented on the portability of the product, it cannot be analyzed in a meaningfully quantitative way because it