by
LEONID KEYSER
B.S. Operations Research and Industrial Engineering Cornell University
1998
Submitted to the MIT Sloan School of Management in partial fulfillment of the requirements for the degree of
MASTER OF BUSINESS ADMINISTRATION at the
MASSACHUSETTS INSTITUTE OF TECHNOLOGY June 2005
© 2005 Leonid Keyser All rights reserved The author hereby grants to
paper and electronic
MIT permission to reproduce and to redistribute publicly
copies of this thesis document in whole or in part.
imo-nhfilr nf Aithnr (
U--r ,EU- ... . I r...V. -\ _ I \
MIT Sloan School of Management
(AmN May 8, 2005
Certified by:
Jonathan W. Lewellen
Jon D. Gruber Associate Professor of Finance Thesis Advisor
Accepted by:
Margaret Andrews Executive Director of the MBA Program
'MASSACHUSEiS -T IN 1
OF TECHNOLOGY
SEP 012005
LI FRIE
DOES SPECIALIZATION IN SECURITY ANALYSIS AND PORTFOLIO MANAGEMENT EXPLAIN DEVIATIONS FROM THE CAPM?
by
LEONID KEYSER
Submitted to the MIT Sloan School of Management on May 8, 2005 in partial fulfillment of the requirements for the degree of
MASTER OF BUSINESS ADMINISTRATION ABSTRACT
The Capital Asset Pricing Model (CAPM), which relates the risk of an individual security
to its expected return, is frequently cited in investments textbooks and the academic
literature as a centerpiece of modem finance theory. The main prediction of the CAPM is that investors are compensated in the form of expected return only for bearing systematic or market risk, which is the portion of a security's risk that cannot be diversified away. That investors demand reparation for and only for systematic risk is a consequence from the pivotal assumption that all investors have identical information for the entire universe of publicly traded securities. In actuality, professional active money managers rarely invest in a portfolio broad enough to be considered the market portfolio. Instead, the asset management industry has self-organized over time according to a top-down investment process, where asset allocators provide capital to security selectors who
specialize in high-yield bonds, large-cap value stocks, and the like. Any losses in
diversification benefits resulting from this theoretically suboptimal two-phase investment strategy are deemed an unavoidable cost of obtaining accurate forecasts through specialization in security analysis and portfolio management. This research paper extends the ideas of the CAPM to formulate an equilibrium security pricing model that attempts to account for the top-down approach followed by investors in the real-world. Thesis Advisor: Jonathan W. Lewellen
OUTLINE
1.
Introduction
2.
The
2.1 2.2 2.3 2.4 2.53.
The
3.1 3.2Capital Asset Pricing Model
7
Mean-Variance Portfolio Analysis
7
Separation Theorem
9
Derivation 11
Alternative Derivation
16
Anomalies
22
Top-down Capital Asset Pricing Model
Generalization
26
Proposed Model
27
4.
Empirical Analysis
30
4.1 Data and Methodology
4.2 Results 33
5.
Conclusions
6.
Figures
30
34
37
7.
References
5
26
44
1.
Introduction
The Capital Asset Pricing Model (CAPM), which relates the risk of an individual security to its expected return, is frequently cited in investments textbooks and the academic literature as the centerpiece of modem finance theory. The widely known CAPM equation
i = rf + AM( M -
rf)
where
iM
E2
enables finance practitioners and researchers to estimate the fair expected return for any security based on a handful of readily computable parameters. In the equation, Pi is the expected return on security i, r is the risk-free interest rate, iM is the covariance of
the security with the market portfolio M, crM is the variance of the market portfolio, and
fM is the expected return on the market portfolio. Both the origin and the interpretation
of the CAPM are discussed in detail in Sections 2 and 3.
The main prediction of the CAPM is that investors are compensated in the form of expected return only for bearing systematic or market risk, which is the portion of a security's or portfolio's risk that cannot be diversified away. The systematic risk of security i is measured by the parameter /,i and is called the security's beta. Thus, the CAPM asserts that high-beta securities will on average outperform low-beta securities.
Why do investors demand reparation for and only for systematic risk? The main conclusion of the CAPM derives not from some law of nature or rule enforced by securities exchanges, but from the pivotal assumption that all investors have identical information for the entire universe of publicly traded financial assets, which leads naturally to the deduction that all investors hold the market portfolio.
When the objective is to optimize portfolio reward and risk, a security's value is determined by (1) its expected return and (2) its diversification properties as reflected by its average covariance with other securities in the investable universe. A security's
covariance iM with the market portfolio is roughly equivalent to its average covariance with all publicly traded securities. Hence, when the investable universe consists of all publicly traded securities, as assumed by the CAPM, then cri or alternatively iM drives the value of security i.
But what if investors do not optimize over the entire market? For example, what if fixed-income investors optimize over the universe of fixed-income securities and equity investors optimize over the universe of equity securities? In this case, fixed-income investors would value securities based on their covariance with other fixed-income securities, and similarly for equity investors. In general, the key point to recognize is that investors will judge securities according to their market risk only when their investable universe is the whole market. If investors' universes are smaller, more homogeneous collections, then they will require compensation for exposures to risk factors other than market or economy-wide risk.
In Section 3, we propose an equilibrium security pricing model based on the CAPM which attempts to reflect the reality that investors usually optimize over universes substantially smaller than the entire market due to specialization in security analysis and portfolio management. Given this world of security selectors who optimize within specialized asset classes and asset allocators who optimize across the asset classes, we argue that flim is no longer the relevant risk measure for security i. Instead, the price of security i in asset class g will be driven by the product figM MPiW , where Mg is the
value-weighted portfolio of all securities in asset class g.
If the proposed top-down CAPM is an improved representation of the true investment process followed by market participants, then MMflPiM should hold-up
better to empirical scrutiny than Pim. In Section 4, we perform a simple empirical
analysis to investigate whether PiM has stronger explanatory power than iM for
average stock returns within a specialized universe g of equity securities.
The empirical study presented is primarily for illustrative purposes and cannot be considered comprehensive. Nevertheless, the findings support neither the top-down CAPM nor the CAPM. In the empirical analysis, we essentially rank stocks within a
particular asset class according to their betas (either liM or fliM ) and compare the average return on high-beta stocks to that of low-beta stocks. We find that in some asset classes high-beta stocks outperform low-beta stocks, while in other asset classes the opposite is true, although none of the performance figures are statistically significant. This result is disappointing but may simply reflect the inadequacy of the econometric methods used rather than the inadequacy of either model. In Section 5, we offer a range of concluding remarks and suggest directions for future research with an emphasis on empirical validation.
2.
The Capital Asset Pricing Model
2.1
Mean-Variance Portfolio Analysis
Through his seminal journal article Portfolio Selection, Markowitz (1952) laid the foundation for modem investment theory. Markowitz suggested that risk and reward should be measured by the standard deviation of return o and the expected return , argued that rational investors prefer safety to uncertainty, explained the mechanics behind the popular maxim "don't put all your eggs in one basket," and introduced the mathematics of optimal portfolio construction using quadratic programming.
Many of the insights developed by Markowitz can be effectively captured in a mean-standard deviation or u - or diagram, as shown in Figure 2.1. Assume an investor with wealth W is considering the merits of N securities, where each security i = 1,..., N has uncertain future rate of return ri. We denote (1) the expected value of r as i; (2) the variance of as ii or ri2, with corresponding standard deviation r; (3) the covariance of r with r,i as Cri; (4) the wealth invested in security i to form portfolio
P as W , where W =W; and (5) the fraction of security i in portfolio P as
wi = W, /W, where " Nwi = 1. Markowitz showed that the return on portfolio P is
N
rp wrI, (2.1)
i=1
the expected return on portfolio P is given by
N
eP = y wep,, (2.2)
i=1
and the variance of the return on portfolio P is given by
N N
p=
'ww,
(2.3)
i=l j=l
with corresponding standard deviation ap. If we fix the values of /,, a', and ai,
substitute every possible weight vector w = (w, ..., WN) into (2.2) and (2.3), and plot
the resulting (p, p) pairs in the a -u plane, we generate the feasible region illustrated in Figure 2.1.
The figure shows three portfolios, A, B, and C, lying on or within a bullet-shaped curve. A is preferable to C because A =cc while A > C . Similarly, B is
preferable to C because cB < Cr while /B = AC. We cannot conclude unambiguously,
however, whether A is preferable to B, or vice versa. Appropriately, this notion of comparing portfolios strictly according to their means and variances is termed mean-variance (MV) portfolio analysis.
The highlighted upper boundary shown in Figure 2.1 is called the efficient frontier because it contains portfolios, such as A and B, that represent the highest attainable u for a given level of a and the lowest attainable cr for a given level of pu. Markowitz proposed that each investor should choose an efficient portfolio according to his risk tolerance by solving the optimization problem
12 1 NN min 2 - X=2 wwjwcr' Wi 2 i=1 j= N s.t. Pp =XWi =P (2.4) i=1 N EWi= 1, i=1
where u is an idiosyncratic reward target. Thus, solving (2.4) with u = UA leads to the optimal efficient portfolio A, while solving (2.4) with t =PB, leads to the more conservative optimal efficient portfolio B.
We have been and will continue to be rather casual in our notation for the parameters pu, C2, and ir that describe the joint probability distribution of the returns
ri. In most contexts, however, it would be more accurate and suggestive to denote the
means, variances, and covariances as ik, ,2 , and Sak, where the A character symbolizes
forecasting or estimation and the k subscript symbolizes investor k =1,..., K. This notation emphasizes that different market participants face different portfolio selection problems because they generally diverge in their abilities and mandates to analyze the myriad publicly traded financial assets.
2.2
Separation Theorem
Tobin (1958) conceptually simplified and extended Markowitz's MV portfolio analysis by noting that investors have access not only to risky securities such as stocks and bonds, but also to (essentially) risk-free securities such as U.S. Treasury bills. Specifically, suppose an individual invests a proportion a < 1 of his wealth W in the risk-free security F with rate of return rf and the remaining fraction 1-a in some portfolio P of the risky securities i =1,..., N with parameters pi, e2, and r . The mean and variance of the total portfolio T are given by
IT =arf +(1-a) pp and (2.5) =
ar2
+
(1
-
a)2c2
+
2c(1-a)rFp
= (1-
a)2rp,
(2.6)
where (2.6) follows from the fact that e2 =0 and FP=0. Also, from (2.6) we
immediately have
err = ( -a) rp (2.7)
Since T and ST are linear functions of a, the points representing portfolio T
illustrated by the dashed line in Figure 2.2. When a = 1, a = 0 and u = r ; and when
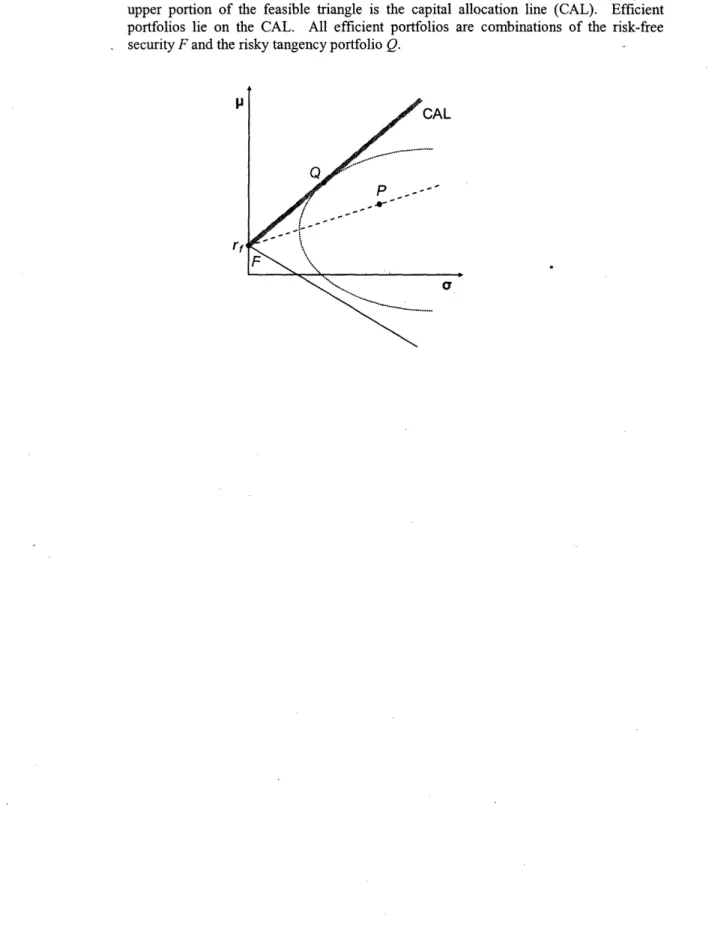
a = 0, cr = op and u = ,up. Of course, P signifies any possible risky portfolio, so the open triangular region in the figure depicts the new feasible set.
Portfolios along the highlighted upper boundary of the feasible triangle, called the capital allocation line (CAL), are clearly as good as or better than portfolios along the efficient frontier. From the figure, the CAL is tangent to the efficient frontier at risky portfolio Q, and therefore the super-efficient portfolios that lie on the CAL are weighted
combinations of Q and F. Thus, the Markowitz-Tobin (MT) portfolio selection problem consists of two logically separate steps, which has spawned the term separation theorem. First, the individual determines the weights WeQ that correspond to the risky
tangency portfolio Q. Second, the individual slides along the CAL to the desired level of
risk by apportioning a fraction a of his wealth W to the risk-free security F.
Referring again to Figure 2.2; the tangency portfolio Q is found by increasing the
slope of the CAL as much as possible while remaining within the bullet-shaped feasible region. Mathematically, Q is determined by solving the optimization problem
max Sp- -rl
Wi P
N (2.8)
s.t. -w, =1,
i1
where pp is specified by (2.2) and au is specified by (2.3). Once the weights wiQ are
established, the individual can ascertain his total portfolio T by choosing a according to his risk tolerance. For example, a might be determined by specifying some risk target
a, in which case a = 1- a/crQ by (2.7).
Interestingly, MT portfolio analysis suggests that a particular investment advisor
should recommend the same risky portfolio to each and every client he serves. This is
true because neither the risk-free return rf nor the advisor's forecasts for ul, ci2, and
Caj change from client to client, and therefore only the capital allocation a between the
risk-free security and the risky tangency portfolio should be tailored to personal
2.3
Derivation
MT portfolio analysis is a prescriptive or normative economic theory for making prudent investment decisions. In contrast, the CAPM, which was originally developed by Sharpe (1964), is a positive economic theory that seeks to predict or explain why investors are willing to pay higher prices for some securities relative to others. Put differently, MT portfolio analysis attempts to answer the question, "How should an individual divide his wealth among a given set of investment opportunities?", whereas the CAPM attempts to answer the question, "How are security prices formed in capital markets?"
Underlying the CAPM are two seemingly straightforward yet decidedly clever assumptions. First, Sharpe supposed that all individuals do indeed invest according to MT portfolio theory. In the CAPM world, all market participants are risk averse, do judge portfolios strictly by their means and variances, do have unlimited access to risk-free lending and borrowing, and do, in summary, exhibit all characteristics implied by optimization problem (2.8), which builds on optimization problem (2.4). Second, Sharpe supposed that all market participants have identical or homogeneous estimates of ui, Ci,
and oi. for the entire universe of publicly traded financial assets.
Organizing the CAPM assumptions, as we have done above, according to (1) the
decision model and (2) the implementation model provides a convenient logical
framework for evaluating the CAPM predictions and formulating CAPM extensions. In Section 2.4, we present an alternative CAPM derivation that closely follows and exploits this inherent two-assumption structure. Here, we present a more traditional CAPM derivation of the type found in most investments textbooks and the academic literature.
The typical CAPM exposition begins by listing the basic assumptions in no particular order. First, all investors are Markowitz MV portfolio optimizers. Second, all investors have the same forecasts for / i, /i2, and o . for all publicly traded securities.
Third, all investors have unrestricted access to the same risk-free interest rate rf. Lastly, there are no taxes, transaction costs, or other market frictions.
Taken together, these assumptions imply that all market participants will invest in the same risky tangency portfolio Q with corresponding weights WiQ. The simple logic behind this conclusion is as follows. The first, third, and fourth assumptions imply that all investors will employ MT portfolio analysis and therefore optimization problem (2.8) to select their risky portfolios. The second assumption implies that all investors will utilize identical input lists when solving the optimization problem. Of course, if all investors use the same decision model with the same parameter values, they must all arrive at the same answer.
Upon further reflection, we reach the significantly stronger conclusion that the risky portfolio Q held by all investors must be the market portfolio M defined as the value-weighted portfolio of all publicly traded financial assets. To justify this important deduction, we need to show that (1) the weight wF m of the risk-free security F in
portfolio M is zero and that (2) the weight wM of security i in portfolio M equals the weight wiQ of security i in portfolio Q.
Recall that, according to MT portfolio analysis, each investor k will allocate some proportion ak of his wealth Wk to the risk-free security F and the remaining fraction
I-ak to the risky portfolio
Q,
where ak > 0 corresponds to lending and ak < 0corresponds to borrowing.
Over the whole economy, every dollar lent is also a dollar borrowed and subsequently invested in portfolio Q. Consequently, the aggregate investment in security F and the aggregate investment in portfolio Q are given by
K
ArkWk = 0 and (2.9)
>(1-
ak)Wk
=Wk-LakWk =Wk =W,
(2.10)
k=l k= k=l k=l
where W denotes the wealth of the economy.
Further, the market value VF of security F equals the aggregate investment in security F, which is zero by (2.9). To understand why, consider a simple economy with three investors, A, B, and C. Suppose A lends $100 to B. If C forms portfolio F by
purchasing both the $100 bond from A and the $100 obligation from B, then the market value of F is clearly zero. Naturally, if VF = 0, then the weight wF of security F in
portfolio M is also zero.
Slightly less obviously, the market value Vi of security i is likewise equal to the aggregate investment in security i. To illustrate the potential confusion, we consider again a simple economy. Suppose stock X has two shares outstanding. If A buys the first share for $1 and B subsequently buys the second share for $2, then the market value of X is $4 even though the aggregate investment is only $3. In order to avoid this kind of discrepancy, the CAPM assumes that all investors pay the same equilibrium price pi for security i.
Having established that investment and value are equivalent, we can write the market value Vi of risky security i as
K V = (-ak)W Wk k=l K = W ,e (C ak) k=l = wiQ W (2.11) N = WiQ V i=1 = WiQ V,
where the third equality follows from (2.10) and V = IN V is the value of the market portfolio M. Since w, is defined as V/V, we conclude immediately from (2.11) that
WiM = WiQ
Figure 2.3 updates Figure 2.2 to incorporate the CAPM results that we have
developed thus far. The CAL is replaced by the capital market line (CML) to underscore
that M has been substituted for Q and that all market participants face the same investment problem. Algebraically, the CML is given by
PM - r
=r +A roa. (2.12)
While (2.12) relates the risk of an efficient portfolio to its expected return, the widely known CAPM risk-expected return relationship, which we will now derive, associates the risk of an individual security with its expected return. Suppose portfolio
Z is formed by allocating some weight 8 < 1 to the risky security i and the remaining
weight 1- 8 to the market portfolio M. Then,
H/z = 8/i+ (1 -8)M and (2.13)
a2
= 2.2 +(1 _)2 r + 2(1 -8)i
.(2.14)
Since oz is apparently a smooth, nonlinear function of 8, the points representing
portfolio Z trace-out a curvilinear path in the a-,u plane as 8 varies from 1 to 0 and beyond, as illustrated in Figure 2.3. When 8 = 1, Z is equivalent to security i; when 8 = 0, Z is equivalent to portfolio M; and when 8 < 0, which corresponds to shorting security i, Z lies on the portion of the curve to the right of M.
As indicated in the figure, the curve must be tangent to the CML as passes
through 0. Otherwise, the curve would break through the CML at the point M, which contradicts the definition of the CML as the upper boundary of the feasible region. Mathematically, the tangency condition between the curve and the CML is given by
d/z
=M - rf
(2.15)
dorz =o0 aM
To find the derivative in (2.15), we first calculate d/z /d8 and daz /dS. From (2.13)
we have dpz d--8 =/Hi -/M . (2.16) From (2.14) we have
dar2
da
d8 d o d dz 1 dcz d8 2az d5 and thereforeda-z
=,o
-
C,0-
)+ i,0-2a)
(2.17)
d Cz
Combining (2.16) and (2.17) using the chain rule and evaluating at a = 0, we have
duZ dpuz/d
(p__P__O-dur d oz/d3
|
aM (2.18)dz ,=0 dr =0 z/ d M - M
Finally, substituting (2.18) into (2.15) and solving for #u,, we have the CAPM
risk-expected return relationship
Hi r + (M -), (2.19) where
I~iM im 2 (2.20)
A'M
Also, if R =r -rf is the excess return on a security or portfolio, then (2.19) can be written in the often more convenient excess return form as
Ri = fai RM, (2.21)
where R =,u - rf is the expected excess return.
Equations (2.19) and (2.20) algebraically formalize the ultimate insight of the CAPM: The expected return ui on any individual security i depends on the security's covariance ori with the market portfolio M. The coefficient
fiN,
which is aptly called the security's beta, is simply a normalized version of o . The notation for betaoriginates from the least-squares linear regression model
Ri = cai + flm RM + i , (2.22)
where
fli
is given by (2.20), a = R-fRim R E(ej)= 6 =0, Var(e,)= ,Cov(ei, Ejgi)=0, and Cov(,, R)=0. Based on (2.22), we can interpret Pfl as the expected percentage return on security i owing to a 1 percent return on the market
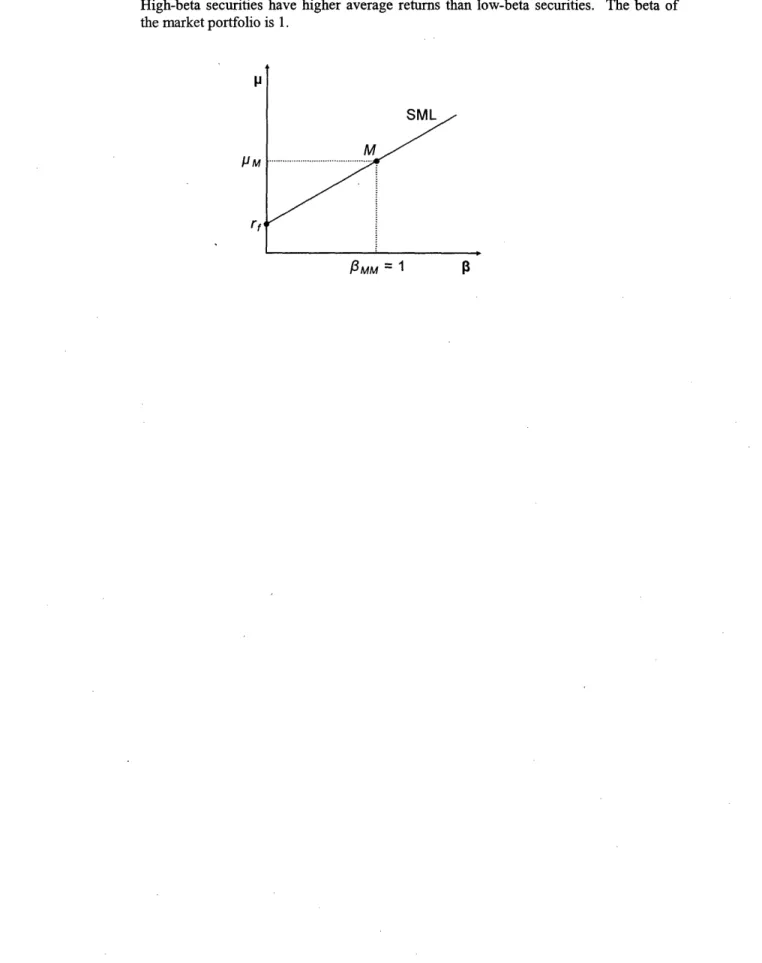
portfolio M. Compared to other securities, when fli > 1, security i is aggressive; when im = 1, security i is neutral; and when pi < 1, security i is defensive.
The graph of equation (2.19) in the - u plane is called the security market line (SML), which is illustrated in Figure 2.4. Note that p = M when ,8 = 1 because f =
a /r 2
= o-2 /2 = 1. More generally, /3PM for any portfolio P with weights w is given by
PM/ = rPM = Wi iM = WifiM (2.23) =1M O= M i=l
Additionally, using equation (2.23), the excess return form of the SML (2.21), and the fact that Rp = pP -rf N = witi -rf i=1 N N =' EWi, i, - W, irf i=l i=l N = W (i -rf) i=1 N = wi Ri, i=1 we have N N JPM RM E wIMRM = EWJR, =RpX i=1 i=1
which demonstrates that the SML holds not only for all individual securities but also for all portfolios.
2.4
Alternative Derivation
As mentioned previously, the CAPM is a positive economic theory that endeavors to predict or explain how security prices are formed in financial markets. If we restrict our attention to single-period or static representations of reality, the supply of each security can reasonably be assumed fixed. Consequently, modeling the equilibrium price
such, the CAPM can be regarded as a theoretical approximation to the actual (unknown)
process that investors follow to determine their demand for different securities.
Specifically, the central CAPM assumption is that all investors utilize MT portfolio analysis and therefore optimization problem (2.8) to select their risky portfolios. We referred to this assumption in the prior section as the decision model because it specifies the tradeoffs that market participants consider when deciding among different investment opportunities.
More generally, suppose a particular investor k employs MT portfolio analysis to allocate his wealth Wk across the set of risky securities Pk c T, where T includes all publicly traded risky securities,
I
=N
( has N elements), and Ik I= Nk < N.What can we conclude, at least qualitatively, about the investor's demand for each security?
The contribution by investor k to the aggregate demand for security i depends on the investor's wealth Wk, his risk aversion as reflected by the fraction crk invested in the risk-free security, and his tangency portfolio weight wiQk, which he determines by solving the optimization problem
WE Wik k - rf
max
Spk =PA
u f -i
r 1Z
E
WviJkak 'jk (2.24) iEk jETk2 s.t. k = 1.Investor k will allocate zero dollars to security i when i Tk and will allocate
(1-ak )wWQk Wk dollars to security i when i ETk . The k subscript in (2.24) emphasizes that the investable universe, means, variances, and covariances are specific to the particular investor k and generalizes optimization problem (2.8).
The objective function Spk = (ik -rf )cpk indicates that WiQkn will depend on the
sensitivity of upk and 0
Pk (or equivalently Ck ) on security i . The marginal
- i ik (2.25)
awik
and the marginal contribution to portfolio risk
- 2 wjk rk = 2opk (2.26)
OWik jE'k
suggest that security i will tend to be highly demanded when ik is large and when oiPk
is small or negative.
Conceptually, it is useful to interpret crPk as being roughly equivalent to the
average covariance
_ 1
yjk N= jk , ok. (2.27)
Thus, the contribution by investor k to the aggregate demand for security i essentially
depends upon (1) the investor's wealth Wk, (2) the investor's risk aversion as reflected.by
ak, (3) the security's mean Jtik, and (4) the security's average covariance i k. Security
i with ik < 0 could potentially be a valuable addition to portfolio Qk even if #ik < 0.
Although the dependency of wiQk on /ik is quite intuitive, the dependency of wQk on
5ck rather than cik is more profound. When the goal is to optimize portfolio reward and risk, a security's diversification properties as reflected by -jk are more important than its individual risk ik.
Our discussion thus far has focused on developing a qualitative understanding of the factors considered by investor k in determining wiQk. Now, suppose we are given or observe the investor's optimal weight vector wQk corresponding to his optimal risky portfolio Qk . Knowing that wQk was found by solving optimization problem (2.24), can
we say something more precise about the manner in which ,ik was traded-off against
ij k to generate wQk ?
Let us. replicate the procedure that investor k would have used to calculate wQk. In order to solve optimization problem (2.24), we construct the Langrangian
/PPk
-rf
(
L=
2
ik WPk'pk ie'k
- ),
where A is a Lagrange multiplier. The necessary conditions for a maximum are given by
a(lUPk - rf) Pk
-rf)
awik 'wk
2 'Pk
- A = 0 for each i wTk and
0. 2, wZi ek Wik- 1 = Since
(,Pk - rf
)
= ik aWik and=2o
Pk-
2
awik wjk aiJ = 2'iPk jeTkthe optimality condition for each security i becomes
To fix A, we multiply (2.28) by wik and add the resulting Nk equations, which yields the single equation
~WkkWtk
rf)
C~(PkA.
aPk Z£ Wik P& k - r Wik Pk WPok = .ie'k 0Pk iek
Since
ivk ulik =p ppkand
E iW wkPk = ok, we haveA = r.
'PkFinally, we substitute for A in (2.28) and solve for /ik to coax the optimality condition for each security i into the more suggestive form
/ik =
rf
+ Pk (Pk -rf)
for each
i
,kwhere CPk P iPk = 2 rPk a Wik wPk aWik
/Uik
Pkk
(--
Pk-rf-
)-Apk
= 0 for
each
i Tk .
rPk
(2.28)
(2.29)
Therefore, any optimal solution to (2.24) must satisfy the system (2.29) in addition to the basic feasibility constraint 1k w k = 1. In particular, we know that wQk is an optimal solution to (2.24) and hence we know that /lik =rf +iQk(Qk - r) where
fiQk = ariQk/crQk for each security i E Ok .
System (2.29) reveals precisely how investor k balances Uik against SJik to
determine wiQk and to influence security i's equilibrium price pi. Imagine investor k found wQk through an (instantaneous) iterative procedure. The investor started with some initial portfolio w(k), calculated the required means It0) and variances-covariances E(°), and solved problem (2.24) to determine whether (o) needed adjustment. Note that the parameters C1
k and Ik depend on the prices p. For example, A0k -t(O) Olik S(2.31)
P~ik - 0)
where qik is the expected payout from security i. The optimal portfolio w()* differed
from the initial portfolio w(0) and therefore investor k purchased and sold securities so
that his new portfolio wQ) matched w(°)*
Suppose w(Ok was greater than () for the particular security X. Xek VVLCJ ~jL~CIL~I CIIUI XQ Purchasing
k
additional shares of security X placed upward pressure on the security's price p( ) resulting in the higher price p(l) and the lower expected return (). The portfolio w(l) was optimal for the iteration 0 parameters () and 1(?) but was suboptimal for the iteration 1 parameters F(t and (k). In other words, the very act of acquiring I~IUCIII I )CIUI~L~13 k "^'~' k ""'~"~ "" "`~Qk t' W(
altered the conditions under which the investor preferred w() to all other portfolios. Using the new parameters IL(1) and (1), the investor was forced to re-optimize to find the new best-portfolio w(Qk and to subsequently buy and sell securities so that his new holdings w in iteration 1 was smaller than the adjustment required in iteration 0 owing to a steadyk(2) matched w(' . Fortunately for investor k, the adjustment required in iteration 1 was smaller than the adjustment required in iteration 0 owing to a steady
convergence toward equilibrium. In the case of security X, for example, the upward price-pressure in iteration 0 reduced xk and therefore the security's attractiveness in
iteration 1. At some eventual iteration t, the optimal portfolio wok was equal to the investor's holdings w Qk or simply wQk and prices reached their equilibrium values p(t)o k
or simply p. Optimality condition (2.29) is the investor's stopping rule or alternatively the thrust behind the investor's contribution to aggregate demand.
When we expand our scope to include all K investors in the economy, the price formation process is significantly more complex and quite difficult to imagine. Although each investor k utilizes optimization problem (2.24) to determine Qk, the equilibrium
portfolios wQk and prices p are driven in an intricate manner by a multitude of choices
for Tk', Xk, and k. Consider the particular investors A and B and the specific
security X. In general, (1) security X may or may not belong to wA or T, (2) txA may be greater or less than ,, and (3) cXA may be greater or less than cXB.
The second CAPM assumption, which vastly simplifies our analysis of aggregate demand, is that each investor k solves optimization problem (2.24) using the same
k = P, Pk = a, and ]k = . We referred to this assumption in Section 2.3 as the
implementation model because it specifies how each investor actually implements the
decision model.
Conceptually, the CAPM implementation model creates an economy in which all investors simply handover their capital to a single financial advisor who solves optimization problem (2.24) using Tk = P, k = pa, and k = . Since the economy effectively has only one investor, we can easily reverse-engineer our hypothetical financial advisor's equilibrium optimal portfolio: It must be the observed market portfolio M. Therefore, wM satisfies the optimality conditions
Hi = rf + pfi (M - rf) for each security i E W, where
_iM
2.5
Anomalies
The CAPM assumptions represent a sensible conjecture as to the actual process followed by investors in determining their demand for different securities. Consider the CAPM risk-expected return relationship in the instructive pricing form
i f +(2.32)
which is found by substituting (qi - p)/p for ui in the CAPM equation (2.19) and solving for p,. Note that qi can be thought of as the net present value of all expected payouts from security i at the end of the period (remember, the CAPM is a single-period model). Equation (2.32) emphasizes the pros and cons that investors contemplate, as hypothesized by the CAPM, when deciding the fair price for security i. Namely, a high (low) expected payout qi is a positive (negative) attribute while a high (low) average covariance li is a negative (positive) attribute.
In constructing an aggregate demand model for any consumer product or service, observed prices will reflect the model's predictions only to the extent that the true cost-benefit analysis undertaken by consumers is accurately captured. For example, suppose an entrepreneur builds a model for predicting the price of autos depending on their age, type (sports car, family sedan, utility truck, etc.), color, and horsepower. He finds a classified ad in the local newspaper for a 10-year-old, red, 300-hp sports car. The asking price is $30,000 but the model predicts a fair market price of $35,000. Consequently, he buys the auto, places a new ad with a $35,000 asking price, and contentedly awaits the
projected $5,000 gain. Unfortunately, due to insufficient public interest, he is forced to
reduce the price and is ultimately pleased to recover the initial $30,000 investment with
$0 profit.
What happened to the entrepreneur's apparent bargain? While there are many plausible explanations, one likely pitfall is that the model misstated or omitted the impact of certain important factors. For instance, consumers' willingness to pay for autos is almost unquestionably strongly related to gas mileage and safety features in addition to
age, type, color, and horsepower. On the other hand, it might be the case that the entrepreneur's model is fairly precise on average and that random noise was the primary reason for the $5,000 discrepancy in this particular situation. Of course, if the model's performance were observed over many predictions, we would be more confident in conlcuding whether the entrepreneur was wrong or simply unlucky.
Similarly, while the CAPM is logical and elegant, it must be checked against historical data to determine whether it provides an adequate description of the price formation process in financial markets. The mountain of empirical studies that profess to either support or refute the CAPM are far too numerous to describe in detail here. Nonetheless, we briefly mention a handful of important analyses and summarize the consensus findings. Fama and French (2004) provide a comprehensive and readable account of empirical investigations related to the CAPM.
We must acknowledge, as many other researchers have, that empirical tests of the CAPM are inherently fraught with conceptual difficulties. For one, the market portfolio is a theoretical ideal that is problematical to construct or even define in practice. Also, assuming we have a reasonable proxy for the market portfolio, the beta for each security must still be estimated from the available data and is thus subject to measurement error. Finally, the CAPM relates the expected return on security i to the expected return on the market portfolio M; in reality, investors' ex ante expectations are unknown and we must therefore be satisfied to utilize realized or average returns as a second-rate substitute.
In short, the academic empirical research has found either mixed or unflattering evidence regarding the CAPM beta-expected return relationship. For example, an early investigation by Fama and MacBeth (FM) (1973) examined monthly returns on U.S. equity securities from 1935 to 1968. Suppose the return on stock i = 1, ..., N at month
t = T + 1,..., T is given by
rit= Pit + [it' (2.33) where E,t is a zero-mean random variable. Consistent with the SML in excess return
form, Ri, = ri, - r can be written as
The beta for stock i at month t is unknown but can be approximated by fitting the estimated (time-series) regression function
Ritr = it + AtRMtr (2.35)
where , is an estimator for ,t, RM, is the excess return on a broad stock portfolio at
month t, and r =t-T,...,t-1. Then, at each month t the intercept and slope
coefficients Yot and Yjt that relate p, to R, can be approximated by fitting the estimated
(cross-sectional) regression function
Rit =- Yot + Ylt it, (2.36)
where Yot is an estimator for Y,t and ,t is an estimator for yt,. By inspection of equation (2.34), if the CAPM is valid, then the average Pot should be close to zero:
T-T-I
Yot = I ot 0.
T-T-1 =l
Also, the average ;,t should be close to the estimated market risk premium:
1 T-T-1 ^ 1 T
YY 1 m R -ZRmt
Ylt T-T-1 t = T
FM conclude that o', is greater than 0 and that is less than RM, which contradicts the CAPM; average returns on low-beta stocks are too high and average returns on high-beta stocks are too low.
More recently, Fama and French (FF) (1992) analyzed the purported relationship between beta and expected returns from a slightly different yet extremely enlightening perspective. Besides testing whether beta is positively related to average returns, Fama and French assessed whether other commonly scrutinized financial metrics have incremental explanatory power for average returns beyond beta. By adding factors to the FM cross-sectional regression, FF conclude that market value of common equity (ME),
earnings-to-price (EP), debt-to-equity (DE), and book-to-market (BM) have significant
marginal relationships with average returns. The FF article synthesizes a swell of prior empirical research that documents anomalies or deviations from the CAPM including
The earlier empirical CAPM investigations are philosophically different from the more recent studies. The former attempt to test whether beta provides an adequate description of cross-sectional variation in average returns while the latter attempt to uncover other factors that possess additional or better explanatory capability. Either
approach can offer evidence to support or refute the CAPM since the SML specifies beta
as the only important determinant of expected returns.
To justify their findings, FF conclude that variables like ME and BE serve as proxies for unknown risk factors considered by investors in determining their demand for different securities. Other researchers including DeBondt and Thaler (1987), Lakonishok, Shleifer, and Vishny (1994) and Haugen (1995) argue that pricing anomalies can be explained by irrational investor behavior. For example, a relatively high BM is often associated with companies that have recently displayed poor performance. Suppose investors tend to overreact to unfavorable news events. Then high BM stocks are likely to exhibit positive returns when the market corrects the temporary mispricing.
Regardless of the proper interpretation of the anomalies literature, the empirical evidence clearly suggests that the CAPM does not fully depict investors' true demand generation process. As such, the continued search for a better descriptor of security
prices is justified. In particular, as an alternative to the CAPM, FF (1993, 1996)
proposed the risk-expected return model
H
= r +
fl (AM -r
+ fl, SMB + fh HML ,
(2.37)
where SMB measures the risk premium on "small" versus "big" ME stocks and HML measures the risk premium on "high" versus "low" BE stocks. As a practical tool for calculating the fair expected return on security i, the FF three-factor model is probably,
superior to the CAPM since the variables ME and BE were specifically chosen due to
their observed incremental explanatory power. Nevertheless, the FF three-factor model is intellectually dissatisfying compared to the CAPM. At the moment, it seems finance practitioners must choose between a precise empirical plug and an erroneous theoretical masterpiece.
3.
The Top-down Capital Asset Pricing Model
3.1 Generalization
The CAPM comprises two assumptions. The decision model stipulates that all
investors employ MT portfolio analysis and therefore optimization problem (2.24) to
select their risky portfolios. The implementation model stipulates that all investors have identical estimates of the means, variances, and covariances for all publicly traded financial securities.
Suppose we tweak the CAPM decision model. What are the consequences? As a concrete example, say we use the same implementation model as the CAPM (homogeneous expectations) but alter the decision model by assuming investors' only goal is to minimize risk and that no risk-free security is available. In this case, instead of optimization problem (2.24), each investor k will solve
1 2 1
min
- Pk = I I Wik WijkWik 2 2 ik jjEk
s.t. Iwik = 1.
The minimum-variance portfolio Qk satisfies the optimality condition riQk = CQk for each security i E Tk .
As argued in Sections 2.3 and 2.4 above, wQk must be equal to WM. Therefore, market
prices p will adjust so that in equilibrium
7iM = M for each security i E T.
Now, suppose we tweak the CAPM implementation model. What are the
consequences? As a concrete example, say we use the same decision model as the
CAPM (MT portfolio analysis) but alter the implementation model by assuming the
market for risky financial securities is segmented into two mutually exclusive and
exhaustive groups, equity and fixed income. More precisely, 'T
=
Eu
PF where
E nr TF = 0K = K E KF where KE r
r
KF = 0describes the set of investors. Each market participant k that belongs to KE invests strictly in securities i that belong to TE and each market participant k that belongs to KF invests strictly in securities i that belong to F . Moreover, we assume the CAPM
homogenous expectations assumption holds locally for the equity segment and for the fixed-income segment, meaning all investors in KE have identical estimates LE and SE
for the securities in WE and all investors in KF have identical estimates JLF and IF for
the securities in TF . Under these assumptions and invoking the arguments in Sections
2.3 and 2.4 above, equilibrium in the equity segment and in the fixed-income segment will be attained separately according to the optimality conditions
pi = rf + AiE (UE - rf ) for each equity security i E TE
where E represents the value-weighted portfolio of all securities in PE and
pi = rf + I3iF (UF - rf ) for each fixed-income security i E WF
where F represents the value-weighted portfolio of all securities in TF .
These examples are meant to illustrate that the CAPM machinery developed in Section 2 above can be used to generate theoretical equilibrium pricing models by judiciously altering the CAPM assumptions. In Section 3.2 below, we utilize this technique to propose a new capital asset pricing model that potentially provides improvements in explanatory power versus the CAPM.
3.2 Proposed Model
Professional money managers rarely optimize over the entire universe of publicly traded financial securities. For example, bond analysis is very different from stock analysis and hence skilled investors typically specialize in one asset class or the other. Moreover, within stocks, the analysis of startup firms, for example, is significantly different from the analysis of mature firms and therefore specialized knowledge is required for investing in small versus large stocks. A similar statement can be made for junk versus government bonds, and the list of examples goes on and on.
Owing to the growing complexity of financial markets and the rising demand for professional financial services, the investment management industry has naturally adopted a philosophy of asset allocation followed by security selection. Corporate pension funds, university endowment funds, and other sophisticated institutional investors act as asset allocators, either themselves or via consultants, by hiring security
selectors who are deemed particularly competent within a narrow band of financial
markets and instruments. Working rather separately, asset allocators and security selectors combine in a top-down fashion to determine the aggregate demand for each individual security.
The CAPM maintains that all investors have identical information about all
securities, but this idea is rather fanciful. An expert on tax-exempt municipal bonds has nary the proficiency to advise his clients on technology and healthcare growth stocks. In any case, we have just argued that, in the interest of organizational simplicity and economies of scale, the asset management industry simply does not operate as such. Of course, if we scrap the idea of homogenous expectations entirely, we might have little structure remaining for building an insightful pricing model. Could there be a compromise between a world of complete agreement and a world of complete disagreement? Consider the following hypothetical financial system.
Suppose the economy includes A asset allocators, S security selectors, and N securities. Further, suppose the market for risky financial assets is segmented into G mutually exclusive and exhaustive groups or asset classes. More precisely,
G G G
T = g where Tg = 0, ITg =Ng, and Ng =N
g= g=1 g=1
describes the set of securities and
G G G
K =UKg where nKg = 0, KgI = Sg,
and
Sg
g=1 g=1 g=1l
describes the set of security selectors. Each security selector k that belongs to Kg invests strictly in securities i that belong to Tg . Also, each asset allocator a apportions the wealth Wa across the S security selectors, where
A
wO = W. a=l
Subsequently, each security selector k apportions the wealth Wok = a= Wak across the Ng securities in Tg, where k Kg and Wak is the wealth provided to security selector
k by asset allocator a.
In this economy, wealth funnels through to each security according to a two-stage, town-down investment process. In the first stage, each asset allocator a determines his optimal asset-class portfolio o,,a where 0(a has G elements. Then, asset allocator a provides the wealth kEKg Wak to the Sg security selectors in each group g. In the
second stage, each security selector k determines his optimal security portfolio wk, where wk has Ng elements if k E K g. Then, security selector k invests the wealth
Wik W.k in each security i E 'g .
Assume all asset allocators follow both the CAPM decision model and the CAPM implementation model. However, instead of optimizing over an investable universe of securities, asset allocators optimize over an investable universe of asset-class portfolios, where each asset-class portfolio Mg is the value-weighted portfolio of all securities
i E Tg. Analogous to the story for individual securities, all asset allocators have identical
estimates for the expected returns uiM the variances M, , and the covariances aM Mh for all groups g and h g. Invoking the arguments in Subsections 2.3 and 2.4,
equilibrium across the segments g = 1,...,G will be attained according to the optimality condition
IMg = rf + MM (M - rf ) for each group g. (3.1) Moreover, assume all security selectors follow both the CAPM decision model and the CAPM implementation model. There is a conceptual discrepancy in making this assumption because security selectors do not invest a portion of their capital in the risk-free security and thus there is no reason to believe they would follow MT portfolio analysis. Therefore, when we say that security selectors utilize optimization problem (2.24) to select their risky portfolios, we interpret their behavior as an attempt to simply
maximize the Sharpe ratio Sp = (p - r )/la of their portfolios. In fact, professional money managers are often evaluated according to their ex post Sharpe ratios, so that Sp represents a sensible objective function. Otherwise, the situation for security selectors is a micro-level analogue of the macro-level CAPM theory for all investors. Invoking the arguments in Subsections 2.3 and 2.4, equilibrium within each segment g will be attained separately according to the optimality conditions
/i = rf + piMg (aM - rf ) for each security i E Tg and group g. (3.2)
Substituting for Mu, in (3.2) using (3.1), we have the top-down capital asset
pricing model
lI = rf + 8mg PfMgM (pM - rf) for each security i E Tg and group g. (3.3)
Equation (3.3) is similar to the CAPM equation except the coefficient im has been replaced by the coefficient IiMM /MM Hence, in a world of top-down investment
management, the equilibrium price of security i is driven by a combination of its covariance with its asset class portfolio and its asset class portfolio's covariance with the market portfolio.
4.
Empirical Analysis
4.1 Data and Methodology
Our main objective in this section is to further illustrate the top-down CAPM through a simple empirical analysis of a particular formulation of the model. Rather than comparing the explanatory power of the CAPM to that of the top-down CAPM over the
entire universe of publicly traded securities, we will focus strictly on U.S. stocks, as in
the vast majority of prior research. We assume the market for U.S. stocks is segmented
into four mutually exclusive and exhaustive groups or asset classes: Small-cap growth (SG), small-cap value (SV), large-cap growth (LG), and large-cap value (LV). This
partitioning scheme was chosen to closely match the actual classification system used by most mutual fund companies and other professional asset management concerns. If the
top-down CAPM provides a reasonable description of reality and the suggested segmentation scheme is accurate, then according to equation (3.2) we should expect the high group beta (i.e., iM ) stocks to outperform the low group beta stocks within each
group.
The data employed in the this study were obtained from the merged
CRSP/Compustat database, range from December 29, 1989 to December 31, 2004, and
cover all NYSE, NASDAQ, and AMEX stocks. The specific data series utilized are (1) monthly total stock return, (2) market value of common equity, (3) book value of common equity, and (4) monthly U.S. Treasury bill return. Before conducting any analysis, the dataset was filtered to remove records with missing entries. Further, all but the top 2,500 stocks by market equity at each date were jettisoned from the analysis
universe.
At each month, each stock was categorized as SG, SV, LG, or LV, where S and L
refer to the stock's size (small-cap or large-cap) based on its market cap (ME) and G and V refer to the stock's style (growth or value) based on its book-to-market ratio (BM). The splits between S and L and G and V were determined by calculating the median values for ME and BM. Stocks with below (above) median values for ME were classified as S (L) and stocks with below (above) median values for BM were classified
as G (V). Together, the size and style classifications determine the stock's group.
In order to establish a control against which the explanatory power of the group betas could be measured, it was necessary to define "the market portfolio" so that market betas could be calculated. The market portfolio was defined simply as the value-weighted portfolio of all stocks analyzed. Unfortunately, since even a well-diversified portfolio of stocks falls substantially short of the entire market, this specification deviates from the core idea this paper: If the investable universe is misspecified, then the resulting betas are erroneous. Nevertheless, we define the market portfolio as such in the interest of establishing some reasonable benchmark for comparison.
Once the stocks were categorized, five separate value-weighted return series, one
for each group portfolio and one for the market portfolio, were computed. The return
series were used to estimate group betas ,iM, and market betas liMt for each stock i and
60 months of history were used to estimate the betas at each date, depending on data availability. If a stock had less than 24 complete months of data at a given date, then no beta was calculated.
The estimated group betas effectively provided a third factor, in addition to ME and BM, for categorizing the stocks. The SG group, for example, was further split into two subgroups, SGGBL (SG Group Beta Low) and SGGBH (SG Group Beta High) according to below median SG group betas and above median SG group betas. Similarly, the groups were split according to below median market betas and above median market betas, where the median was, of course, calculated relative to the group even though
market betas span the entire universe of stocks. Thus, the SG group, for example, was
split into SGMBL (SG Market Beta Low) and SGMBH (SG Market Beta High).
In summary, by categorizing the stocks according to low or high values for size, style, and group or market beta, the following subgroups were formed:
Both value-weighted and equal-weighted return series were computed for each subgroup for the purposes of performance analysis. Subsection 4.2 describes the basic statistical properties of the various subgroup portfolio returns.
Subgroup Name Description
SGGBL Small Growth Group Beta Low
SGGBH Small Growth Group Beta High
SVGBL Small Value Group Beta Low
SVGBH Small Value Group Beta High
LGGBL Large Growth Group Beta Low
LGGBH Large Growth Group Beta High
LVGBL Large Value Group Beta Low
LVGBH Large Value Group Beta High
SGMBL Small Growth Market Beta Low
SGMBH Small Growth Market Beta High
SVMBL Small Value Market Beta Low
SVMBH Small Value Market Beta High
LGMBL Large Growth Market Beta Low
LGMBH Large Growth Market Beta High
LVMBL Large Value Market Beta Low
4.2
Results
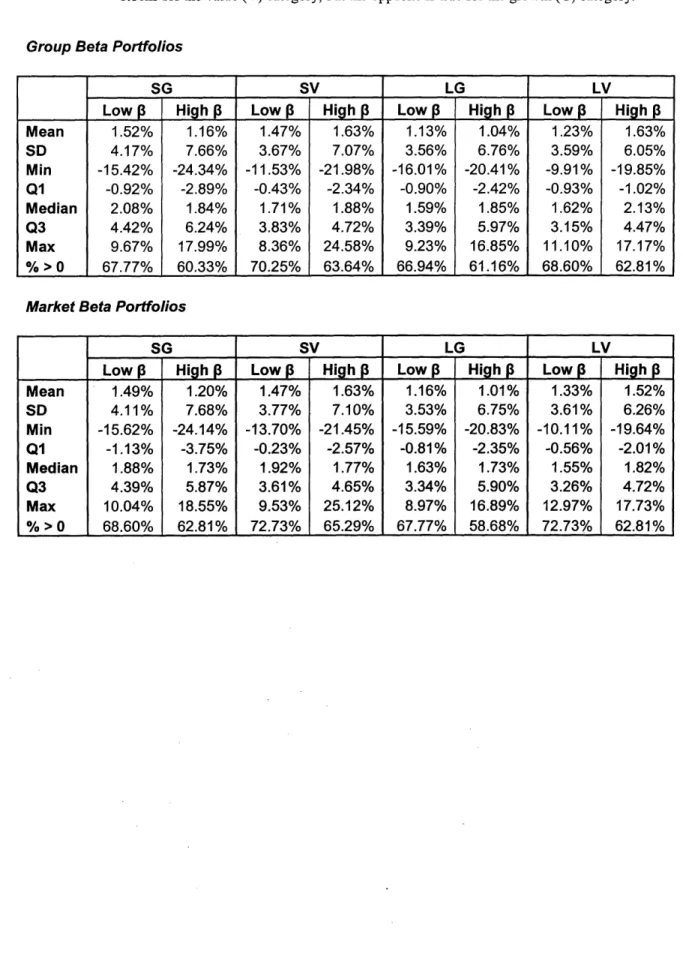
Figure 4.1 provides summary statistics on the subgroup portfolio returns. The first panel describes the portfolios based on group betas and the second panel describes the portfolios based on market betas, where the portfolios are equal-weighted. For example, the first entry in the first panel 1.52% gives the average monthly return over time for the SGGBL equal-weighted portfolio. Similarly, the first entry in the second panel 1.49% gives the average monthly return over time for the SGMBL equal-weighted portfolio.
The most glaring result from Figure 4.1 is that the two panels are practically identical, which suggests that group betas are essentially indistinguishable from market betas, at least in terms of rank order. This is probably a consequence from the rather
coarse segmentation scheme consisting of only four groups and from the naYve definition of the market portfolio as comprising merely stocks. In addition, it seems that high beta stocks outperform low beta stocks on average for the value category, but low beta stocks outperform high beta stocks on average for the growth category.
Figure 4.2 provides a complementary perspective on the performance of the subgroup portfolios. The figure shows eight separate charts, each representing the growth in both the low and high beta subgroup portfolios for a given group, where portfolios start from an arbitrary index value of 100. For example, the chart labeled "SG Group Beta Portfolios" illustrates the growth over time of the SGGBL and SGGBH subgroup portfolios, where the low beta portfolio is represented by a solid line and the high beta portfolio is represented by a dashed line. Overall, SGGBL outperforms SGGBH, which contradicts the top-down CAPM but confirms the summary statistics in Figure 4.1. The side-by-side presentation of the group beta portfolios and the market beta portfolios provides further evidence that group betas and market betas are enormously similar.
Figure 4.3 provides summary statistics for the difference between the high beta portfolio return and the low beta portfolio return within each group and for both group betas and market betas. For example, the first entry in the table -0.36% indicates that the average difference over time between the equal-weighted return on the SGGBH subgroup portfolio and the equal-weighted return on the SGGBL subgroup portfolio is slightly less
than 0, meaning high group beta SG stocks on average underperform low group beta SG stocks, which refutes the top-down CAPM. As in previous figures, the statistics for group beta portfolios are remarkably similar to the statistics for market beta portfolios. The row labeled "% > 0", which shows the percentage of months where the high beta portfolio outperformed the low beta portfolio, is particularly revealing. All of the percentages hover around 50, although the percentage for both group beta LV and market beta LV might be significantly higher.
The last row in the table of Figure 4.3 gives the t-statistic for the mean difference
return. If high beta stocks tend to outperform low beta stocks on average, then we would expect the t-statistic for the mean difference return to be positive and statistically significant. However, in direct contradiction to both the top-down CAPM and the CAPM, none of the t-statistics surpass the critical value of 1.97 and half of them are actually
negative. Thus, the empirical analysis presented provides no evidence to support the
top-down CAPM or the CAPM.
5.
Conclusions
The main prediction of the CAPM, that investors require compensation strictly for bearing systematic risk, is a consequence from the impractical assumption that all investors have identical information for all publicly traded financial assets. In this paper, we have proposed a model called the top-down CAPM which seeks to strike a balance between the tractability of homogenous expectations and the reality of specialized security analysis and portfolio management.
In Subsections 2.1 and 2.2, we described Markowitz's NMV portfolio analysis and
Tobin's separation theorem as a prelude to the CAPM. The assumption that investors use MT portfolio analysis to select their risky portfolios provides a sensible underlying behavioral model for the CAPM.
In Subsection 2.3, we presented the traditional CAPM derivation provided in most
investments textbooks and the academic finance literature. Although the derivation was accurate, the CAPM equation seemed to mystically pop out in the end like a rabbit from a
difficult to understand the exact role played by the decision model assumption versus the implementation model assumption.
In Subsection 2.4, we presented an alternative CAPM derivation which clearly demonstrated that the CAPM equation, in form, is simply an optimality condition corresponding to optimization problem (2.24). When the homogenous expectations assumption is added to the MT portfolio analysis assumption, the market portfolio emerges within the CAPM equation, but the relationship holds more generally when investors optimize over smaller investable universes.
In Subsection 2.5, we briefly described a handful of important empirical studies related to the CAPM. The observation that investors seem to require compensation for risk factors other than beta, such ME and BM, seems to indicate some serious chinks in the CAPM armor. FF proposed a three-factor model as an alternative to the CAPM in order to account for the observed pricing anomalies or deviations from the CAPM
predictions. Still, the FF three-factor model is intellectually frustrating because it is
grounded in empirical observation rather than theoretical judgment.
In Subsection 3.1, we illustrated how the ideas from Subsections 2.3 and 2.4 can be
applied to generate extensions to the CAPM. In particular, since the alterative CAPM derivation separated the consequences of the MT portfolio analysis assumption from the consequences of the homogeneous expectations assumption, we were able to borrow
from one assumption or the other (or both) to formulate extensions to the CAPM.
In Subsection 3.2, we developed the top-down CAPM using the general CAPM
machinery described in Subsection 3.1. Specifically, we assumed the aggregate demand for each security is generated according to the sequential behavior of asset allocators and security selectors, where the CAPM held, albeit with a slightly modified interpretation, for each of the two investor types. The top-down CAPM formula shows that the relevant measure of risk for security i is MMiMf rather than P .
In Section 4, we presented a basic empirical analysis comparing the explanatory power of the top-down CAPM to that of the CAPM. We found that neither model adequately described the variability in average stock returns within a given equity asset class for the dataset examined.