Theoretical and numerical analysis of
the hydrodynamic waves induced by dam breaks
and their interaction with structures located downstream
B.J. Dewals1,2, S. Erpicum1, P. Archambeau1, S. Detrembleur1 & M. Pirotton11
1
University of Liège, Department of Hydraulics and Transport, Applied Hydrodynamics and Hydraulic Constructions, Chemin des Chevreuils 1, Bât. B52/3+1, B-4000 Liege
2
FNRS Research Fellow
Email: [email protected], [email protected], [email protected]
Abstract: The present paper first describes briefly the hydrodynamic model WOLF 2D, developed at the University of Liege and suitable for conducting dam break risk assessment. Secondly, the simulation of the flood induced by the Malpasset dam break enables to highlight the effectiveness of WOLF 2D. Lastly, the model is applied to demonstrate the key advantages of the most contemporary approach for reproducing the effect of buildings on the flow behaviour. The recommended modelling technique is based on a high resolution Digital Elevation Model, provided by laser measurements.
Keywords: Hydrodynamic model, finite volume, dam break,
risk assessment, free surface flows, laser digital elevation model
I. INTRODUCTION
For more than ten years, the HACH research unit (Applied Hydrodynamics and Hydraulic Constructions) from the University of Liege has been developing numerical tools for simulating a wide range of free surface flows and transport phenomena. Those various computational models are interconnected and integrated within one single software package named WOLF. After a series of validation tests (benchmarking) and numerous comparisons with other internationally available models, the Belgian Ministry for Facility and Transport (MET) has selected WOLF for performing flood risk analysis on the main rivers in the South of Belgium and for conducting dam safety risk analysis in the country.
The present paper focuses on the practical application of the model WOLF 2D for predicting the flow induced by dam breaks and for performing risk assessment.
The main features of WOLF 2D are first depicted. Then, the simulation of the Malpasset dam break is exploited to demonstrate the efficiency and accuracy of the model.
Finally, the practical application of the model to simulate a large scale example of a flood wave propagating across a urban area will emphasize the importance of a correct estimation of the energy losses caused by macro-roughness elements such as buildings. A very contemporary technique, based on a high quality digital elevation model, will be extensively discussed and validated.
II. THE HYDRODYNAMIC MODEL WOLF 2D
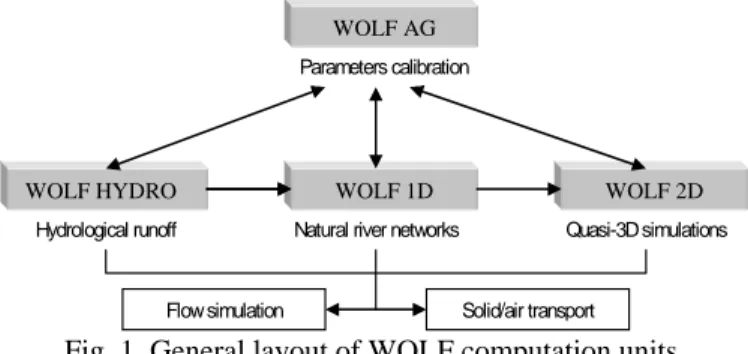
The software package WOLF includes an integrated set of numerical models for simulating free surface flows (see Fig. 1), including process-oriented hydrology, 1D and 2D
hydrodynamics, sediment transport, air entrainment, … as well as an optimisation tool based on the Genetic Algorithms.
Flow simulation Solid/air transport
WOLF AG
WOLF HYDRO WOLF 1D WOLF 2D
Parameters calibration
Hydrological runoff Natural river networks Quasi-3D simulations
Fig. 1. General layout of WOLF computation units. The computation unit WOLF 2D described and applied in the present paper is based on the shallow water equations (SWE) and on extended variants of the SWE model, solved with an efficient finite volume technique. It achieves fast computation performances while keeping a sufficiently broad generality with regard to flow regimes prevailing in natural rivers, including highly unsteady flows.
A. Physical system and conceptual model
In the shallow-water approach the only assumption states that velocities normal to a main flow direction are smaller than those in the main flow direction. As a consequence the pressure field is found to be almost hydrostatic everywhere. The large majority of flows occurring in rivers, even highly transient flows such as those induced by dam breaks, can reasonably be seen as shallow everywhere, except in the vicinity of some singularities (e.g. wave front).
The divergence form of the shallow-water equations includes the mass balance:
0 i i q h t x ∂ ∂ + = ∂ ∂ (1)
and the momentum balance:
f 0; 1, 2 i j i i i i q q q H gh S j t x h x ⎡∂ ∂ ⎛ ⎞⎤ ⎛ ∂ ⎞ + + + = ⎢∂ ∂ ⎜ ⎟⎥ ⎜ ∂ ⎟ ⎢ ⎝ ⎠⎥ ⎝ ⎠ ⎣ ⎦ = (2)
where Einstein’s convention of summation over repeated subscripts has been used. represents the free surface elevation, is the water depth, q designates the specific discharge in direction i and is the friction slope.
H
h i
fi
B. Algorithmic implementation
The space discretization of the 2D conservative shallow-water equations is performed by a finite volume method. This ensures a proper mass and momentum conservation, which is a prerequisite for handling reliably discontinuous solutions such as moving hydraulic jumps. As a consequence no assumption is required as regards the smoothness of the unknowns.
Designing a stable flux computation has always been a challenging and tough issue in computing fluid dynamics, especially if discontinuous solutions are expected. Flux treatment is here based on an original flux-vector splitting technique developed for WOLF. The hydrodynamic fluxes are split and evaluated according to the requirements of a Von Neumann stability analysis. Much care has been taken to handle the source terms representing topography gradients.
Since the model is applied to transient flows, the time integration is performed by means of a second order accurate and hardly dissipative explicit Runge-Kutta algorithm.
III. VALIDATION:MALPASSET DAM BREAK
Located in a narrow gorge of the Reyran River in the Departement of Var in France, the double curved 66.5 metres high Malpasset arch dam has been built for irrigation purpose and for drinking water storage. Its crest was 223 metres long and the maximum reservoir capacity was 55 millions m³.
C. Friction modelling
River and floodplain flows are mainly driven by topography gradients and by friction effects. The total friction includes three components: bottom friction, wall friction and internal friction.
The bottom friction is classically modelled thanks to an empirical law, such as Manning formula:
2 2 2 fi 10 3 i x n S q q h = +qy (3)
A. Description of the accident and collected data
At 21:14 on 2 December 1959, during the first filling of the reservoir, the dam broke almost instantaneously, inducing the catastrophic sudden release of 48 millions cubic metres of water in the 12-kilometer long river valley down to the town of Frejus and the Mediterranean sea. A total of 423 casualties were reported [4, 5]. Further investigations showed that key factors in the dam failure were ground water pressure and left bank rock nature. As this dramatic real dam break case has been well documented, it has also been extensively used as a benchmark for validation of numerical models. Indeed, estimations of propagation times are available, since the shutdown time of three electric transformers destroyed by the wave are known. Similarly, a survey conducted by the police enabled to determine the flood level marks on both riverbanks. Finally, a non-distorted 1/400-scale model was built in 1964 by EDF and was calibrated against field measurements. This model has thus provided the modellers with additional data of water level evolution and propagation times [4, 8].
B. Characteristics of the simulation
By means of a multiblock regular grid, the mesh is refined close to strategic areas (dam location, sharp river bends), without leading to prohibitive CPU times. 180,000 cells, with three unknowns, are used to simulate the reservoir emptying and the wave propagation down to the sea (Fig. 2).
Because of the important changes in the topography after the accident, an old map (1/20,000 IGN map of Saint-Tropez n°3, dated 1931) has been used by EDF to generate the initial bottom elevation of the valley. 13,541 points have been digitised to cover the area of interest. These points have been interpolated to generate a finer Digital Elevation Model (DEM) on the 180,000 cells finite volume multiblock grid exploited for the numerical simulation with WOLF 2D (Fig. 2). The elevation of the domain ranges from minus 20 metres ABS at the sea bottom to plus 100 metres ABS, which corresponds to the estimated initial free surface level in the reservoir (with an uncertainty of about 50 cm).
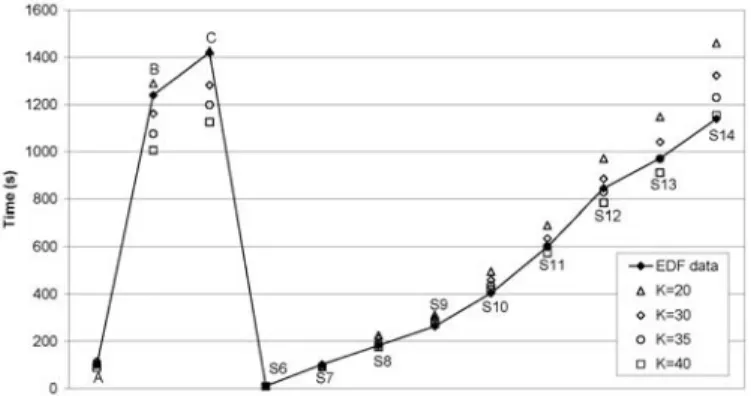
From physical scale model tests, the Strickler roughness coefficient has been estimated to be in the range of 30 to 40 m
K
1/3
/s. Four simulations have been carried out with values of 20, 30, 35 and 40 m
K
1/3
/s. where n (s/m1/3) represents the Manning coefficient.
The model enables the definition of a spatially distributed roughness coefficient. This parameter can thus easily be locally adjusted as a function of local soil properties, vegetation or sub-grid bed forms. An original evaluation of the real shear surfaces is realized and the friction along vertical boundaries, such as bank walls, is reproduced through a process-oriented model developed by the authors.
D. Multiblock grid and automatic grid adaptation
WOLF 2D deals with multiblock structured grids [3]. This feature enables a mesh refinement close to interesting areas without leading to prohibitive CPU times. A grid adaptation technique restricts the simulation domain to the wet cells, thus achieving potentially drastic reductions in CPU times.
Besides, the model incorporates an original method to handle covered and uncovered (wet and dry) cells. Thanks to an efficient iterative resolution of the continuity equation at each time step, based on a correction of the discharge fluxes prior to any evaluation of momentum balances, a correct mass conservation is ensured in the whole domain.
Initially, the reservoir is at the level 100 metres ABS and, except in the reservoir as well as in the sea, the computation domain is totally dry, though in the reality a negligible but unknown base flow escaped from the dam. The simulations were run with a CFL number of 0.1 to maximize the accuracy.
E. User interface
A user-friendly interface makes the pre- and post-processing operations very convenient and straightforward to control, including a wide range of graphic capabilities such as 2D and 3D views as well as animations.
Fig. 2. Shaded representation of the interpolated topography and definition of the blocks characteristics on the multiblock computation grid. Position of the field and laboratory measurement points.
C. Results
Fig. 3 and Fig. 4 enable to compare the computed results with the field and laboratory measurements, both in terms of wave arrival time and of maximum water levels. Indexes A to C refer the three electric transformers. Since transformer A is located in the bottom of the valley, its shutdown time corresponds indeed to the wave arrival time. For the two others, the shutdown time is assumed to be between wave arrival time and time of maximum water level. Therefore it is more relevant to compare the time interval between the two shutdowns (Fig. 3). The computed arrival times are found to be in satisfactory agreement with the measurements. The value of K = 1 / n = 35 m1/3/s appears to fit best reference data. This fact also corroborates the corresponding results from the physical tests performed by EDF.
Fig. 3. Wave arrival time to electric transformers (A to C) and to the gauges (S6 to S14) of the scale model.
Fig. 4. Maximum water level at police survey points (P1 to P17) and at the gauges (S6 to S14) of the scale model.
Fig. 5. Map of highest water levels. Comparison of the flood extension with the police survey points.
Given the topography accuracy, the maximum water levels are found to be in good agreement with the measurement points, as shown by Fig. 4. It must be outlined that the
sensitivity of the results to the value of the roughness coefficient is particularly weak.
The user-interface of WOLF enables to easily produce and edit several risk maps, such as wave arrival time and highest water levels. These maps corroborate again the reliability of the simulation results, as shown by Fig. 5 in terms of flood extension
IV. FLOW INTERACTION WITH DOWNSTREAM STRUCTURES:
EXAMPLE OF THE FLOW IN A URBANIZED AREA
A. Context
In order to illustrate some of the main concepts at the basis of a relevant modelling of the interaction of the dam break wave with downstream macro-roughness elements (such as buildings), the simulation of the propagation of a stiff front in an urban area is discussed below on the basis of a comprehensive example.
Several modelling techniques will be compared for achieving a realistic reproduction of the energy losses encountered by the flow.
B. Topography data
The most reliable digital elevation model available for representing the topography of the urbanized valley is based on laser measurements performed by an airborne device. The extraordinary resolution and accuracy of this set of data enable a direct reproduction of almost every building individually.
Fig. 6. Comparison between the “Laser DEM” and the “Smoothed DEM” in the considered urban centre.
However, in order to highlight the sensitivity of the obtained results with regard to the modelling approach used for the buildings located in the urban centre, several simulations will be carried out on the basis of two different Digital Elevation Models (DEM):
- the first one, named "Laser DEM", corresponds simply to the above-mentioned set of data acquired by airborne laser measurements;
- the second one, named here "Smoothed DEM", is identical to the first one except that in the urban centre the buildings have been removed in order to reproduce only the ground topography.
Fig. 6 illustrates the details of these two DEM in the considered urban area. The buildings clearly identified on Fig. 6 (a) are almost completely absent from the “smoothed DEM” represented on Fig. 6 (b).
C. Modelling of energy losses
In a similar perspective of comparative analysis of the techniques relevant for modelling the macro-roughness effect of the buildings, two distinct friction laws will be exploited:
- first, the conventional Manning formula;
- second, the Bathurst formula, developed specifically for handling the effects of macro-roughness elements as a function of their characteristic size k:
2 2 2 f 3 1 5, 62 log 4 i i h S q k gh − ⎡ ⎛ ⎞ ⎤ x y q q =⎢ ⎜ ⎟+ ⎥ ⎝ ⎠ ⎣ ⎦ + (4) (a) (a) (b) (b)
Fig. 7. Detailed distribution of the Manning friction coefficient, either in proportion to the height of the buildings (a), or with binary values in accordance
with French regulations (b).
The friction coefficient used in the Manning formula will be spatially distributed in the simulation domain, in order to take into consideration the increased flow resistance in the densely urbanized areas. For this purpose, two strategies will be compared:
- either a coefficient distributed proportionally to the local difference between the “Laser DEM” and the “Smoothed DEM”, i.e. in proportion to the height of the buildings;
- or a binary coefficient, characterized by a low value in non-urbanized zones and artificially increased in the urban centre.
In the first case, the coefficient varies between
and , as depicted by Fig.
7(a). This upper value is coherent with the conclusions of the European project RESCDAM, during which numerous experiments have been carried out in flumes with highly transient flows in the presence of various obstacles [7]. In the second case, the approach is in conformity with French regulations, which recommend the use of a Manning
coefficient ranging between for
non-urbanized zones non covered by forests and in urban areas [6]. Fig. 7(b) represents this later distribution of the friction coefficient.
1/3 0, 033 s/m n= n=0,150 s/m1/3 1/3 0, 033 s/m n= 1/3 0, 01 s/m n=
In the case of the Bathurst formula combined to the “Smoothed DEM”, the roughness height will be simply distributed proportionally to the local difference between both DEM. Moreover, this parameter is kept everywhere higher or equal to 0.10 m to account for the roughness of the bottom itself. This later value is used in the whole computation domain whenever the more accurate “Laser DEM” is used.
k
The key importance of the cautious estimation of those friction coefficients has been corroborated by sensitivity analyses performed on several examples of dam break induced flood waves [1].
D. Flood wave
A dam break is assumed to occur upstream of the urban area of interest and to initiate a highly transient flood wave. The corresponding front propagates extremely fast. Indeed, its mean velocity upstream of the urban centre is as high as 20 m/s, which would cause major human and material damages in the town.
The computation grid consists of square cells of five meters by five meters. It contains 450,000 potential computation cells and the results show that approximately 281,000 cells are indeed reached by the flow during the simulation.
The hydrodynamic simulation results reveal that the front shape is strongly influenced by the obstacles present in the DEM used, while the global behaviour of the flood wave remains similar both on the “Laser DEM” and on the “Smoothed DEM”. More quantitatively, the plots analyzed hereafter will enable a detailed analysis of the impact on the result of the type of macro-roughness modelling approach exploited for taking into account the buildings.
E. Time of arrival of the front and maximum water depth
Among the main objectives of conducting the simulation of the propagation of such a dam break wave, let’s recall the determination of risk maps plotting in the flooded downstream valley various information such as the time of arrival of the front and the expected maximum water depth.
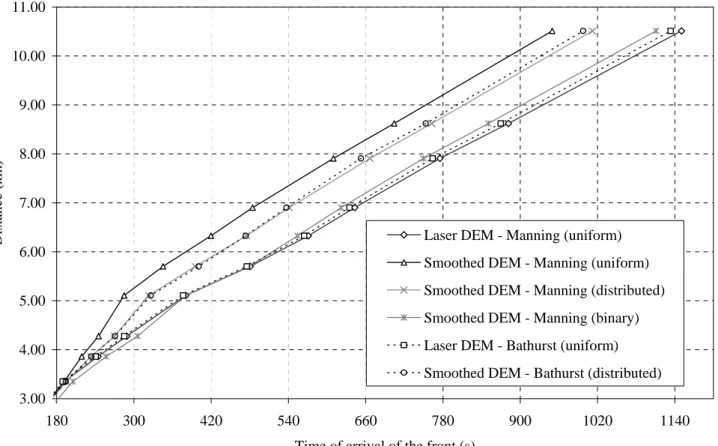
Fig. 9 and Fig. 10 respectively provide those two pieces of information at twelve points located in the main bed of the river. The points are identified on the plots by the distance which separates them from the initial location of the collapsed dam. This distance is measured along the developed main riverbed. The displayed results correspond to the outputs of six different simulations, which can thus be compared to provide a particularly thorough analysis of the incidence of the macro-roughness modelling on the prediction of the dam break wave.
1) “Laser DEM”
Fig. 9 and Fig. 10 obviously suggest that no significant difference between the various techniques of simulation is observed upstream of the urban centre.
Thereafter, the lowest front propagation velocity (Fig. 9) results from the modelling based on the complete “Laser DEM” (uniform Manning friction coefficient:
). This observation is totally logical and expected since all the obstacles (buildings) are explicitly represented in the DEM of the simulation.
1/3
0, 033 s/m
n=
Only a very slight difference can be observed between the predictions based on the Manning formula and those resulting from Bathurst formula (with a uniform roughness height
0.1 m
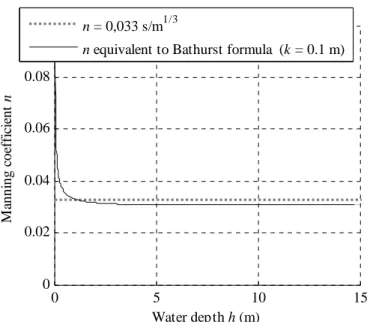
k= ). This similarity of the results (Fig. 9) can be explained simply by the quasi-equivalence of the friction coefficients predicted by both formulas for the considered range of water depth (Fig. 8).
Indeed, Fig. 8 shows that the difference between the friction coefficients predicted by both formulas does not exceed 7 % for water depths ranging between approximately 0.55 m and 15 m. As a consequence of the dam break, the water depths expected in the valley widely exceed the threshold value of 0.55 m everywhere in the main riverbed and in the major part of the floodplain affected by the dam break wave.
0 5 10 15 0 0.02 0.04 0.06 0.08 0.1 Water depth h (m) M an n in g co ef fi cien t n n = 0,033 s/m1/3
n equivalent to Bathurst formula (k = 0.1 m)
Fig. 8. Manning friction coefficient equivalent to the friction coefficient predicted by Bathurst’s macro-roughness formula
3.00 4.00 5.00 6.00 7.00 8.00 9.00 10.00 11.00 180 300 420 540 660 780 900 1020 1140
Time of arrival of the front (s)
Dis
tan
ce (k
m)
Laser DEM - Manning (uniform) Smoothed DEM - Manning (uniform) Smoothed DEM - Manning (distributed) Smoothed DEM - Manning (binary) Laser DEM - Bathurst (uniform) Smoothed DEM - Bathurst (distributed)
Fig. 9. Time of arrival of the front (s) as a function of the distance from the collapsed dam.
9 11 13 15 17 19 21 23 25 1.00 2.00 3.00 4.00 5.00 6.00 7.00 8.00 9.00 10.00 11.00 Distance (km) Maxi m u m water d ept h (m)
Laser DEM - Manning (uniform) Smoothed DEM - Manning (uniform) Smoothed DEM - Manning (distributed) Smoothed DEM - Manning (binary) Laser DEM - Bathurst (uniform) Smoothed DEM - Bathurst (distributed)
With regard to the maximum water depth, these two simulations based on the complete “Laser DEM” lead naturally to the highest values both in the urban area and upstream of the urban centre (Fig. 10). On the contrary, as a result of both the substantial flow resistance acting in the urban centre and the subsequent increase in water depth upstream, the water depths are found to be slightly lower in the section of the valley downstream of the urban centre.
2) “Smoothed DEM”
The highest propagation velocity of the front is predicted by simulation based on the “Smoothed DEM” without any increase in the roughness coefficient (Fig. 9). This results naturally from the absence of the major obstacles (buildings) in the centre of the town, without any compensation in terms of friction. In such a case, the maximum water depths in the town and upstream correspond to the lowest values of the comparison (Fig. 10).
Of course, if the simulation takes into account a suitable distribution of the Manning coefficient or of the characteristic size of the macro-roughness elements, then it provides intermediate values for the time of arrival of the front (Fig. 9) as well as for the maximum water depth (Fig. 10). Although realistic, those results may not be considered a priori as a
reference.
3) Comparison with French legal norms
On the contrary, it must be outlined that applying rigorously the French legal norms, i.e. a binary Manning coefficient as aforementioned, enables to obtain almost identical times of arrival of the front as those predicted by the simulation based on the complete “Laser DEM” (Fig. 9). Moreover, considering, that the French legal specifications are based particularly on in situ studies of real occurrences of dam breaks, as well as on experimental inputs, these specifications might be judged as validated. So, far from being an absolute reference, they may nevertheless be seen as reasonably valid indications of the reality.
On this basis, it can be concluded that the simulation based on the complete “Laser DEM” (including the singularities) and on a uniform distribution of the friction coefficient performs reliably and that the corresponding results are in satisfactory agreement with the recommendations delivered in the French legislation.
In addition, the simulation based on the “Smoothed DEM” and the binary friction coefficient provides expected maximum water depths, which are most probably underestimated upstream of the town and within this one. Indeed, the non-penetrable character of the buildings is not reproduced in this type of simulation. On the contrary, the modelling strategy based on the complete “Laser MNT” reproduces the reduction of the cross sections available for the flow as a result of the presence of the buildings. In this way, higher and safer predictions of the maximum water depths are thus obtained in the town and upstream (Fig. 10). Therefore, this last approach is systematically adopted by the HACH team when conduction flood risk analysis as well aw dam break risk assessment.
4) Interpretation
Finally, let’s mention that the suggested method is by far easier to implement practically, since it exempts the modeller from handling arbitrarily varied friction coefficients. Besides, the recommended modelling technique avoids the laborious and inevitably approximate stage of delineating zones to be classified as “rural” or “urban”, which in addition would always be affected by some level of subjectivity in the case of various intermediate situations.
CONCLUSION
The present paper is composed of three parts, covering respectively a brief presentation of the hydrodynamic model WOLF 2D, an example of validation of the model and a thorough discussion of modelling approaches for characterizing the interaction of the flow with various elements of macro-roughness such as buildings.
The hydrodynamic model WOLF 2D, based on a multiblock mesh, has shown its ability to accurately compute extreme wave propagation induced by the instantaneous or gradual collapse of dams. Very satisfactory agreements have been found between computed results and validation data in the case of the Malpasset accident.
WOLF 2D has also been successfully applied to the simulation of a stiff flood wave propagating in an urban area. A very contemporary approach is recommended to explicitly reproduce the macro-roughness effect of singularities (buildings and structures). In addition to its effectiveness, its non-arbitrary nature and its process-oriented concept, the technique is also validated through its adequacy with the expertise at the base of the policies prescribed in France.
Further developments are currently undertaken. In particular, simulations taking into account sediment movements under dam break flows have been performed. The first results already obtained by the authors [2] demonstrate that these phenomena may strongly affect both the wave propagation time and the maximal water levels.
REFERENCES
[1] Dewals, B., Une approche unifiée pour la modélisation
d'écoulements à surface libre, de leur effet érosif sur une structure et de leur interaction avec divers constituants. 2006, PhD thesis,
University of Liege: 636 p (in French).
[2] Dewals, B., P. Archambeau, S. Erpicum, T. Mouzelard et M. Pirotton, Dam-break hazard mitigation with geomorphic flow
computation, using WOLF 2D hydrodynamic software, in Risk
Analysis III, C.A. Brebbia (ed). 2002, WIT Press. p. 59-68.
[3] Erpicum, S., Archambeau, P., Dewals, B., Detrembleur, S., Pirotton, M. Computation of the Malpasset dam break with a 2D conservative
flow solver on a multiblock structured grid. In Liong, Phoon &
Babovic (ed.), Proc. of the 6th inter. conf. on Hydroinformatics, Singapore, 21-24 June 2004. Singapore: World Scientific Publishing
[4] Goutal, N. The Malpasset dam failure. An overview and test case
definition. in Proc. of CADAM Zaragoza meeting. 1999. Zaragoza.
[5] Marche, C., Barrages : crues de rupture et protection civile. 2004: Presses Internationales Polytechniques, 388 p (in French).
[6] Pirotton, M., Modélisation des discontinuités en écoulement
instationnaire à surface libre. Du ruissellement hydrologique en fine lame à la propagation d'ondes consécutives aux ruptures de barrages.
1994, PhD thesis, University of Liege (in French).
[7] RESCDAM, The use of physical models in dam-break flood analysis
- Final report, Helsinki University of Technology.
[8] Soares Frazão, S., M. Morris et Y. Zech, CADAM: Objectives,