HAL Id: cea-02265777
https://hal-cea.archives-ouvertes.fr/cea-02265777
Submitted on 12 Aug 2019HAL is a multi-disciplinary open access archive for the deposit and dissemination of sci-entific research documents, whether they are pub-lished or not. The documents may come from teaching and research institutions in France or abroad, or from public or private research centers.
L’archive ouverte pluridisciplinaire HAL, est destinée au dépôt et à la diffusion de documents scientifiques de niveau recherche, publiés ou non, émanant des établissements d’enseignement et de recherche français ou étrangers, des laboratoires publics ou privés.
Optimization of discharges with ion cyclotron range of
frequencies using local gas injection in EAST
Guillaume Urbanczyk, X.Z. Zhang, Y. Cheng, L. Colas, W. Helou, S. Yuan,
C.M. Qin, Y. Zhao, J.H. Wang, L. Liu, et al.
To cite this version:
Guillaume Urbanczyk, X.Z. Zhang, Y. Cheng, L. Colas, W. Helou, et al.. Optimization of discharges with ion cyclotron range of frequencies using local gas injection in EAST. Nuclear Fusion, IOP Pub-lishing, 2019, 59 (6), pp.066023. �10.1088/1741-4326/ab1610�. �cea-02265777�
Optimization of discharges with ICRF using
local gas injection in EAST
G. Urbanczyk1,2, X. Z. Zhang1, Y. Cheng1, L. Colas2, W. Helou2, S. Yuan1, C. M. Qin1, Y. P. Zhao1, J. H. Wang1, L. N. Liu1, J. G. Li1
1 Institute of Plasma Physics, Chinese Academy of Sciences, Hefei 230031, People’s
Republic of China
2
CEA, IRFM, F-13108 Saint Paul-Lez-Durance, France.
3
University of Science and Technology of China, Hefei 230026, People’s Republic of China
4 Université de Lorraine-CNRS UMR 7198 BP 70239 FST_IJL F-54506 Vandoeuvre
E-mail: guillaume.urbanczyk@cea.fr; xjzhang@ipp.ac.cn
Abstract. In view of improving Ion Cyclotron Range of Frequencies (ICRF) wave
coupling in EAST (Experimental Advanced Superconducting Tokamak) necessary to obtain high-power discharges, two series of experiments in L-mode were devoted to the use of local gas injection as a tool to increase density in front of the antennas. During the first session, the quantity of deuterium simultaneously puffed from five different poloidal positions on each side of one ICRF antenna was gradually increased. Steady gas puffing on this antenna (~8.1020e/s) increased antenna coupling resistance by 100%, but puffing more gas did not provoke any further improvement. Plasma central electron density was not kept constant when using local puff but kept
increasing during the discharges. During the second session, the global density was well-controlled and remained constant, the distance between the separatrix and the first wall was increased by 2cm allowing, the gas to spread better, and puffing more gas this time lead to better wave coupling. The same amount of gas was then puffed from three different locations and changes in SOL (Scrape-Off Layer) parameters were measured from several locations. Extensive analysis of the edge diagnostics made it possible to observe an electron density increase and a temperature decrease caused by the ionization of neutrals in the SOL. Heat loads on the divertor targets were slightly mitigated by gas injection, which is favorable from the perspective of long pulse scenario development. Injection at mid-plane led to the best results with the highest coupling simultaneously achieved for both antennas and smallest heat loads on the divertor target (below 1MW/m²). As far as wave coupling efficiency is concerned, most experimental trends were also successfully reproduced by antenna modelling with the RAPLICASOL finite element code with experimental density profiles from reflectometry as the main input.
Keywords: Local gas injection, SOL, ICRF, wave coupling
PACS: 07.79.-v, 84.40.Ba, 94.05.Rx, 94.20.Fg
1. Introduction
Ion Cyclotron Range of Frequencies (ICRF) waves are used on many tokamaks for plasma heating and current drive. Coupling maximum power while still staying within the limitations of the system, above which arcs may occur [1], and remaining in well-matched conditions despite strongly intermittent plasma, are important challenges for this auxiliary heating system – not to mention difficulties to mitigate radiofrequency sheath formation [2] and core contamination by impurities [3] –. As the plasma density falls below a critical cut-off density – typically on the order of 1018m-3 for present day tokamaks – waves become evanescent, meaning they cannot propagate and are reflected. Such conditions are often met
in the Scrape-Off Layer (SOL) of present tokamaks: antennas cannot be located too close to the main plasma where heat loads would reach unacceptable levels. In order to maximize the coupling efficiency, one can either act on wave numbers (spectrum) often at the expense of lower absorption efficiency in the core, or try to minimize the width of the evanescent layer by increasing the density in the SOL. For this purpose, gas (usually deuterium) can be puffed locally right in front of the antenna in order to improve wave coupling by preserving optimal absorptivity properties. Experimental proof of the efficiency of this technique mostly in terms of wave coupling improvement and also impurity content mitigation, were provided by several devices such as ASDEX Upgrade [2], JET [3], DIII-D [4] and others. All experimental evidence was extensively reviewed in ref. [1], while optimal ways to puff the gas were studied by W. Zhang through simulations with EMC3-EIRENE code for several machines [4, 5]. In those studies, a decrease of the plasma impurity content was observed and is directly attributed to wave coupling improvement, leading to lower RF near fields and specifically the slow wave mode, known for playing a key role in RF sheath rectification. Yet no study was able to determine properly whether the source of impurities is reduced, or their transport in the SOL is modified by gas puffing. Beyond improving wave coupling by shortening the evanescence layers, the present study aims at understanding the physical processes driven by local gas puffing, in view of explaining its effect on the SOL and assess their assets and drawbacks as a potential tool for high power steady states discharges. Note the link between gas injection and waves coupling can be very complex as it involves several steps that can hardly be consistently all studied experimentally; neutrals diffusion, plasma transport, recycling, and cutoff layer displacement at different positions in front of an ICRF antenna.
In the Experimental Advanced Superconducting Tokamak (EAST), two series of experiments aimed at determining the advantages and disadvantages of local gas puffing in L-mode discharges with Ion Cyclotron Resonance Heating (ICRH). The choice of working only in L-mode is justified by good ICRF coupling and the need to obtain good quality measurements from edge diagnostics, both of which are often very challenging in the ELMy H-mode SOL. In this paper, we first introduce EAST and the diagnostics used in this study, detailing their location in the machine and the magnetic connections with both ICRF antennas. Then the protocol used for both experimental sessions are introduced before discussing their
results around three main points; wave coupling, SOL parameters modification at mid-plane and divertor regions and residual RF fields in the SOL. In the last section antenna modelling results in support of the experiment are discussed.
2. EAST experimental setup
2.1. Presentation of EAST parameters and diagnostics used in this study
EAST is a superconducting device equipped with two divertors allowing lower, double and upper single null (USN) configurations. Because the lower divertor was still in carbon, this study only focuses on the upper tungsten divertor, operating in USN configuration. The typical plasma parameters were as follows: toroidal magnetic field Bt≈2.3T, plasma current
Ip=500kA (q95=5) during the 2016 session and Ip=400kA (q95=6) during the 2017 session,
major radius Rout≈1.85m, minor radius a≈0.44m, triangularity δ≈0.3-0.6 and elongation
κ≈1.65. Auxiliary heating systems are composed of two Lower Hybrid Current Drive (LHCD) grills respectively located in E-port (4.6 GHz and 2<n||< 3) and N-port (2.45 GHz and 1.8< n||
<2.5) [7], and two ICRF antennas located in B-port (31.5 MHz) and I-port (35 MHz) (see Fig. 1) [8]. The B-port antenna excites a spectrum of plane waves peaked typically at k||≈12.5 m
-1
for which the R cutoff density is nCO≈6.3.10 18
m-3. The I-port antenna typical parallel wavevector is k||≈13.6 m
-1
with a cutoff density of nCO≈9.10 18
m-3. In order to optimize the ICRF heating efficiency, both systems were operated in dipole phasing and the total power at generators for each antenna varied from 0.5 to 1 MW. Both antennas were setup to heat hydrogen minority (7%) in deuterium plasmas. At the RF frequency of the waves launched by the I-port antenna the fundamental H cyclotron resonance layer was located in the plasma center. In 2017 the operating frequency for the B-port antenna was changed from 34 down to 31.5 MHz and the fundamental H cyclotron resonance was slightly shifted off-axis. The routine fueling system at EAST is based on a group of valves located at the mid-plane just above the J and C ports which control relies on piezoelectric valves [9]. A Supersonic Molecular Beam Injector (SMBI) [10] is also used routinely for feedback control of the density as it only takes small quantities of gas to achieve good control, typically 9.1021 particles per second at constant pressure of about 1.5 bar. SMBI pulse typically last for 10ms and allow efficient fueling of plasma with maximal deposition around pedestal region. This is
a key asset particularly for long pulse operation when density control becomes of prime importance due to increased outgassing. Local deuterium puffing was first used to improve LH wave coupling in H-mode when the density drops at the edge [11, 12]. After successful results on the lower hybrid system, the technique has been applied to improve ICRF wave coupling which is in general, difficult in EAST. Independently from routine fueling valves, deuterium can now be puffed locally on each LH grill and ICRF antenna through distributed piezo-valves (Fig. 1b & 3c), and from the J-port through a single nozzle located at R=2.5m on the mid-plane (Fig. 1b & 3d), also equipped with a piezo valve. Injecting more gas is beneficial for wave coupling; this is a consensus shared among the RF community. For the development of scenarios, the question is whether coupling can be improved while minimally disturbing the rest of the plasma, in particular without degrading the pedestal in H-mode. In the present study, we did not try to mitigate the influence that gas puffing may have on H-mode pedestals, but choose to focus on its influence on the edge in absence of ELMs. Mostly to simplify the analysis of the edge diagnostics data, but also because EAST ICRF system [13] does not have very strong load resilience, operations in H-mode are not appropriate to the present study which is performed in L-mode.
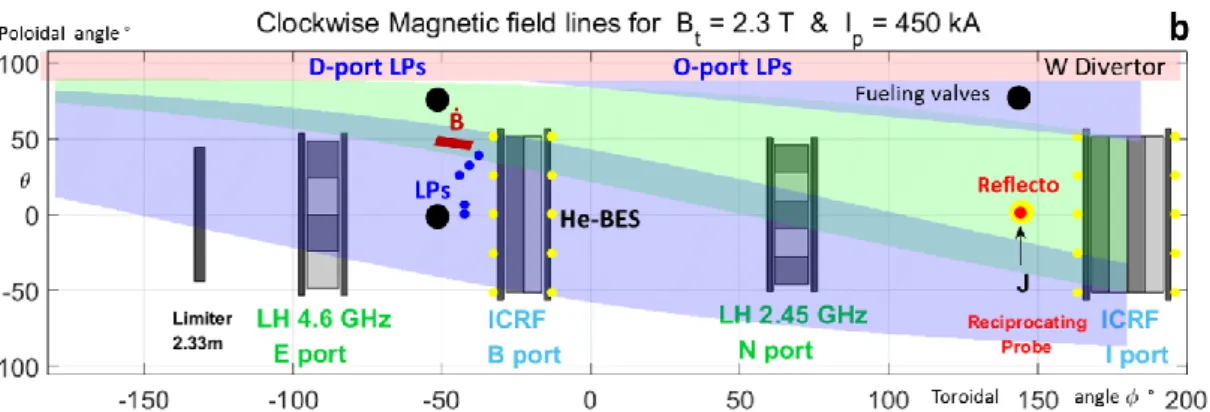
Figure 1. (a) Top view of EAST, with toroidal positions of heating systems and diagnostics used in the study materialized and (b) Toroidal-Poloidal 2D map showing magnetic connections between objects for a case (#75127) with q95=5.6 in between 2016 and 2017
experiments: Fixed and reciprocating Langmuir probes are indicated by blue and red dots, while gas puff valves are represented by yellow dots
The EAST ICRF antenna loading can be estimated by two different methods respectively based on voltage/current probes [13] and voltage probe arrays [14]. In this paper we will use the second technique which often gives more accurate results; for each shot, the maximum voltage Vmax is measured with voltage probe arrays in different points of each transmission
lines of characteristic impedance Z0 as shown on Fig. 2 – respectively near the stub tuner and
the antenna –. For coupling resistances calculation, we will preferentially use data of the probes that are close to the antennas. The transmitted power Ptrans was measured by the
directional coupler in front of each transmitter. A weakness of these assessments is that they neglect losses in the transmission lines so that Ptrans is equivalent to the power radiated by the
antenna. Coupling resistances are finally calculated for each line as follows Rc=2 Ptrans
Z0²/Vmax² with error smaller than 5%. In Fig. 4 and 5, only coupling resistances of one line per
antenna were represented as the others followed similar trends and values (#1 for B-port antenna (as shown in Fig. 13) and #5 for I-port antenna). Our poor knowledge of power losses in the transmission lines prevents us from accurately quantifying the absorption efficiency of the waves. We will therefore rather talk about ICRF system “heating efficiency” defined as the ratio of plasma energy increase per generator power, regardless of any losses over the whole system.
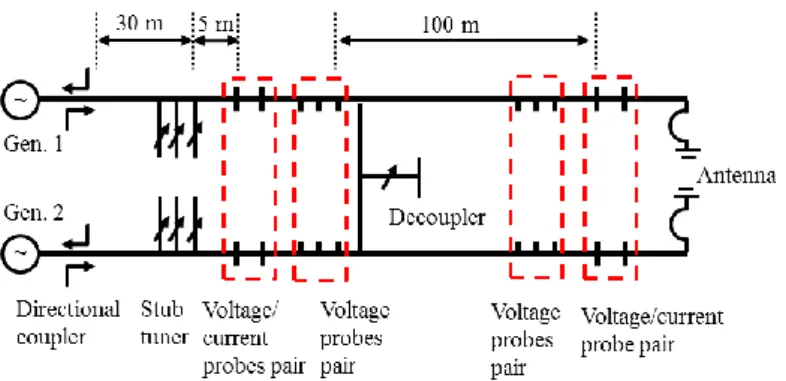
Figure 2. Schematic diagram of two (of eight) EAST-ICRF transmission networks. The distance between two sets of probe pairs is about 2.2 m. Courtesy [15].
As shown on Fig. 1a, a fast X-mode reflectometer in J-port provides electron density profiles [16]. As it is mostly used to measure core densities, specific effort was made to refine the edge region where gas is injected, spread and ionized. The mid-plane reciprocating Langmuir probe was used to measure the radial profiles of the SOL parameters in J-port [17] while Helium Beam Emission Spectroscopy (He-BES) in A-port [18] allows determining the SOL density and temperature profiles from different spectral line ratios. Helium is puffed from the A-port in the direction of the B-port and optic fibers are aligned on the toroidal plane and oriented towards the B-port with an angle of roughly 45° incidence with respect to the magnetic field lines, measuring parameters right in front of the antenna. Since the quantity of helium puffed by this diagnostic (~1018e/s) was always less than a tenth of the amount of deuterium which was continuously puffed during those discharges (1020e/s), this diagnostic was assumed to have negligible influence on the B-port ICRF wave coupling.
Langmuir probes were fixed at different poloidal positions from the mid-plane to the top left corner of the antenna (Fig. 3). The protective head design was optimized to mitigate sensitivity to the RF sheath by constraining the plasma to be sampled by lateral holes whose inner surface is approximately parallel to the magnetic field lines, preventing large sheath expansion [25]. Despite those design efforts to reduce sensitivity to the RF sheath, ongoing-upgrades are still needed to improve the probe’s data in the presence of ICRH.
Fig. 3. Two probes on the mid-plane and three to the top where the strongest RF sheath rectifications and heat loads are expected from previous studies (see [19, 20] and references therein). Note that every Langmuir probe is actually a triple probe, capable of high temporal resolution sampling at the expense of often stronger sensitivity in RF environments due to sheath rectification. Special effort was consequently put into optimizing the design of the three probes fixed to the top of the antenna. Inspired by tunnel probes [21] we added protective head that constrains the tips to sample the plasma from lateral holes, the area of which is less sensitive to sheath expansion than if the tip were entirely exposed to the plasma (Fig. 3 a & b) [25]. Furthermore, such a design offers the advantages of being much more robust as tips do not get eroded as fast as when directly exposed to the plasma, and the data reliability is also improved as only a small part of the tip is exposed, greatly diminishing global heat loads and expected to prevent occurrence of secondary electron emission. Despite those design efforts to reduce sensitivity to the RF sheath, ongoing-upgrades are still needed to improve the probe’s data in the presence of ICRH. In addition, eight B-dot probes were fixed to a corner of the B-port antenna (Fig. 3c), four of them having an aperture aligned with the magnetic field lines and the others having apertures perpendicular to the field lines, each type measuring fast and slow wave amplitudes, respectively [22].
Figure 3. (a) View of the Langmuir probe mounted emphasized by lateral holes to collect plasma (b) Exploded view of the same probe with each piece of material detailed
(c) Picture in EAST between C and B ports showing antenna lateral gas injectors, Langmuir and B-dot probes fixed in 2017 (d) Picture of the single nozzle valve in J-port mid-plane.
2.2. Experimental protocol
In order to develop tools to increase antenna coupling, and also investigate the side effects that local gas injection may have on the SOL, ICRF performance and heat loads, two series of experiments in L-mode were planned. Working in L-mode allowed both avoiding the difficult interpretation of the edge diagnostics in H-mode, and to coupling more relevant amounts of ICRF power to the plasma. The first experimental session took place in 2016 (Fig. 4a). Deuterium was only puffed from the B-port (Fig. 3c) in different quantities. No particular effort was made to keep the central electron density constant: as additional gas was locally puffed on top of the routine plasma fueling (kept constant), a large increase of the density was obtained, resulting first in antenna arcing and ultimately prompt disruptions. In 2016, three similar shots during ICRF power modulations between 0.5 and 1 MW were done. Both antennas were alternatively activated (Fig. 4a). A shot (#69942) was done using the routine fueling valves, while in others shots, gas was additionally puffed around the B-port all along three discharges at respective rates of 7.9 1020e/s (#69938), 9.1 1020e/s (#69939) and 11.4 1020e/s (#69940). The fact that no further improvement was observed when increasing the quantity of gas puffed (Fig. 6a) was believed to be related to a too short outer gap which was therefore increased during a later session.
The second session took place in 2017 (Fig. 4b) during which the density was well-controlled and kept constant throughout the experiment (Fig.4f) simply by reducing the gas injected by the main fueling valve. The outer gap was also increased to make the effect of the local gas puffing more obvious (Fig. 5). This time, gas was not only puffed around the B-port (#75194 & #75198) but also around the I-port (#75206) - the injection system of which has the same design as that of B-port - and from J-port (#75207) through a single valve at the mid-plane. The same quantity of gas (9.1 1020e/s) was puffed from each port. Shot #75214 serves as the reference discharge without other local injection but with routine fueling valves in operation.
gas puffing, especially when talking about the “no puff” case, one should understand that no gas was locally puffed from any of the locations discussed all along, but deuterium was of course injected from both the routine fueling valve and the SMBI (1 to 5% of plasma global fueling with short and strong injections spread along the discharge with often most intense use during the ramp-up phase).
Figure 4. Overview of plasma parameters evolution during 2016 (left panel) and 2017 (right panel) gas puff experiments. For the 2016 session: (a) central electron density (de-convoluted from interferometry data) for different gas rates, (b) RF powers, (c) bulk radiated power (from bolometer), (d) gas injection rates which were the same in 2017 and (e) plasma stored energy. For the 2017 session: (f) central electron density and plasma current, (g)
ICRH and LH powers, (h) plasma radiated power from bolometry, (i) probe reciprocations and (j) plasma energy from diamagnetic loops. Only one curve is plotted when the signal
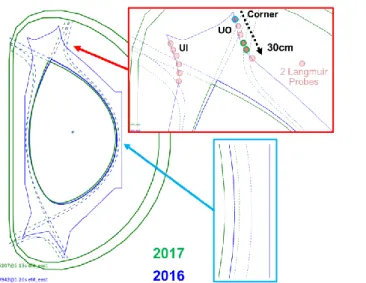
Figure 5. EFIT reconstruction of plasma equilibria during 2016 (blue) and 2017 (green) gas puff experiments. Both equilibria are superimposed and zoomed-in areas of interest have been
added. Matrices of red circles on the upper divertor represent pairs of Langmuir probes. Upper outer probes circled by blue and green roughly correspond to 2017 plasmas strike point
positions.
3. Experimental results
3.1. Effect of gas injection on ICRF antennas loading
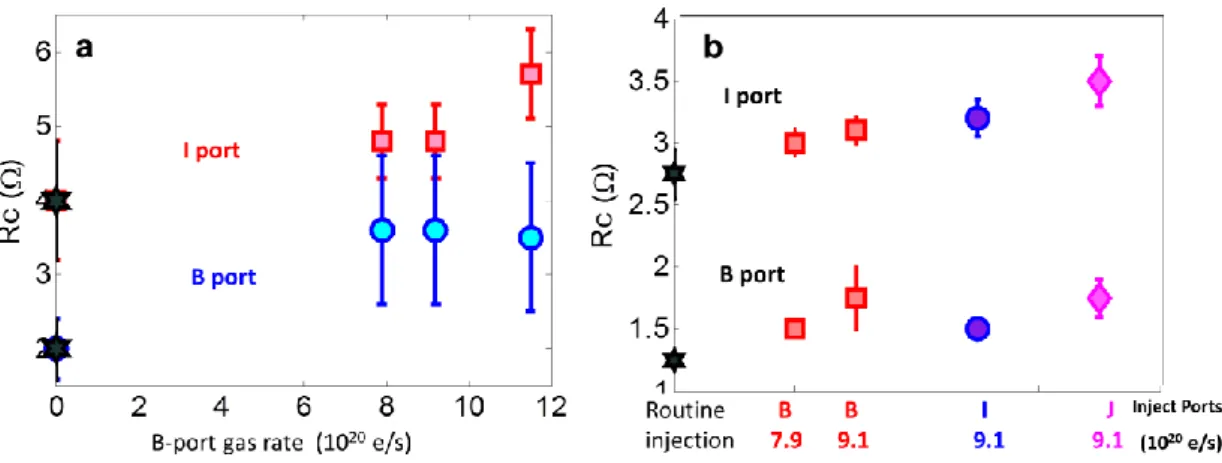
The B-port antenna (31.5MHz) usually has smaller coupling resistances than I-port antenna (35MHz) which is also twice bigger, therefore already in 2016, local gas injection was used in this region (Fig. 3c) with significant traces of coupling improvement with 8 1020e/s [14]. Surprisingly no further improvement was observed when increasing the quantity of gas puffed up to 11.4 1020e/s (Fig. 6a). Actually, when too much gas was puffed (11.4 1020e/s (#69940) and more than 2 1021e/s injected in total), arcing was observed in the B-port antenna, suggesting that part of the neutral gas is ionized inside the antenna box. A similar effect was observed in ASDEX when too much gas was injected close to the ICRF antenna side-limiters [2].
The saturation of the coupling improvement observed on the B-port antenna after a certain amount of local gas is injected (Fig.6a) is believed to be related to the port-B gas injection system design. The valves are poloidally distributed and are too close to the antenna limiters and to the separatrix, so that neutrals get ionized very quickly (before having time to
spread poloidally and toroidally) and the electrons are transported away from the antenna structure, especially near the top and bottom of the gas injection array. Loading resistance of the I-port antenna is also enhanced by puffing gas from the B-port (Fig.6a), whose top injection nozzles are magnetically connected to the I-port antenna (see Fig.1). In addition, when too much gas is injected, the local SOL may get saturated and a fraction of the injected neutrals may penetrate deeper in the plasma (or diffuse to the antenna box) and only get ionized inside the separatrix, causing a global rather than local density enhancement. One could claim that this is the result of a global increase of the density as shown on the top graph of Fig. 4a (central electron density) and could explain the further coupling enhancement observed on the I-port antenna when 12.1020 e/s are injected from the B-port valves. The results from the 2017 experiment also support this claim, as will be discussed later.
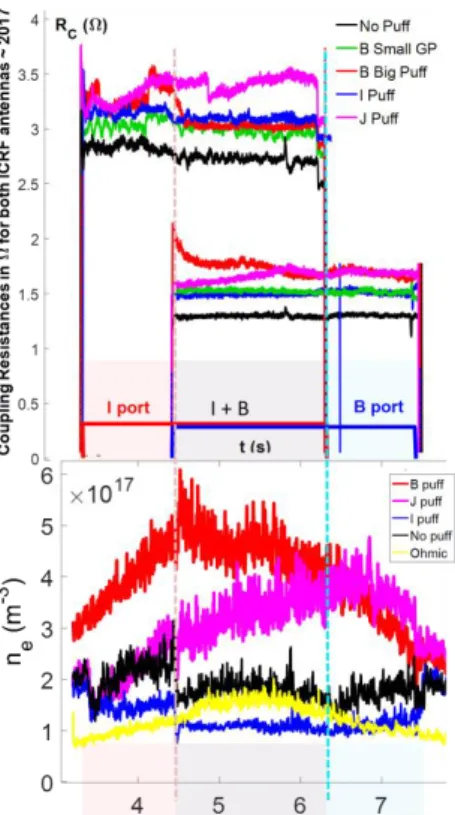
Figure 6. ICRF coupling resistance evolutions during the gas puffing experiments of 2016 (a) respectively routine puffing (#69942), 7.9 1020e/s (#69938), 9.1 1020e/s (#69939) and
11.4 1020e/s (#69940) and 2017 (b) routine injection with “no puff” (#75214), puffing on I-port (#75206), puffing on J-port (#75207) and puffing on B-port at two different rates
(#75194 & #75198).
In 2017, gas was puffed in similar amounts (~9.1 1020e/s) but from different locations around the torus; around both the ICRF antennas (with similar poloidally distributed injection arrays) and from the J-port mid-plane (a single nozzle retracted by 20cm with respect to the antenna limiters). In order to minimize the problem of premature gas ionization and convection away from the antenna, the outer gap was increased by 2cm so that unlike in the
2016 experiment (Fig. 5) the distance between the antenna straps and the cutoff layer would not reach a minimum as soon as a small quantity of gas was injected. As a consequence, different gas puffing rates from the B-port had indeed distinct influences on the wave coupling of the local antenna (Fig. 6b and 7). In other cases, gas was puffed in I and J ports in the same proportions as in the so-called “big puff” case in the B-port (~9.1 1020e/s). We first see that both antennas loadings always increase when using main chamber gas injection from any point compared to routine fueling. As expected, local gas injection from the B-port has a stronger effect on the B-port antenna loading and puffing from the I-port has a stronger impact on the I-port antenna loading but, as in 2016, cross-effects are also seen, particularly on the coupling resistance of the I-port antenna which is partially magnetically connected to the upper part of the B-port injection array. The effect of I-port puffing on the B-port antenna loading is weaker but visible, being roughly equivalent to the low gas puff level of local B-port injection (Fig.6b).
In the last case, gas was puffed from the single nozzle valve located at mid-plane and radially retracted as compared to the B and I ports injection systems that distribute gas near each antenna protection and in five different poloidal points from the bottom to the top of the antennas (Fig. 3c). Puffing on the J-port was the most successful, as coupling for both antennas simultaneously reached their highest levels. The effect is stronger for the I-port antenna, which is located much closer to the J-port valve injection point. Surprisingly, even the B-port antenna which is at the farthest possible location away from the valve experienced a coupling improvement to level similar to that of when the same amount of gas was directly puffed around the antenna itself. The fact that best coupling conditions are obtained with mid-plane valve is in agreement with previous experiments [1, 2, 3, 4] and simulations [5, 6] which show that best coupling efficiencies are achieved by puffing gas directly at the mid-plane instead of puffing it closer to the divertor, but the toroidal extension of the mid-plane gas injection enhancement observed in EAST is larger than what was observed in ASDEX [1,2] and in JET [3], which showed a gradual decrease in the coupling enhancement with the toroidal distance between the antennas and the mid-plane injection point. As mentioned, in general [1-6] mid-plane injection mainly helps increasing density around the toroidal location of the valve. The fact that mid-plane injection simultaneously improves
coupling of both antennas and that it has a similar effect as local gas injection (in particular for the B-port antenna) is a peculiarity of EAST that is not yet well-understood. We are in particular not able to say if this effect is homogeneous toroidally or only the fruit of fortunate connections between antennas and the region were the injected neutrals are ionized. A possible explanation could be related to a large neutral diffusion from the valve to the SOL. For EAST L-mode plasmas with SOL temperatures and densities respectively ranging as 10~70eV and 1018-1019m-3, neutrals ionization mean free path are estimated to be of the order of 3~11cm. Since J-port injection is radially retracted of 20cm with respect to the antenna limiters, the spreading of the neutral gas poloidally and toroidally is expected to be larger with respect to the injection at the antenna limiters. A similar case can be found in ASDEX Upgrade where neutrals typically diffuse inside a cone with a 90° angle from the valve, and their ionization starts at about 2eV with a rate increasing with Te. This type of injection typically results in a cosine-like distribution of neutrals relatively to the injection point as shown in Fig. 5 of [5]. For a given quantity of gas injected, higher density values are therefore expected in front of a single nozzle valve (like in J-port) compared to homogeneously distributed valves (like in I and B ports). A qualitative illustration of this effect is provided in the Appendix.
Note also that coupling resistances were all significantly higher during 2016 (Fig. 6a) than 2017 (Fig. 6b) experiments. This is partly due to the increased outer gap settings used in 2017 but it could also be related to the fact that higher LH power levels were applied during the first session (Fig. 5), which may facilitate the neutral gas ionization in the SOL. More dedicated experiments are necessary to understand the role that LH power may have on the SOL ionization processes and on the ICRH coupling enhancement. The toroidal repartition of LH launchers and ICRH antennas (Fig. 1a) could also explain the homogeneous effect observed with J-port mid-plane injection.
The next section uses several diagnostics data to provide local evidences of gas puffing influence on SOL parameters.
Figure 7. Time traces of ICRF coupling resistance and density ne measured with
Langmuir probes near B-port (Fig. 3) represented for the different pulses of the 2017 experiments.
3.2. Effect of gas injection on SOL parameters
In this section, we discuss side effects induced in the SOL parameters when injecting gas around the ICRF antennas from three different locations. We will focus on the 2017 experiments during which a complementary set of diagnostics were used in several locations to provide an overview as comprehensive as possible. We will start by analyzing the B-port region, using the Langmuir and B-dot probes shown on Fig. 3 together with He-BES (Helium beam) profiles, before looking at the J-port reciprocating probe and reflectometer profiles. ICRF system “heating performance” is also assessed by only looking at plasma energy (WENG)
improvement when powering ICRH (Fig. 9f) ΔWENG/PICRH. Note this method can give
somehow strange results since power losses in transmission lines are neglected while they should not, and the plasma energy content levels (Fig. 4j) are different before and after the phase with ICRH.
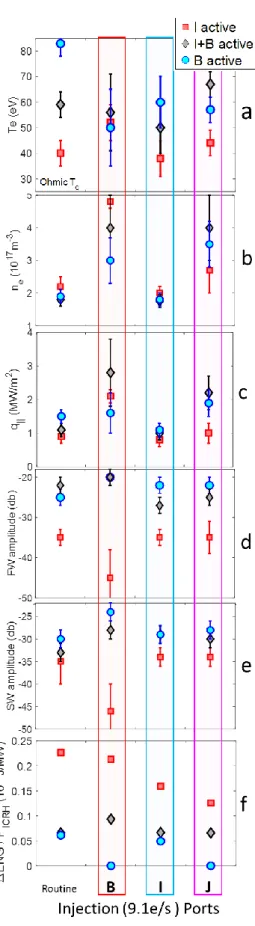
To give a slightly more global picture of SOL parameters change, data from the three top Langmuir probes shown in Fig. 3 were averaged (Fig. 8 (a, b, c)). Despite efforts made on
probes design, their inherent sensitivity to RF sheaths justified benchmarking these data with these of He-BES (Helium-Beam spectroscopy) (Fig. 9). Colored areas have been added on each graph to materialize time periods with different RF heating cases. Both diagnostics observed the global increase in density averaged over 50ms (Fig. 9b and Fig. 10) and decrease in temperature (Fig. 9a) caused by gas puffing. Only in the case of puffing on the I-port were the Langmuir probe density values anomalously small, which is believed to be a local effect as antenna coupling improved compared to the case without gas puffing (Fig. 6b). In the case of gas puffed on the B-port, the gas valve and probes proximity could explain particularly high values of the density locally. The density still reaches its peak as the B-port antenna is turned-on and then keeps decreasing, in good agreement with coupling resistances on Fig. 7. This is believed to be the consequence of the B-port-induced near fields at the origin of 𝐸 × 𝐵 density convection away from the antenna [24, 25]. In the case of gas puffed on the J-port though, as the valve is very far and not magnetically connected to the B-port, high density values are representative of a global increase. Heat loads seem strongly correlated with density variations. From the B-dot probes Fast (FW) and Slow wave (SW) amplitudes measurements can reveal interesting elements, yet analysis can be complex. We will then proceed by order of difficulty, starting at the time period with only the I-port antenna is active. In this case, FW and SW amplitudes are likely the result of far-field-induced perturbations as probes are far and screened from I-port antenna. While nothing is observed when the gas is puffed away from the probes, a large decrease in both FW and SW amplitudes is observed when gas is puffed from the B-port, either suggesting that probe apertures were obstructed by neutral gas, or that puffing gas could locally mitigate far-fields. Reproducibility on several shots is consistent, yet more probes will be fixed in order to assess to what extent such effects may be true. Having only the B-port antenna active is slightly more complex as not only should the launched wave near-field but also the unabsorbed wave-induced far-field be taken into account in the analysis. As coupling improves, one may expect smaller amplitudes of the RF near fields for given RF field amplitude in the plasma core. But as the heating efficiency is low (Fig. 8f), more power is expected to reflect back and induce far-fields in the probe region, which could explain higher field amplitudes with gas puffing. Such a mechanism is particularly consistent with the fact that while only the B-port is active,
SW amplitudes tend to increase as heating efficiencies decrease. In the specific case of gas puffed on the B-port though, notice that both FW and SW fields are higher, which contrary to the case when only the I-port antenna was active. This is believed to be due to near-fields enhanced propagation by high neutral density from the antenna to probes. The last case with both antennas active at the same time is too complex and won’t be discussed here From these results, it can be said that gas locally puffed on the B-port had a strong influence on the surrounding SOL parameters with density increasing (figure 7b and 8b), temperature decreasing (blue series in figure 7a and figure 8a), and apparent reduction of far-fields. In the case of gas puffed on the J-port mid-plane – far away and magnetically disconnected – similar effects on density and temperature profiles were observed. We now propose to take a closer look at the J-port region by analyzing the reflectometer and reciprocating probe profiles.
Figure 8. The B-port Langmuir and B-dot probes data evolution during the 2017 gas puff experiments: Electron temperature (a), density (b), parallel heat fluxes (c), ICRF Fast (d) and Slow (e) wave amplitudes and ICRF heating efficiency (f). Signals of the three triple probes at
the top of the antenna shown on Fig. 3 were averaged to give a more global and reliable picture of local gas puffing influence on their region.
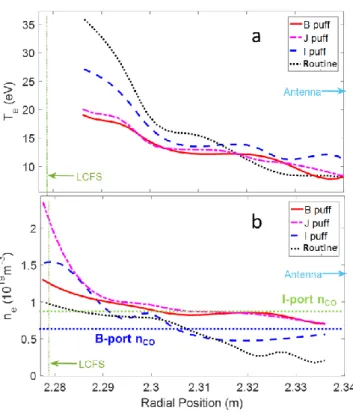
Figure 9. Electron temperature (a) and density (b) profiles from the A-port He-BES during the 2017 gas puffing experiments at 7 seconds (when only the B-port antenna was active) for
the four different fueling schemes
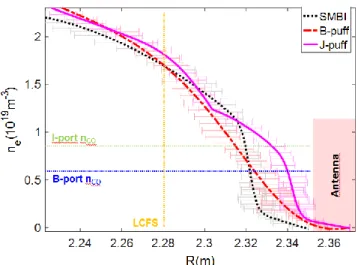
Reflectometer profiles averaged over 50ms for gas puffed from the B and J ports were plotted together with reference profiles of a typical shot with density feedback controlled by SMBI and without gas locally injected on the antenna (Fig. 10). The benefit of gas puffing over routine fueling clearly appears by increasing edge densities and significantly shortening the evanescence layer of the wave down by 2cm with the J-port mid-plane injection. According to He beam spectroscopy located near B-port, there is no difference in the cut-off position between B-port injection and J-port injection (Fig. 9b). The cutoff positions are also similar for “routine” and “I-port” fueling consistent with B-port antenna loading (Fig. 6b). Besides, according to the reflectometer located in J-port, the gas injection throughout J-port shortens the evanescence layer by 2cm compared to the B-port injection (Fig. 10), consistent with I-port antenna loading (Fig. 6b) [24]. Considering that part of the gas puffed around the
B-port might not contribute to an increase in density profile at the mid-plane and that the distance between the B-port and the reflectometer is rather large, could together explain why profiles during gas puffing on the B-port flatten a bit but do not improve as significantly as when gas was injected from the J-port mid-plane. Notice Helium beam density values are of roughly similar order of magnitudes, yet He-BES profiles are rather flat in the SOL.
The reciprocating probe was inserted twice per shot as can be seen on graph k of Fig. 4b. Moreover, as instances of gas puffed on the B-port were identical to those of routine puffing, they were not represented not to overload Fig. 11. Surprisingly in most cases no significant density increases were observed on the reciprocating probes due to gas puffing unlike the much more visible observation on the reflectometer profiles (Fig. 10). Known from precedent studies [25, 26, 27], strong local density convections due to local 𝐸 × 𝐵 drifts affect this region when the I-port antenna is active, which is for instance visible on the significant differences between dashed and solid curves of Fig. 11; higher potential gradients and consequently lower densities are measured when the I-port antenna is powered. Higher densities and lower potentials on the contrary are registered when the B-port antenna is powered, as it is far and magnetically disconnected from the probe (Fig. 1b). This suggests that a non-negligible part of the gas that is puffed is pumped-out and does not contribute to increasing the density in front of the antenna. In particular, note this edge density pump-out effect is much stronger when gas is puffed along I-port antenna height from ten points (blue curves) instead of from a single mid-plane valve (pink curves). Despite the lack of strong experimental proof, we would like to stress that this observation might also be the result of stronger potentials and therefore density convections at the antenna corners rather than at the mid-plane [20]. So far based on the SOL parameters modification in presently discussed cases, the mid-plane injection is advantageous for increasing the density in front of the ICRF antennas.
Figure 10. Density profiles from the J-port reflectometer in three different cases with the SMBI corresponding to the classic or routine case, and when gas was puffed from B and J ports. Cutoff densities of each antenna are also indicated to show the benefit of gas puff for
shortening the evanescence layer.
Figure 11. Electrons density (a) and floating potential (b) profiles from the J-port reciprocating Langmuir probe during the 2017 gas puff experiments. The ICRF antenna
limiters position (2.35m) is indicated in red. .
3.3. Gas injection and divertor heat loads
In order to get a wider picture of the influence of local gas injection on the SOL, the last aspect to be discussed concerns the divertor region. As the experiments we have done were all in USN (Upper Single Null) configuration, we will focus on the upper tungsten divertor outer targets in two different toroidal regions monitored by triple Langmuir probes arrays. So far we have seen on Fig. 8 that despite the cooling effects of the neutral gas on the SOL, density increase may lead to stronger heat loads on the antenna limiter, with q// ≈ γ jsat Te and γ
influence on the divertor region which could compromise the use of local gas injection for long pulse operations and scenarios with high heat fluxes. It was shown for the 2016 experiments that the ICRH-induced negative floating potentials can be greatly mitigated on most upper divertor probes with local gas injection, whereas ion fluxes, on the contrary, increase [28]. As was mentioned in the previous section, Langmuir probes are sensitive to RF sheath expansion which can make data interpretation more complex in cases with high RF power. In 2017, the same probe arrays (Ports D and O) on the Upper Outer (UO) divertor target – as represented on Fig. 5 – were used to estimate heat fluxes (Fig. 12). Highest values were recorded around the D-port nearby the divertor corner by the top pair of probes indicated by blue circles on Fig. 5. As shown in Fig. 12, gas injection generally helped reducing heat loads at the divertor target with best global mitigation (D and O ports simultaneously) under 1MW/m² achieved by injecting gas at the mid-plane (J-port puffing).
Note heat loads from each probe array have slightly different patterns that could possibly be attributed to toroidal asymmetries like these observed during ICRF operation in NSTX [30]. Since Langmuir probes are inherently sensitive to RF sheaths, different magnetic connections to ICRF antennas can lead to different results. Ideally this diagnostic should be benchmarked by another one insensitive to sheath rectification like IR camera; However this diagnostics data are not trustworthy due to the absence of calibration of the emissivity of EAST tungsten divertor monoblocks that are furthermore daily coated with lithium.
Figure 12. Upper Outer divertor target heat loads profiles from both D and O ports Langmuir probe [29] arrays in each case of gas injection
4. Coupling simulations with RAPLICASOL
Simulations were made in order to test whether or not the experimental trends are reproducible with an antenna code using experimentally measured 1D density profiles (Fig. 10) as the main input – which can be inaccurate in one case that will be discussed in details –. RAPLICASOL [30] is a 3D code based on finite element method allowing calculations of RF wave coupling for Ion Cyclotron Antenna in the SOL by solving Maxwell’s equations in the cold plasma approximation without sheath or any non-linear phenomenon. Its results are in principle comparable with other antenna codes based on different numerical methods like TOPICA [32] or HFSS [33]. In our case, RAPLICASOL takes as input the 3D antenna geometry flattened to simply delimitate vacuum from plasma regions by a plane. The antenna is then put in vacuum and radiates into the plasma whose properties can be tuned by playing on dielectric tensor components. In the present case of EAST (Fig. 13), the antenna (B-port
design without Faraday Screen) typically radiates waves at 31.5MHz on a 10 cm wide cold deuterium plasma with 7% hydrogen minority, magnetic field lines tilted at 7° with respect to the toroidal direction and radial density profiles from reflectometry data (Fig. 10). Perfectly Matched Layers (PMLs) [34] are further used behind the plasma to emulate radiation at infinity. Finally, perfect electric conductor conditions are enforced on all the boundaries, except the four coaxial ports of characteristic impedance Z0=50Ω, each lumped excited by 1A
in dipole phasing. Note reality may be different from exact dipole phasing case as phases on straps were not feedback controlled [34]. The absence of a Faraday Screen in the imported CAD model could furthermore lead to slight overestimations of the coupling, but this simplification allows significant mesh reduction and therefore reduces the time of resolution and memory consumption which was already at the limit of our workstation. As we only discuss the relative impact on coupling resistances, such simplification is therefore acceptable. In the first case of density controlled by the SMBI (Fig. 10), density is rather small at the edge. Total power transmitted to the PML is assessed by integrating the Pointing vector at the plasma/PML interface and equals 580kW for total power over 600kW on ports. For this ideal case, note voltages are identical or opposite to impedance values Z (Ω) since ±1A were applied on each port, which will be different in the red series of Fig. 14. If we note Г=(Z-Zo)/(Z+Zo) the reflection coefficient at any point of the transmission line, coupling resistances for each port can then be estimated as Rc = Zo (1-| Г|)/(1+| Г|).
Figure 13. Antenna flat model with four straps in vacuum seen from the back radiating into EAST plasma surrounded by PMLs.
Most reliable density profiles are given by J-port reflectometer and were used as inputs for modelling the B-port antenna loading. The absence of magnetic connections between B and J ports raises the question rather if the reflectometer measured densities consistent with those in front B-port antenna. Since no strong difference was observed in terms of coupling from antennas at opposite toroidal positions (Fig. 6b), we assume the density profiles at one location relatively homogeneous toroidally. When gas was injected from the B-port, density increased in the SOL but the position of the cutoff layer remained the same as with routine injection as shown on Fig 10. The impact on wave coupling appeared limited in the modeling whereas improvements were experimentally observed.
When gas was injected from the J-port mid-plane though, density clearly increased in the SOL, significantly shortening the distance of the strap-to-cutoff layer. Wave coupling was indeed much better with an increase in coupling resistances of each line (J-port mid-plane in Fig. 14), and a 23% increase of power to the PMLs.
Figure 14. Comparison of experimentally measured (black series) and simulated coupling resistances of B-port antenna in three different gas injection cases; routine fueling with SMBI
for feedback control, injection on B-port from 10 different points (Fig. 3c), and injection on J-port from a single valve located at mid-plane.
Those cases nevertheless stand for ideal inductive excitation of each port by 1A of current. In reality, power was not balanced on the straps, so it’s worth looking at slightly more realistic cases with the correct input power on each port as shown below. Since incertitude persists on phases, we will run those simulations assuming dipole phasing at the antenna.
Figure 15. Ey fields (y component of the electric field) with arrows representing power flow extracted at the toroidal-radial plane at poloidal height Z =-0.2 (straps #2 and #4) with ideal
and experimental power inputs.
From previous results we know that the J-port reflectometer was not able to catch the beneficial influence of the B-port gas puffing on the antenna coupling since despite slight changes in the shape of the profile (Fig. 10), cutoff density position was not moved closer enough to make any significant difference. We finally made simulations slightly more realistic by basing them on experimental power inputs on each port and represent them by the red
series in Fig. 14.
The total power from all the ports is now fixed to 600kW and unequally balanced on 3 ports as it was during the experiment. The beneficial impact of gas injection on the J-port still appears on coupling resistances as for previous cases, and it can furthermore be seen looking at current values on ports that are lowered due to improved wave coupling. In practice, it means power can be increased further at the generator without arcing.
From an RF study point of view, we can briefly comment on the 2D field maps extracted on the toroidal-radial plane at poloidal height Z=-20cm intercepting straps #2 and #4 (Fig. 15) in the two different routine fueling cases respectively. Experimental unbalanced power inputs lead to much higher electric fields in some regions where currents are badly compensated, and where one can expect RF sheath formation and stronger interactions [36]. Both poloidal and toroidal asymmetries might also cause further scenario problems like bad wave absorption and larger impact of far-fields. Note we assumed ideal dipole phasing which is far from guaranteed considering absence of real-time control, so that the real situation might even be worse. Further details would lead too far beyond the scope of the present study and will be the object of another paper devoted to characterization of the EAST ICRF antenna near-field patterns both through experiments and modelling with other devoted codes like SSWICH [37].
5. Conclusion and prospects
In order to improve ICRF (Ion Cyclotron Range of Frequencies) wave coupling in EAST, two series of experiments in L-mode were devoted to the study of local gas injection influence on plasma performances during RF heated discharges. Antennas loadings, SOL (Scrape-Off Layer) parameters modification and heat loads on divertor target were studied and discussed.
The first series of experiments consisted in increasing the quantity of deuterium puffed around the B-port antenna shot to shot, using an array of poloidally distributed gas injection valves close to the antenna limiters. The B-port antenna loading almost doubled – roughly from 2Ω up to 3.5~4Ω – with deuterium injection of 8 1020
e/s while more gas did not trigger further improvement. Surprisingly, the coupling resistance of the I-port antenna (located at the opposite side of the torus) also increased with B-port gas injection. In the case of very strong puffing though (11.4 1020e/s), the B-port antenna arced. Higher puffing levels resulted in prompt disruptions.
The second series of experiments mostly consisted of injecting the same amounts of gas (9.1 1020e/s) from different locations – respectively the B, I and J ports – though a couple of shots were devoted to study the impact of the gas level injected from port-B on the RF coupling after having increased the outer gap of 2cm. Such an increase was inferred to let gas spread better and indeed permitted the observation of different levels of antenna loading with respect to different amounts of gas injected: 1.5Ω for the injection of 7.9 1020e/s and 1.7Ω for the injection of 9.1 1020e/s for the B-port antenna. During the rest of the experiment, the same quantity of deuterium was injected from three ports, and main goal was to compare different injection system designs. In the I and B ports, gas was injected on both sides of the respective antennas from 5 points equally spaced along antenna’s poloidal height, whereas in the J-port, all gas is puffed from a single nozzle valve at mid-plane, retracted ~20cm from the radial antenna position. The SOL was monitored from different locations by helium beam, reflectometry, fixed and reciprocating Langmuir probes, which all measured electrons density increase and temperature decrease caused by neutrals ionization, consistent with experimental results of others devices [1-4]. B-dot probes were also used for the first time to measure fast and slow waves amplitudes around the B-port, but these data are complex to analyze and
longer commissioning is needed to improve our interpretation.
Common to all machines [1-6] is the fact that mid-plane injection maximizes nearby antenna loading. Specific to EAST is the fact that this effect is observed at least in two opposite toroidal locations; Best performances were indeed simultaneously reached for both antennas using mid-plane injection nearby one antenna and far from the other. Moreover, despite the poor magnetic connections between both antennas and their respective valves, in all cases, all antennas loadings increased with local injection with respect to routine fueling, showing the complexity of the gas diffusion and ionization processes in the scrape-off layer when different valve geometries are concerned. A possible explanation is related to the proximity of the B-port and I-port injection valves to the plasma separatrix, which allows the neutral gas to get ionized very quickly (before having time to spread poloidally and toroidally) so that the electrons produced near the top and bottom of the injection array are transported away from the antenna structure, causing a global rather than local SOL density enhancement. Heat loads on divertor target globally decreased with local gas injection, with most global mitigation also achieved with mid-plane puffing. Further studies are needed to optimize the gas injection system in terms of design, taking into account plasma parameters, influence of LH power, transport of neutral gas in the SOL and ionized particles in the plasma.
The modelling tool for antenna loading calculations based on finite element methods (RAPLICASOL) and taking reflectometer density profiles as input, was able to reproduce key experimental trends. Further modelling for instance with EMC3-Eirene code [5, 6, 39, 41] would also be suitable to have a better picture of how gas is ionized and transported in EAST. This would further be of prime importance to assess if these results could be extrapolated to larger devices. Despite much larger scales in ITER, engineering and operational constraints (q95 ≈ 3 [38]), mid-plane valves are envisaged toroidally adjacent to antennas and radially
remote enough to let the gas cloud spread over the antenna surface [39]. As for DEMO, another concept of ICRF antennas so called TWA (Travelling Wave Antenna) is foreseen [40], which may be distributed through 360° toroidally and poloidally located in the outer top of the vessel. With such design, modelling suggests that the use of local valves distributed all along the antenna is the best to improve wave coupling [41].
Appendix
With poloidally distributed valves (Fig. 3d), gas ionized in front of top and bottom injection points follows magnetic flux tubes that are weakly connected to the antenna’s front face. Part of the gas likely does not help increasing much the density in front of antennas, but might increase density more uniformly in both poloidal and toroidal directions with a smaller maximum [5, 6]. This could explain why larger injections from distributed valves are necessary to reach similar coupling as with a single mid-plane valve.
Figure A. Comparison of single mid-plane vs poloidally distributed valves contribution to local density increase for same injection rate
In Fig. A, each black arrow corresponds to injection points 3cm behind antenna limiter edge (Fig. 3c) such that neutrals are almost immediately ionized and do not diffuse much considering the relatively low valve pressure injecting gas at subsonic levels. The J-port nozzle valve (Fig. 3d) is about 20cm behind the antenna leading edge (represented in Fig.A as the large magenta arrow). Therefore neutrals can diffuse more before getting ionized. In most neutral transport codes [5, 6], As can also be seen in simulations of neutrals diffusive transport from a fueling valve up to the SOL made with DEGAS 2 code [42], the further we look radially away from an injection point, the more spread is the density increase. For a given quantity of gas injected, we define the density increase factor α as the ratio of the maximal density obtained at the antenna aperture (R=Rant) with poloidally distributed valves, against the same quantity with routine fueling:
_ _ _
max ( )
max ( )
R Rant e polo distrib valve R Rant e routine fueling
n n
(1)
α=1 would for instance mean that the maximal density obtained with poloidally distributed valves is equivalent to this obtained with routine fueling scheme. α=2 would mean that maximal density reachable with distributed valves can be twice larger than what routine fueling would lead to. Fig. A shows that density at the mid-plane would typically increase more with the mid-plane valve rather than with five poloidally distributed injections with the same gas rate. At the corners however density increase could be higher with distributed valves, which is typically important for LH launchers whose wavelength is short and waveguides small and covering whole antenna’s height. Though these regions are basically out of interest for the coupling of ICRF waves as their wavelength is much longer then LH and current straps are closer to the mid-plane. This approach strictly stands for neutrals diffusion from the valve and does not take into account ionized particles transport. We acknowledge this explanation is rather speculative and not only lacks of physical ingredients such as recycling, but mostly of experimental proofs. Note this explanation can justify that J-port valve has a bigger impact on I-port loading than its own distributed valves. It can however hardly be used to discuss J-port valve impact on B-port antenna loading, not only since there is no apparent magnetic connection, but also because of possible toroidal attenuation of density perturbation as seen in ASDEX Upgrade [2] and JET [3] due to poloidal and/or radial spreading.
Acknowledgments
The whole EAST ICRH team and diagnostician colleagues who helped with collecting and post processing data used in this study are warmly acknowledged.
This work was supported partly by National key research and development program (grant nos 2016YFA0400600 and 2016YFA0400601). This work was supported partly by National Magnetic confinement Fusion Science Program (grant nos 2015GB101001). This work was also supported partly by the National Natural Science Foundation of China under grant nos 11675213, 11375235 and 11375236.
This work has been carried out within the framework of the EUROfusion Consortium and has received funding from the Euratom research and training program 2014-2018 under grant
agreement No 633053. The views and opinions expressed herein do not necessarily reflect those of the European Commission.
References
[1] P. Jacquet et al. Nucl. Fusion 56 (2016) 046001
[2] V. Bobkov et al. AIP Conference Proceedings 1689, 030004 (2015); doi: 10.1063/1.4936469
[3] E. Lerche et al, Journal of Nuclear Materials 463 (2015) 634–639 [4] R. I. Pinsker et al, AIP Conference Proceedings 1406, 313 (2011) [5] W. Zhang et al Nucl. Fusion 56 (2016) 036007
[6] W. Zhang et al Nucl. Fusion 57 (2017) 056042 [7] M. H. Li et al. Physics of Plasmas 23, 102512 (2016) [8] X. J. Zhang et al. 2011 Plasma Sci. Technol. 13 172 [9] Q. P. Yuan et al 2009 Plasma Sci. Technol. 11 231
[10]X. W. Zheng et al 2013 Plasma Phys. Control. Fusion 55 115010 [11] E. H. Kong et al 2013 Plasma Phys. Control. Fusion 55 065007 [12] E. H. Kong et al 2013 Plasma Phys. Control. Fusion 55 065008 [13] J.H. Wang et al. Fusion Engineering and Design 122 (2017) 196–203 [14] J.H. Zhang et al. 2017 Nucl. Fusion 57 066030
[15] Jianhua WANG et al 2018 Plasma Sci. Technol. 20 045603 [16] S. Zhang et al 2014 Plasma Sci. and Technol. 16 311
[17] W. Zhang et al Rev. Sci. Instrum. 81, 113501 (2010)
[18] O. Schmitz et al 2008 Plasma Phys. Control. Fusion 50 115004 [19] L. Colas et al Plasma Phys. Control. Fusion 49 (2007) B35–B45 [20] V. Bobkov et al 2010 Nucl. Fusion 50 035004
[21] J. P. Gunn et al J. Phys. Conf. Ser. 700, 012018 (2016) [22] R. Ochoukov EPJ Web of Conferences 157, 03038 (2017) [23] Y. Q. Yang et al 2017 Plasma Phys. Control. Fusion 59 095001
[24] A Messiaen and R Weynants 2011 Plasma Phys. Control. Fusion 53 085020 [25] G. Urbanczyk et al EPJ Web of Conferences 157, 03057 (2017)
[26] M. Bécoulet et al Phys. Plasmas, Vol. 9, No. 6, 2002
[27] K. K. Kirov et al. 2009 Plasma Phys. Control. Fusion 51 044003 [28] R. Perkins et al EPJ Web of Conferences 157, 03039 (2017) [29] J.C. Xu et al, Review of Scientific Instruments 87, 083504 (2016) [30] R. Perkins et al Physical Review Letters 109(4) · July 2012 [31] J. Jacquot et al, Proc.21th RF Top. Conf 1689 (2015) [32] V. Lancellotti et Nucl. Fusion 46(2006) S476-S499
[33] Ansoft, ANSYS HFSS, 3D Full-wave Electromagnetic Field Simulation (2014-2015), U4L http://www.ansoft.com/products/hf/hfss/
[34] J. Berenger, Journal of computational physics 114,185 (1994) [35] Z. Chen et al. Nucl. Sci. Tech. (2018) 29 19
[37] L. Lu et al, Plasma Phys. Control. Fusion 60 (2018) 035003 [38] A.C.C. Sips et al 2018 Nucl. Fusion 58 126010
[39] W. Zhang "Scrape-off layer density tailoring with local gas puffing to maximize ICRF power coupling in ITER" International Conference on Plasma Surface Interactions in Controlled Fusion Devices (Princeton, USA 2018)
[40] R. Ragona and A. Messiaen 2016 Nucl. Fusion 56 076009 [41] W. Zhang et al Nucl. Fusion 58 (2018) 126005
[42] D.P. Stoler, ARIES Meeting May 2010
![Fig. 3. Two probes on the mid-plane and three to the top where the strongest RF sheath rectifications and heat loads are expected from previous studies (see [19, 20] and references therein)](https://thumb-eu.123doks.com/thumbv2/123doknet/12958541.376564/9.892.149.746.717.1064/probes-strongest-sheath-rectifications-expected-previous-studies-references.webp)
![Figure 12. Upper Outer divertor target heat loads profiles from both D and O ports Langmuir probe [29] arrays in each case of gas injection](https://thumb-eu.123doks.com/thumbv2/123doknet/12958541.376564/24.892.238.646.121.584/figure-upper-outer-divertor-target-profiles-langmuir-injection.webp)
