HAL Id: hal-01699496
https://hal.archives-ouvertes.fr/hal-01699496
Submitted on 2 May 2019HAL is a multi-disciplinary open access archive for the deposit and dissemination of sci-entific research documents, whether they are pub-lished or not. The documents may come from teaching and research institutions in France or abroad, or from public or private research centers.
L’archive ouverte pluridisciplinaire HAL, est destinée au dépôt et à la diffusion de documents scientifiques de niveau recherche, publiés ou non, émanant des établissements d’enseignement et de recherche français ou étrangers, des laboratoires publics ou privés.
Glacier extent in sub-Antarctic Kerguelen archipelago
from MIS 3 period: Evidence from 36Cl dating
Vincent Jomelli, Irene Schimmelpfennig, Vincent Favier, Fatima Mokadem,
Amaelle Landais, Vincent Rinterknecht, Daniel Brunstein, Deborah Verfaillie,
Claude Legentil, Georges Aumaitre, et al.
To cite this version:
Vincent Jomelli, Irene Schimmelpfennig, Vincent Favier, Fatima Mokadem, Amaelle Landais, et al.. Glacier extent in sub-Antarctic Kerguelen archipelago from MIS 3 period: Evidence from 36Cl dating. Quaternary Science Reviews, Elsevier, 2018, 183, pp.110-123. �10.1016/j.quascirev.2018.01.008�. �hal-01699496�
1 1
Glacier extent in sub-Antarctic Kerguelen Archipelago from MIS 3 period:
2Evidence from 36 Cl dating
34
Vincent Jomelli1*, Irene Schimmelpfennig2, Vincent Favier3, Fatima Mokadem1, Amaelle Landais4, 5
Vincent Rinterknecht1, Daniel Brunstein1-5,Deborah Verfaillie3, Claude Legentil1, Georges Aumaitre 2-6, 6
Didier L. Bourlès2-6, Karim Keddadouche2-6. 7
1- Université Paris 1 Panthéon-Sorbonne, CNRS Laboratoire de Géographie Physique, 92195 Meudon, 8
France.* corresponding author vincent.jomelli@lgp.cnrs.fr 9
2-Aix Marseille Univ, CNRS, IRD, Coll France, CEREGE, Aix-en-Provence, France 10
3- Univ. Grenoble Alpes, LGGE, Grenoble, CNRS, France. 11
4- Laboratoire des Sciences du Climat et de l'Environnement – IPSL, UMR8212, CEA-CNRS-UVSQ-UPS, 12
Gif sur Yvette, France 13
5- Università di Corsica - Pasquale Paoli, UMR CNRS 6240 LISA, Corte, France. 14 6- ASTER Team. 15 16 Abstract 17
Documenting sub-Antarctic glacier variations during the local last glacial maximum is of major interest to 18
better understand their sensitivity to atmospheric and oceanic temperature changes in conjunction with 19
Antarctic ice sheet changes. However, data are sparse because evidence of earlier glacier extents is for most 20
sub-Antarctic islands located offshore making their observation complex. Here, we present 22 cosmogenic 21
36Cl surface exposure ages obtained from five sites at Kerguelen to document the glacial history. The 36Cl 22
ages from roche moutonnee surfaces, erratics and boulders collected on moraines span from 41.9 ± 4.4 ka 23
to 14.3 ± 1.1 ka. Ice began to retreat on the eastern part of the main island before 41.4 ± 4.4 ka. Slow 24
deglaciation occurred from ~41 to ~ 29 ka. There is no evidence of advances between 29 ka and the Antarctic 25
Cold Reversal (ACR) period (~14.5-12.9 ka) period. During the ACR, however, the Bontemps and possibly 26
Belvedere moraines were formed by the advance of a Cook Ice Cap outlet glacier and a local glacier on the 27
Presque Ile Jeanne d’Arc, respectively. This glacier evolution differs partly from that of glaciers in New 28
2 Zealand and in Patagonia. These asynchronous glacier changes in the sub-Antarctic region are however in 29
agreement with sea surface temperature changes recorded around Antarctica, which suggest differences in 30
the climate evolution of the Indo-Pacific and Atlantic sectors of Antarctica. 31
32
Keywords: Glacier fluctuations, 36Cl cosmic-ray exposure dating, MIS 2-4, Kerguelen 33
34
Highlights
35
• Little is known about glacier fluctuations in sub-Antarctic regions. 36
• We present 22 cosmogenic 36Cl surface exposure ages in Kerguelen Islands. 37
• The 36Cl ages from erratic and moraine boulders span from 41 ka to 14 ka. 38
• Ice began to retreat on the eastern part of the main island before 41.4 ± 4.4 ka. 39
• Slow deglaciation occurred from ~41 to ~ 29 ka. 40
41
• This pattern of deglaciation partly differs from that of glaciers in New Zealand and in Patagonia due to 42
different regional climate conditions. 43 44 45 46 47 48 49 50
1. Introduction
51Hodgson et al (2014) published a synthesis of terrestrial and submarine evidence of the extent and timing 52
of the global Last Glacial Maximum (gLGM 26, 500-19, 000 years ago) (Clark et al., 2009) and the onset 53
of deglaciation on the maritime-Antarctic and sub-Antarctic islands in the framework of the Scientific 54
Committee for Antarctic Research (SCAR). Based on the lack of glacier chronologies or indirect evidence 55
of glacier extents from the local LGM (lLGM), Kerguelen archipelago, located in the Indian Ocean (49°S, 56
69°E; Fig 1), was classified as an area with a limited lLGM ice extent, but as subject to extensive earlier 57
continental shelf glaciations. The Kerguelen archipelago is, however, the largest currently glaciated area in 58
sub-Antarctic regions with numerous terrestrial glaciers. The Cook Ice Cap (CIC) and smaller glaciers 59
3 covered a total area of 520 km2 in 2009 (Berthier et al., 2009). These glaciers are known to be very sensitive 60
indicators of climate change in the southern polar region. Favier et al (2016) showed that the current high 61
wastage of the largest CIC outlet Ampere glacier was driven by atmospheric drying, which was induced by 62
a latitudinal shift of the storm track over the last decades. This latitudinal storm track shift is mainly driven 63
by the Southern Annular Mode, whose positive phase (SAM+) is associated with a belt of low pressure 64
surrounding Antarctica (Thompson and Wallace, 2000; Thompson et al., 2011). In addition, Jomelli et al 65
(2017) provided chronological evidences of a general glacier retreat since the Late Glacial in Kerguelen and 66
suggested that this glacier retreat was concomitant with warming and snow accumulation decrease in 67
Antarctica, thus demonstrating the sensitivity of the CIC to climate change in the Antarctic region. 68
69
Considering this connection between glaciers in Kerguelen and Antarctic climate, new investigations on 70
glacier extensions during and before the lLGM in Kerguelen is particularly relevant. It raises questions 71
regarding their relative pacing with Antarctic climate and ice sheet changes. Moreover, a comparison of 72
several ice core records from West and East Antarctic Ice Sheets revealed distinct variations, pointing to 73
differences in the climate evolution of the Indo-Pacific and Atlantic sectors of Antarctica (Stenni et al., 74
2010, 2011). A better knowledge of glacier changes at Kerguelen may be relevant to discussing possible 75
differences in glacier behavior between the Indo-Pacific and Atlantic sectors of sub-Antarctic regions. 76
77
To address these issues, a field campaign organized in the framework of two IPEV(Institut Paul Emile 78
Victor) programs (Kesacco and Glacepreker) was conducted focusing on the geomorphology and the 79
chronology of several glacially formed landscapes and deposits at the margin of the CIC with the aim to 80
document the timing and extent of the LGM in Kerguelen. Here, we present 22 new 36Cl cosmic-ray 81
exposure ages obtained from roche moutonnee surfaces, erratics and boulders collected on moraines over 82
the whole extent of the main island. 83 84 85 86
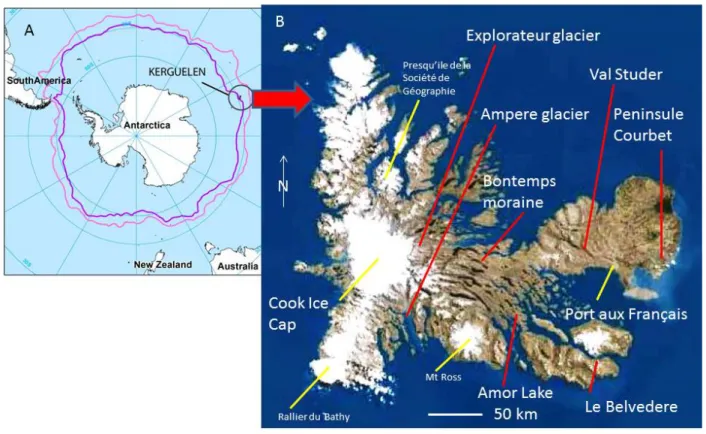
2. Study area
87The French Kerguelen basaltic archipelago is located in the southern Indian Ocean (49°N, 69°E) about 88
2000 km north of Antarctica. It is composed of one main island with an area of 6,700 km2 and about 300 89
smaller islands (Fig. 1) emerged from the Kerguelen oceanic plateau about 40 Ma ago. It stretches over a 90
distance of about 150 km. The western part of the archipelago is covered by the CIC, the largest ice cap on 91
this island (410 km2 in 2011, Verfaillie et al., 2015), which is culminating at 1,030 m above sea level (a.s.l.). 92
4 Glaciers are also present at the base of three summits, at Mont Ross 1,850 m a.s.l., the highest summit on 93
Kerguelen about 40 km south east of CIC, as well as on the highest slopes of Rallier du Bathy (1100 m a.s.l) 94
45 km south of CIC and on Presqu’ile de la Société de Géographie (1081 m a.s.l). The eastern part of the 95
archipelago forms an ice free peninsula with a mean elevation of 200 m a.s.l.. However, numerous undated 96
glacial features such as erratic boulders, kettles, and Rogen moraines demonstrate that this area was covered 97
by ice in the past (Hall, 1984). It is probable that evidence of earlier glacier extent exists off shore. To date, 98
a LGM frontal moraine may have been identified from bathymetry off shore from Ampere glacier (Jomelli 99
et al., 2017). 100
There is only one permanent weather station on the Kerguelen Islands, located at the scientific station Port 101
aux Français (PAF) (12 m a.s.l.) with daily values of temperature and precipitation available since 1951. 102
Here the mean annual temperature is 4.6°C with 800 mm of precipitation. However, the precipitation 103
amounts on the main island are affected by a strong W-E gradient due to foehn effect on the eastern side of 104
CIC, which constitutes a barrier to the dominant westerly winds. At CIC, the precipitation amount reaches 105
3,150 mm per year at 250 m a.s.l. (Verfaillie et al., 2015). 106
107
108 109
Fig. 1. General location of the study area. A. Map of the Kerguelen (black circle) and sub-Antarctic areas, with the
110
mean positions of the sub-Antarctic (pink) and polar (purple) oceanic fronts between 1993 and 2005. B. Red lines
5
show the five cosmogenic sample sites investigated in this study; yellow lines show geographic locations described in
112
the paper.
113 114
3. Previous glaciological studies on glaciers at Kerguelen
115The first glaciological investigations at Kerguelen were realized in the 1970s, during which surface energy 116
and mass balance studies (Poggi, 1977; Vallon, 1977a, 1977b, 1987) were conducted on Ampere glacier. 117
Additionally, satellite images made it possible to assess CIC wastage over the last decades (Berthier et al., 118
2009; Verfaillie, et al., 2015). During the last six years, new glaciological investigations were conducted at 119
Kerguelen. Ablation stakes were set up in December 2010 and January 2011 and were measured during the 120
next three years to assess the glacier surface mass balance. A total loss of 1.6 meter water equivalent per 121
year (m w.e. a-1) was measured over the ice cap between 1960 and 2011, with a maximum loss of 2.76 m 122
w.e. a-1 onAmpere glacier. From a detection attribution analysis, Favier et al. (2016) demonstrated that 123
precipitation decrease was the first order cause for glacier wastage since the 1960s. Precipitation changes 124
were attributed to a shift of the latitudinal position of the storm track mainly driven by the Southern Annular 125
Mode (SAM) whose positive phase (SAM+) is associated with a belt of low pressure surrounding Antarctica 126
(Thompson and Wallace, 2000; Thompson et al., 2011) and dry conditions at Kerguelen. 127
128
To better understand the long term evolution of glaciers at Kerguelen, 13 cosmogenic 36Cl surface exposure 129
ages were determined at four sites, one located close to Ampere glacier front position and three 20 km away 130
from the CIC (Jomelli et al., 2017). These data were combined with existing radiocarbon ages from 131
terrestrial and marine sediments cores, bathymetric measurements and a relative dating technique that uses 132
the radial growth of Azorella selago Hook, a cushion-forming Umbelliferae species growing on the moraine 133
(Frenot et al 1993; 1997). Results revealed that deglaciation started at least ~24 ka ago and that the landscape 134
up to 20 km east of CIC was still partly covered by ice during the Late glacial. Glaciers were shrinking 135
through the Holocene probably until 3 ka with evidence of minor advances during the last millennium 136 (Jomelli et al., 2017). 137 138
4. Methods
139The fieldwork was conducted in different areas of the Kerguelen Islands on the slope east of the CIC in 140
order to complement a previous study (Jomelli et al., 2017) and document earlier glacier extents on the main 141
Island at various altitudes and distances from CIC. Frontal moraines are rare on the main island but erratics 142
and roche moutonnees are very frequent making possible to document past ice extents. Five sites, Peninsule 143
6 Courbet, Val Studer, Armor Lake, Bontemps valley and Le Belvedere moraine (sample locations in Fig.1 144
and Table 1; note that Armor Lake and Ampere glacier were studies by Jomelli et al., 2017. Their 145
chronologies are discussed at the end of this paper) were visited in order to collect rock samples from glacial 146
moraine boulders, erratic boulders and roche moutonnee surfaces: 147
148
Samples were taken with a hammer and a chisel from preferentially flat surfaces of erratic and moraine 149
boulders and of roche moutonnee. The geographic coordinates were recorded with a handheld GPS device 150
and topographic shielding was measured using a clinometer (Table 1). The altitudes were later determined 151
from shuttle radar topography mission data (SRTM), because they are more accurate than the handheldGPS 152
data (Table 1). 153
The in situ 36Cl dating was conducted on the basaltic whole rock samples at CEREGE, Aix-en-Provence, 154
France, similar to the method described in Schimmelpfennig et al. (2011). An aliquot of bulk rock was 155
taken from several samples for major and trace element analysis at the Service d'Analyse des Roches et des 156
Minéraux (SARM, Nancy, France) (Tables 2-3), necessary to estimate the low-energy neutron flux in the 157
samples, which induces the 36Cl production from capture of the low-energy neutrons on 35Cl. Due to low Cl 158
concentrations (Table 4), this production reaction contributed little to the total 36Cl production in most 159
samples (between ~2% and ~9%), except for sample Ker-16 (16%). 160
After crushing and sieving to a grain size fraction of 250-500 µm, the samples were decontaminated from 161
potentially Cl-rich groundmass and atmospheric 36Cl in a diluted suprapur HF/HNO3 acid mixture 162
(Schimmelpfennig et al., 2009). Following this step, which removed about 40% of the initial samples 163
weight, 2 g aliquots of the rinsed and dried sample grains were taken for analysis of the major elements 164
concentrations by ICP-OES at SARM (Table 3), because Ca, K, Ti and Fe, are the target elements for 165
spallogenic/muogenic production of 36Cl. After addition of a 35Cl-enriched spike (~99%) for isotope dilution 166
(Ivy-Ochs et al., 2004), the samples were totally dissolved in a HF/HNO3 acid mixture. Two chemistry 167
blanks were processed together with the samples (Table 4). The remaining steps were identical with those 168
described in Schimmelpfennig et al. (2011). Measurement of the 36Cl/35Cl and 35Cl/37Cl ratios by isotope 169
dilution accelerator mass spectrometry at the AMS facility ASTER-CEREGE allowed the calculation of the 170
36Cl and Cl concentrations (Table 4). 171
36Cl age calculations were done using the Excel® spreadsheet published by Schimmelpfennig et al. (2009), 172
using scaling factors based on the time-invariant "St" method (Stone, 2000) (Table 4) and applying the 173
following 36Cl production rates, referenced to sea level and high latitude (SLHL): 42.2 ± 4.8 atoms 36Cl (g 174
Ca)-1 yr-1 for spallation of Ca(Schimmelpfennig et al., 2011), 148.1 ± 7.8 atoms 36Cl (g K)-1 yr-1 for spallation 175
7 of K(Schimmelpfennig et al., 2014), 13 ± 3 atoms 36Cl (g Ti)-1 yr-1 for spallation of Ti (Fink et al., 2000), 176
1.9 ± 0.2 atoms 36Cl (g Fe)-1 yr-1 for spallation of Fe(Stone et al., 2005), and 626 neutrons (g air)-1 yr-1 for 177
the production rate of epithermal neutrons from fast neutrons in the atmosphere at the land/atmosphere 178
interface (Phillips et al., 2001). A high-energy neutron attenuation length of 160 g cm-2 was used. We 179
assumed bulk rock density of 2.4 g cm-3 for all samples. Further relevant input data (sample thicknesses, 180
shielding factors, compositional data) are shown in Tables 1, 2 and 3. 181
182
In Table 4, we present the 1s uncertainties of the resulting individual 36Cl ages inferred through full
183
propagation of all errors (analytical and production rate errors) as well as of the analytical errors only. In 184
the main text, we report the individual ages with their analytic uncertainties only for the sake of internal 185
comparison between the ages; when presenting the mean of an age population, we report the arithmetic 186
mean and the full error including the production rate error to allow comparison with climate records that 187
were dated with different methods. We determined this full error by computing the standard deviation and 188
adding analytical and production rate errors (represented by the mean of the relative individual age 189
uncertainties) by propagation in quadrature. On the maps, all ages are shown with the full errors, unless 190
otherwise stated. A Chi2 test was applied to identify potential outliers within an age population. 191
192
The 36Cl ages are presented without erosion or snow cover corrections. Concerning erosion, quantitative
193
information at Kerguelen is not available at present, but during sampling, surfaces with little evidence of 194
erosion were preferentially targeted (degree of weathering and direct evidence on the boulder surface of 195
frost, salt or wind action). Assuming an erosion rate of 5 mm ka would result in a 10% increase of the oldest 196
36Cl ages (erratic boulders at Peninsule Courbet) and less for the younger ages. This is within the overall
197
uncertainties of the final 36Cl ages and taking it into consideration would not change the conclusions of this
198
study. Potential snow cover effects were not considered in the 36Cl age calculations, because of the modern
199
short annual snow cover duration (~1.5 months at 90 m altitude and ~3 weeks at 35 m altitude as inferred 200
from glaciological modelling (Verfaillie et al., 2015; Favier et al., 2016)), which would lead to an 201
insignificant snow cover correction. 202 203 204
5. Results
205 2065.1 Erratic boulders deposited far east of CIC
2078 The 36Cl ages range from ~42 to ~11 ka (Table 1-4) with an ~80% contribution covering the 42-20 ka period. 208
Our dataset can be divided into three groups (erratics, roche moutonnees and moraine landforms) in terms 209
of sampled glacial features and distance from CIC. 210
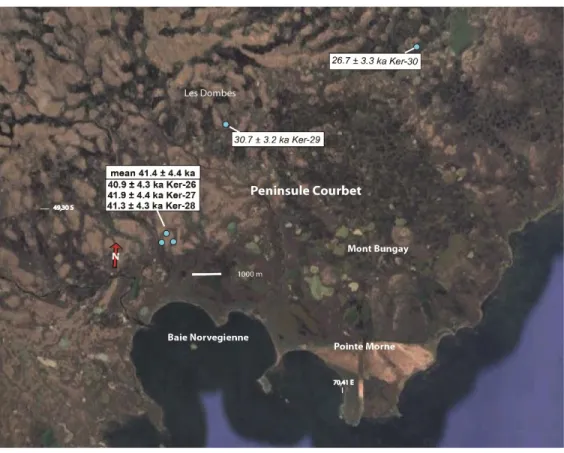
The first group is composed of the 13 distant erratic boulders located at Peninsule Courbet and Val Studer. 211
Peninsule Courbet is the farthest sampling site located about 85 km east of CIC in our study, at an altitude 212
between 37 m and 57 m a.s.l. (Figs.1, 2, 3; table 1). Most of this peninsula is relatively flat with altitudes 213
lower than 100 m a.s.l. Numerous kettle lakes are visible. They are associated with losely-spaced ridges or 214
small hills 2-5 m high, mostly covered by sand and gravel with few larger boulders that may correspond to 215
a glacial till. These ridges may correspond to remains of Rogen moraines formed transverse to ice flow in a 216
subglacial position and indicating the presence of an ice sheet flowing eastward. Three samples (Ker 26, 217
Ker 27, Ker 28) were collected from large erratic boulders 8 km north east of PAF (Fig.2). These three 218
erratic are the oldest dated samples in this study. Positioned on a rocky pavement, they yield consistent 36Cl 219
ages of 40.9 ± 2.7 ka, 41.9 ± 2.8 ka and 41.3 ± 2.8 ka, with a mean age of 41.4 ± 4.4 ka (Figs. 2-4, 13). 220
Erratic are rare closer the coast and on northeastern direction. Nevertheless two additional samples (Ker 29 221
and Ker 30) were collected from erratics partly embedded in a sandy gravel pavement 5 and 11 km north 222
east from the previous sampling site, respectively (Fig.2). They yield ages of 30.7 ± 2.0 ka and 26.7 ± 3.0 223
ka. 224 225
9 226
227 228
Fig. 2. Location of 36Cl ages with their arithmetic mean at Peninsule Courbet site. The 1σ uncertainties in the individual 229
36Cl errattic ages account for analytical and production rate uncertainties, while the uncertainty in the mean includes 230
standard deviation, analytical and production rate uncertainties. The samples in italic were rejected as outliers based 231
on a Chi2 test (see text for details).
232 233
According to the Chi2 test, these ages do not belong to the same age population as the other three dates, but 234
are statistically indistinguishable from each other with a mean of 28.7 ± 4.3 ka. Two explanations are 235
possible: either these two younger boulders were deposited following a later ice advance compared to the 236
deposition of the ~41 ka boulders, or they reflect post depositional erosion or exhumation processes. Since 237
there is no firm evidence supporting either of the two scenarios, we assume these two younger boulder ages 238
as outliers (reflecting possible post depositional erosion or exhumation processes) and do not further 239 consider them. 240 241 242 243 244 A
10 245 246 247 248 249 250 251 252 253 254 255 256 257 258 259 260 261 262 263 264
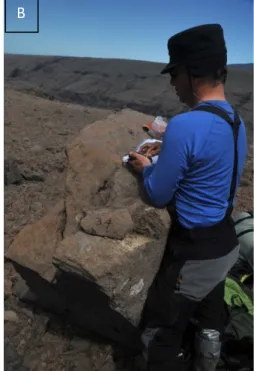
Figure 3.Pictures of some of the sites sampled during the field campaigns. A: erratic boulders Ker-28 at Peninsule
265
Courbet. B: erratic boulders Ker-34 at Val Studer. C: sampling of the roche moutonnee near Armor Lake. D: erratic
266
boulder Ker-38 at Val Studer.
267 268 269 C C B A D A
11 270
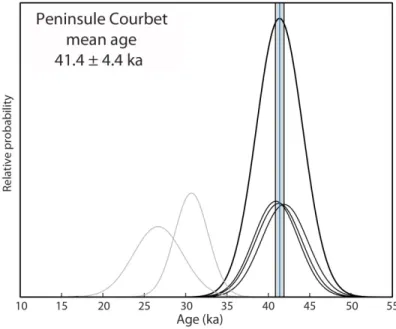
271
Fig 4. Probability plots of 36Cl boulder ages from Peninsule Courbet. Please note that the gaussian curves 272
of the individual ages do not include the 36Cl production rate uncertainties (analytical uncertainties only), 273
while the error of the mean age in the upper left corner box includes the 36Cl production rate uncertainties. 274
Grey curves are outliers. Vertical blue line and grey band represent arithmetic mean and standard deviation, 275
respectively (outliers are not included). 276
277
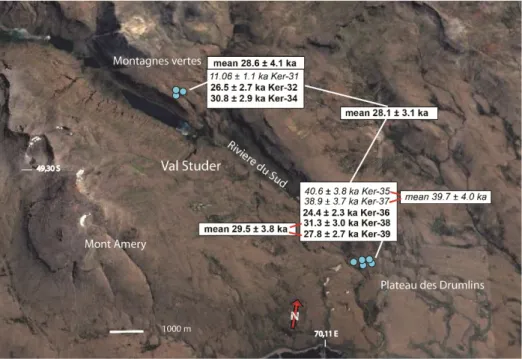
The second sample site is Val Studer, a typical deep U-shaped glacial valley located at 60 km from CIC and 278
about 16 km from PAF. Three erratic boulders were collected at about 320 m a.s.l. on the southern slope of 279
Montagne Verte (716 m a.s.l.), the highest summit on the left side of Riviere du Sud. These erratics (Ker 280
31, 32, and 34) sampled on flat surfaces yield 36Cl ages of 11.06 ± 0.86 ka, 26.5 ± 1.8 ka, and 30.8 ± 2.1 ka 281
respectively. Rejecting Ker 31 (11.06 ± 0.86 ka) as an outlier based on the Chi2 test, Ker 32 and Ker 34 282
give a mean age of 28.6 ± 4.1 ka. 283
About 8 km downslope five other erratic boulders were sampled on the Plateau des Drumlins between 48 284
and 63 m a.s.l. (Table 1, Fig. 3, 5). These boulders (Ker 35-39) yield 36Cl ages of 40.6 ± 2.7 ka, 24.4 ± 1.7 285
ka, 38.9 ± 2.7 ka, 31.3 ± 2.1 ka and 27.8 ± 1.9 ka (Fig. 5, 6). All these boulders were also collected on flat 286
surfaces in order to avoid downslope movements. 287
288 289
12 290
Fig. 5. Location of 36Cl ages with their arithmetic means at Val Studer site. The 1σ uncertainties in the individual 36Cl 291
boulder ages account for analytical and production rate uncertainties, while the uncertainties in the means include 292
standard deviation, analytical and production rate uncertainties. A sample in italic from Montagne Vertes was rejected 293
as outlier based on the Chi2 test (see text for details). For the boulders near Plateau des Drumlins there are two possible
294
groups of outliers; see text for clarification. 295
296
Based on the Chi2 test, two sub groups can be distinguished among samples Ker 35-39, leading us to consider 297
two distinct hypotheses for these low elevation samples. The first hypothesis rejects the three samples Ker 298
35 (40.6 ± 2.7 ka), Ker 36 (24.4 ± 1.7 ka) and Ker 37 (38.9 ± 2.7 ka) as outliers. Then Ker 38 and Ker 39 299
yield a mean age of 29.5 ± 3.8 ka (Fig.5). This hypothesis implies a synchronous boulder deposition at the 300
two elevations in Val Studer valley (Ker 32, Ker 34). The second hypothesis rejects the three samples Ker 301
36 (24.4 ± 1.7 ka), Ker 38 (31.3 ± 2.1 ka), and Ker 39 (27.8 ± 1.9 ka) as outliers. Then Ker 35 and Ker 37 302
yield a mean age of 39.7 ± 1.2 ka (standard deviation only) and 39.7 ± 4.0 ka (full uncertainty) (Figs. 5, 6, 303
13). This second hypothesis implies two distinct depositional periods at Val Studer first at Plateau des 304
Drumlins, then at Montagnes Vertes. It also implies temporal synchronicity with the boulder ages from 305
Peninsule Courbet, even supporting two synchronous deposition periods at both sites at ~40 ka and ~29 ka. 306
However, this second hypothesis is not further discussed due to the lack of evidence of two boulder 307
deposition periods. Nevertheless, this scenario does not contradict the general conclusions of this study. 308
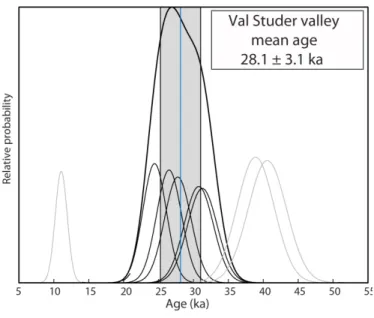
Finally, considering all ages from the two altitudes in Val Studer valley (Montagnes Vertes and Plateau des 309
Drumlins), after rejection of Ker 31, Ker 35 and Ker 37 as outliers, yields a mean age of 28.1 ± 3.1 ka 310
(Figs.5, 6). As this mean value is not statistically different from the first hypothesis presented above (29.5 311
13 ± 3.8 ka) based on the mean of the two Ker 38-39 samples but based on a larger number of boulders, it will 312
be considered as representative for the Val Studer site in the following text. 313
314 315
316 317
Fig 6. Probability plots of 36Cl boulder ages from Val Studer. See caption of Fig. 4 for details.
318 319 320
5.2 Roches moutonnees at 37 km from CIC
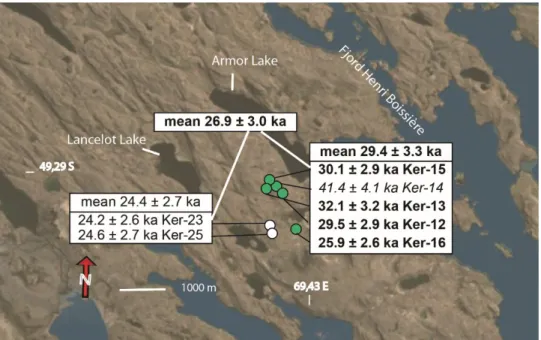
321The second group of samples comes from five roche moutonnees. Roughly 37 km east of CIC, five samples 322
(Ker, 12, 13, 14, 15 and 16) were collected on the basaltic plateau on the south-western side of Armor Lake. 323
Ker 12, 13 and 14 were sampled at an altitude of 132 m a.s.l and Ker 15 and 16 at 125 m a.s.l. and 53 m 324
a.s.l. respectively (Table 1, Figs.3, 7). These roche moutonnees samples complement two 36Cl ages obtained 325
from erratic boulders located at 176 m and 177 m a.s.l. and dated to a mean age of 24.4 ± 1.1 ka (Jomelli et 326
al., 2017). 327
328
The samples Ker 12-16 yield 36Cl ages of 29.5 ± 2.1 ka, 32.1 ± 2.2 ka, 41.4 ± 2.8 ka, 30.1 ± 2.1 ka and 25.9 329
± 2.0 ka respectively (Figs. 7, 8). Rejecting Ker 14 (41.4 ± 2.8 ka) as an outlier based on the Chi2 test, the 330
other samples yield a mean age of 29.4 ± 3.3 ka (full uncertainty). Grouping the ages previously dated by 331
Jomelli et al., (2017) with those of the roches moutonnes and rejecting Ker 14 (41.4 ± 2.8 ka) and Ker 13 332
(32.1 ± 2.2 ka) as outliers, yields a mean age of 26.9 ± 3.0 ka. 333
14 334
335
Fig. 7. Location of 36Cl ages at Amor lake site. Green circles show samples from roche moutonnees with their 336
arithmetic mean and white circles show erratic boulder ages from Jomelli et al., (2017). The 1σ uncertainties in the 337
individual 36Cl boulder ages account for analytical and production rate uncertainties, while the uncertainties in the 338
means includes standard deviation, analytical and production rate uncertainties. The sample in italic was rejected as an 339
outlier based on the Chi2test (see text for details).
340 341 342
343 344
15
Fig. 8. Probability plots of 36Cl boulder ages from Amor Lake. See caption of Fig. 4 for details. Light blue curves
345
show ages of erratics from Jomelli et al. (2017).
346 347 348 349
5.3 Moraine landforms
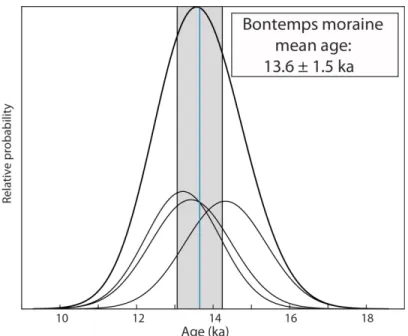
350The last group of 36Cl ages presented in this paper is composed of four boulders on the top of two distinct 351
moraines. 352
In Bontemps valley, the CIC outlet Explorateur glacier formed a prominent moraine located about 26 km 353
down-valley from the current ice front, where it dammed Bontemps Lake, the largest lake on the main 354
island. This moraine, covered by sub-angular large boulders (>50 cm in length), was tentatively dated to the 355
ACR chronozone (13.3 ± 1.4 ka) by Jomelli et al (2017), based on three boulder ages, one of which was 356
rejected as an outlier. In this study, one additional sample (KBT7) was collected from the top of this frontal 357
moraine at 16 m a.s.l (Figs.3, 9) to better constrain the age of this moraine. 358
359
360
Fig.9. Sample locations in Bontemps valley with the corresponding individual 36Cl ages. A red circle shows the new 361
sample on Bontemps moraine highlighted by the yellow line, white circles show boulder ages from Jomelli et al., 362
(2017). Also shown are the arithmetic means for the age population with the 1s uncertainty including standard 363
16 deviation, analytical and production rate uncertainties. The sample in italic was rejected as an outlier based on the
364
Chi2 test (see text for details).
365 366
KBT7 is dated to 14.3 ± 1.1 ka and is consistent with previous boulder ages from the same moraine KBT5 367
13.2 ± 1.0 ka and KBT6 13.4 ± 1.1 ka (standard deviation only) (Fig. 9, 10, 13). All three samples from 368
Bontemps moraine yield a mean age of 13.6 ± 1.5 ka. 369
370
371
Fig. 10. Probability plots of 36Cl moraine boulder ages from Bontemps moraine. See caption of Fig. 4 for details.
372 373
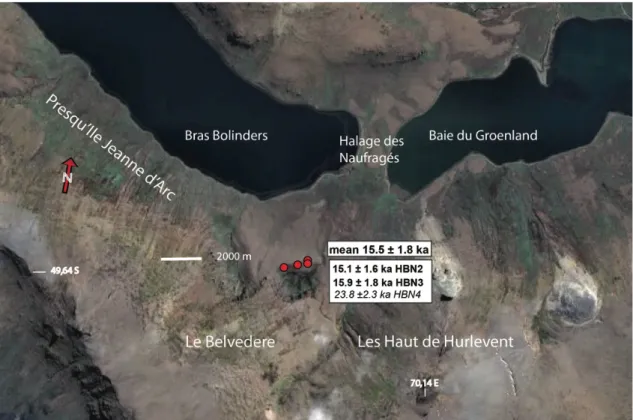
Three other samples HBN2, HBN3 and HBN4 were collected at an altitude between 115 and 138 m a.s.l. 374
from boulders of about 70-100 cm height on the crest of the Belvedere moraine, about 72 km from CIC, on 375
the southeastern part of Kerguelen about 32 km south of PAF (Fig. 11). This left lateral moraine, formed by 376
a local glacier is located on the southern slope of a small glacial cirque below the plateau les Haut de 377
Hurlevent. This moraine of about 300 m long and 20 m high, has steep slopes and is covered by subangular 378
boulders. 379
The three samples yield 36Cl ages of 15.1 ± 1.1 ka and 15.9 ± 1.3 ka and 23.8 ± 1.6 ka, respectively. From 380
this dataset, sample HBN4 (23.8 ± 1.6 ka) was rejected as an outlier based on the Chi2 test. This moraine 381
boulder likely was pre-exposed to cosmic radiation and reworked during the last glacier advance. The 382
remaining two consistent moraine boulder ages yield a mean of 15.5 ± 1.8 ka (Figs. 3, 11, 12). 383
17 385
Fig. 11. Location of 36Cl ages on Belvedere moraine site. The 1σ uncertainties in the individual 36Cl boulder ages 386
account for analytical and production rate uncertainties, while the uncertainty in the mean includes standard deviation, 387
analytical and production rate uncertainties. The sample in italic was rejected as an outlier based on the Chi2 test (see
388
text for details). 389
390
391
Fig. 12. Probability plots of 36Cl boulder ages from Belvedere moraine. See caption of Fig. 4 for details.
18 393
394
6. Discussion
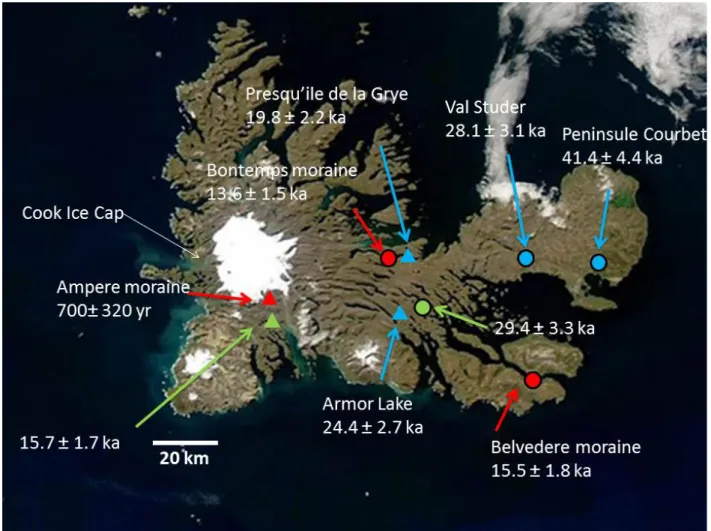
3956.1 History of glacier fluctuations at Kerguelen from 41 ka to the late glacial
39636Cl cosmic-ray exposure dating of glacial erratics, roches moutonnees and morainic boulders collected at 397
different sites over Kerguelen archipelago provide constraints on the glacier extents on the island from 41 398
ka to the late glacial period. Erratics from Peninsule Courbet, the farthest site east of CIC provide direct 399
evidence that this part of the main island of Kerguelen was deglaciated ~41 ka ago (Fig. 13). These erratics 400
most likely do not represent the maximum glacier position and were probably transported by the ice during 401
a glacier advance that pre-dates ~41 ka ago. 402
Over the time period lasting from ~41 to ~29 ka, glacier shrinkage generally continued, possibly interrupted 403
by stagnation or minor advances. We assume that before ~ 29 ka, outlet glaciers of CIC (or the glaciers that 404
developed locally) had not retreated beyond the sample sites of Armor Lake and Val Studer for a significant 405
period of time. This is supported by the similarity of the ages of the roches moutonnees at Armor Lake (~29 406
ka) and those of the erratic boulder at Val Studer (~28 ka). If the glaciers had retreated further for a 407
significant period of time, the exposure duration of the roches moutonnees would have been longer than that 408
of the erratics. Moreover, the age of the erratics at Armor Lake (~24 ka) suggests that after ~29 ka the ice 409
might have retreated to an unknown position for at most ~5 ka before readvancing at ~24 ka. In addition, 410
the uncertainties associated with the ages at Val Studer and Armor Lake do not allow us to reach a resolution 411
good enough to highlight possible (a)-synchronies of the CIC outlet glacier fluctuations in this part of the 412
archipelago. 413
After ~24 ka, the CIC outlet glaciers continued to retreat likely until the Antarctic Cold Reversal (ACR) 414
period (14.5-12.9 ka). During this ACR period the Explorateur glacier, a CIC outlet, stagnated or re-415
advanced forming, 26 km from its current front position the Bontemps moraine at about 13.6 ± 1.5ka ago. 416
The local glacier located on the Presqu Ile Jeanne d’Arc formed the Belvedere moraine at about 15.5 ± 1.8 417
ka ago, which might have been contemporaneous with the formation of Bontemps moraine given their 418
overlapping age uncertainties. 419
420 421
19 422
Fig. 13. Summary of 36Cl ages obtained at different sample sites. Reported mean 36Cl boulder ages account for standard 423
deviation, analytical and production rate uncertainties. Red = moraine ages; Blue = erratic ages; Green = roche
424
moutonnee age; dot = this paper; triangle = ages from Jomelli et al (2017) only.
425 426
6.2 Comparison to other sub-Antarctic glacial chronologies
427428
Comparing our findings from the southern Indian Ocean with other sub-Antarctic glacial chronologies 429
located in the South Pacific (New Zealand) and South Atlantic regions (Patagonia) reveals intriguing 430
features (Fig. 14). The presented cosmic-ray exposure ages indicate that glacier retreat occurred in 431
Kerguelen roughly 41 ka ago with a preceding glacier advance that must have been larger than that during 432
the gLGM. Unfortunately, the exact location of the corresponding maximum CIC front position is unknown, 433
as it might be offshore. The exact age of the glacier maximum extent that precedes the subsequent retreat 434
20 around 41 ka ago remains therefore also unknown. These findings do not fully correspond to what is 435
documented in the two other regions. 436
The glacier evolution at Kerguelen only partly resembles that described in New Zealand. Kelley et al., 437
(2014) showed that Pukaki and Mt John glaciers in New Zealand started to retreat from a major extent about 438
42 ka ago based on 10Be ages. At Pukaki, the glacier extent during the maximum MIS-3 ice cover was 439
comparable to the subsequent glacier culminations, which occurred between 28 ka and 25 ka, as well as 21 440
ka and 18 ka ago (Kelley et al., 2014). Consequently, in both regions, glaciers were larger during the MIS-441
3 period than during the gLGM. At Kerguelen, large glacier extent occurred 42 ka ago, but it does not 442
necessarily correspond to a maximum glacial advance. In both regions, comparable subsequent glacier 443
extents occurred between about 28 ka and 19 ka ago, even if field evidence of a clear glacier advance at 444
Kerguelen at 25, 21 and 18 ka ago are still lacking. Moreover, observations covering the more recent periods 445
revealed significant differences in glacier evolution between the two regions (Schaefer et al., 2015; Jomelli 446
et al 2017). 447
Glacier evolution at Kerguelen also differs partly from Patagonia. In Patagonia, there is no clear evidence 448
of large advances at 42 ka (Darvill et al., 2015). Fogwill et al. (2015) showed in a compilation of 59 449
cosmogenic ages (10Be and 36Cl ages) that the culmination of the ice sheet during the lLGM occurred about 450
28 ka ago, i.e. few millennia before the gLGM. However, this lLGM extent was smaller than pre lLGM 451
glacier MIS-3 extents that mostly occurred at roughly 32 ka about 49°S (same latitude as Kerguelen) as well 452
as at higher latitudes (Darvill et al., 2015). Uncertainties associated with the 36Cl ages do not permit to assess 453
synchronous advances with those documented in Patagonia between 32 and 28 ka ago. In addition, field 454
evidence of a clear glacier advance at Kerguelen around 32 ka ago is still lacking. Also, glacier retreat in 455
Patagonia between 28 ka to 19 ka ago was larger than at Kerguelen. These different patterns of glacier 456
fluctuations in sub-Antarctic regions raise questions about the potential drivers of the glacier fluctuations in 457
the southern hemisphere. 458
Several hypotheses have been proposed to explain the major glacier advance during the MIS-3 period but a 459
full understanding of the forcings involved in the glacier evolution at the hemispheric scale remains puzzling 460
(Putnam et al., 2013; Kelley et al., 2014; Darvill et al., 2015; Schaefer et al., 2015). 461
462
It is generally assumed as inferred from proxy data, that a northward migration and intensification of the 463
southern westerly wind belt occurs during colder periods in Antarctica resulting in reduced deep ocean 464
ventilation and low atmospheric CO2 concentrations (Lamy et al., 2010; Fletcher and Moreno, 2011). On 465
the other hand, model studies show contrasting results on the position and strength of the westerly winds 466
21 during the LGM conditions with either an equatorward or a poleward position (Otto Bliesner et al., 2006; 467
Rojas et al., 2009; Sime et al., 2013). 468
469
Numerous ice core records have been extracted from the west and east Antarctic ice sheets (e.g. Watanabe 470
et al., 2003; EPICA comm members, 2004, 2006; Stenni et al., 2011; Wais Divide, 2015). Every site 471
temperature reconstructions based on d18O of ice cores show a progressive cooler trend during MIS-3 period 472
with a major temperature minimum between 28 and 22 ka corresponding to the gLGM (Stenni et al., 2010; 473
Parrenin et al., 2013; Wais Divide, 2015). These observations are the same in both the Indo-Pacific and the 474
Atlantic sectors. Temperature and snow accumulation changes documented at Wais Divide showed a 475
remarkable concordance with glacier changes at Kerguelen over the last 28 ka (Jomelli et al., 2017). 476
However warm temperature in Antarctica during the pre-gLGM is counterintuitive with large glacier extent 477
at that time observed in different regions of mid southern hemisphere. This suggests an important regional 478
variability during the pre-LGM period. This regional variability is also seen in Antarctic ice core records 479
over Marine Isotopic Stage 3 (MIS 3, 60 to 25 ka) during the succession of Antarctic Isotopic Maxima 480
(AIM) associated with the abrupt Dansgaard-Oeschger events in Greenland. The warming phases of the 481
AIM show strong variability when comparing the Atlantic and Indian-Pacific basins: it is much more rapid 482
(a few centuries) on the Atlantic side. This creates a transient climatic dipole during warming phase of the 483
AIMs with the Atlantic side of Antarctica being warmer than the Indian-Pacific side. 484
485
Interestingly, several sea surface temperature (SST) reconstructions have been produced making possible 486
the documentation of climate conditions in the Indian, Pacific and Atlantic circum-Antarctic regions 487
(Pahnke and Sachs, 2006; Kaiser and Lamy, 2010). These SSTs point to significant differences in the climate 488
evolution of the Indo-Pacific and Atlantic sectors over the last 60 ka (Fig.14). Sub-Antarctic SSTs from N 489
Chatham Rise MD97-2120 sediment core located south east of New Zealand (45°S) show a long period 490
lasting from 48 ka and 28 ka ago with relatively cold conditions (Pahnke and Sachs, 2006). Minima coincide 491
with large glacier extent. On the north west of Kerguelen, SSTs from Cape Basin 1089/TN057 sediment 492
core (41°S) show a different pattern with a progressive warming trend from a minimum 43 ka ago, 493
interrupted by periodic cold peaks (Pahnke and Sachs, 2006). On the east coast of Patagonia, SSTs from the 494
sediment core ODP Site 1233 (41°S) reveal several cold episodes, in particular at 43 ka, 32 ka and 22 ka 495
(Kaiser and Lamy, 2010). A parallel can be drawn between these differences in regional SSTs conditions 496
and reconstructions of surface air temperature or climate of the evaporative source regions from proxy data 497
in various Antarctic ice core records. Indeed and as mentioned above for the surface air temperature 498
reconstruction from water isotopes, water isotopic records (d18O and d-excess) show strong differences 499
during AIM warming phases between ice cores located on the Atlantic side of Antarctica and ice cores 500
22 located on the Indian – Pacific sides of Antarctica (Stenni et al., 2010; Buiron et al., 2012; Landais et al., 501
2015). At Kerguelen uncertainties associated with the 36Cl ages do not permit to assess synchrony between 502
glacier changes and AIMs but we notice that nine AIMs occurred during MIS 3 period. 503
504 505 506
Fig.14. Comparison between sea surface temperature and major glacier extent during MIS-3 and the lLGM in
507
Patagonia (after Darvill et al., 2015; Fogwill et al., 2015), Kerguelen (this study) and New Zealand (after Kelley et al.,
508
2014). Pink curve shows SSTs from the sediment core ODP Site 1233 (41°S) on the east coast of Patagonia, (Kaiser
509
and Lamy, 2010). Black curve shows Sub-Antarctic SSTs from N Chatham Rise MD97-2120 sediment core (45°S)
23
(Pahnke and Sachs, 2006). Blue curve shows SSTs from Cape Basin 1089/TN057 sediment core (41°S) (Pahnke and
511 Sachs, 2006). 512 513 514 515 516
7. Conclusion
517Twenty-two cosmogenic 36Cl surface exposure ages were collected from five sites on Kerguelen 518
Archipelago on the eastern slope of the Cook Ice Cap. These samples collected from glacial moraine 519
boulders, erratic boulders and roche moutonnee surfaces made it possible to document changes in glacier 520
extent between 42 ka ago and the late glacial period. The data combined with an earlier record from 521
Kerguelen reveal that glaciers retreated from the maximum extent at ~41 ka ago. From ~41 to ~15 ka, 522
deglaciation generally continued, interrupted by several stagnations or minor culminations, at least at ~28-523
29 ka and ~24 ka ago. A period of glacier advance occurred prior to ~15-14 ago. These glacier changes at 524
Kerguelen are comparable with glacier fluctuations in New Zealand, but differ from those in Patagonia, 525
where the maximum glacier extent occurred about 13 ka later. The reason of such asynchronous pattern is 526
enigmatic so far, but we hypothesize that it is related to differences in the climate evolution of the Indo-527
Pacific and Atlantic sectors of Antarctica documented by SSTs from sediment cores and surface air 528
temperature and sea ice extent from proxy ice core records around Antarctica. A transient climatic dipole is 529
created during warming phase of the AIMs with the Atlantic side of Antarctica being warmer than the 530
Indian-Pacific side which may partly be responsible for such different regional climate conditions and by 531
repercussion may explain the reason why Kerguelen glaciers exhibited a different evolution compared to 532
other sub Antarctic regions. However, further investigations of the mechanisms responsible for such 533
asynchronous pattern of climate change are needed to better understand the respective role of external and 534
internal forcings and glacier dynamic. 535
536 537
Acknowledgments
538
This paper was supported by the French INSU LEFE Glacepreker project and by the IPEV Kesaaco 539
1048 project. The Cl-36 and Cl measurements were performed at the ASTER AMS national facility 540
(CEREGE, Aix-en-Provence) which is supported by the INSU/CNRS, the ANR through the "Projets 541
thématiques d’excellence" program for the "Equipements d’excellence" ASTER-CEREGE action, and 542
IRD. We are thankful for the compositional analyses at SARM/CRPG. 543
24
References
545
Berthier, E., Le Bris, R., Mabileau, L., Testut, L., Rémy, F., 2009. Ice wastage on the Kerguelen Islands 546
(49°S, 69°E) between 1963 and 2006. J. Geophys. Res. 114, F03005. 547
Boex, J., Fogwill, C., Harrison, S., Glasser, N.F., Hein, A., Schnabel, C., Xu, S. 2013. Rapid thinning of the 548
late Pleistocene Patagonian Ice Sheet followed migration of the Southern Westerlies. Sci. Rep. 3, 2118; 549
DOI:10.1038/ srep02118. 550
Buiron, D., Stenni, B., Chappellaz, J., Landais A., Baumgartner, M., Bonazza, M., Capron, E., Frezzotti, 551
M., Kageyama M., Lemieux-Dudon B., Masson-Delmotte V., Parrenin, F.. Schilt, A., Selmo E., Severi, 552
M., Swingedouw, D., Udisti, R. 2012. Regional imprints of millennial variability during the MIS 3 period 553
around Antarctica. Quaternary Science Reviews 48, 99-112. 554
Clark, P.U., Dyke, A.S., Shakun, J.D., Carlson, A.E., Clark, J., Wohlfarth, B., Mitrovica, J.X., Hosteler, 555
S.W., Mc Cabe, A.M., 2009. The last glacial maximum. Science, 325, 710-714. 556
Darvill, C.M., Bentley, M.J., Stokes, C.R., Hein, A.S., Rodes, A. 2015. Extensive MIS 3 glaciation in 557
southernmost Patagonia revealed by cosmogenic nuclide dating of outwash sediments. Earth and Planetary 558
Science Letters 429, 157-169. 559
EPICA Community Members, 2004. Eight glacial cycles from an Antarctic ice core. Nature 429, 623-628. 560
EPICA Community Members, 2006. One-to-one coupling of glacial climate variability in Greenland and 561
Antarctica. Nature 444, 195-198. 562
Favier, V., Verfaillie, D., Berthier, E., Menegoz, M., Jomelli, V., Kay, J.E., Ducret, L., Malbéteau, Y., 563
Brunstein, D., Gallée, H., Young-Hyang Park, Y., Rinterknecht, R., 2016. Atmospheric drying as the main 564
driver of dramatic glacier wastage in the southern Indian Ocean. Scientific Reports 6, 32396; doi: 565
10.1038/srep32396. 566
Fink D., Vogt S., Hotchkis M., 2000. Cross-sections for 36Cl from Ti at Ep = 35–150 MeV: applications to 567
in-situ exposure dating. Nucl. Instrum. Meth. Phys. Res. Sect. B 172, 861–866. 568
Frenot, Y., Gloaguen, J.C., Picot, G., Bougère, J., Benjamin, D., 1993. Azorella selago Hook. used to 569
estimate glacier fluctuations and climatic history in the Kerguelen Islands over the last two centuries. 570
Oecologia 95, 140-144. 571
Frenot, Y., Gloaguen, J.C., Van De Vijver, B., Beyens, L., 1997. Datation de quelques sédiments tourbeux 572
holocènes et oscillations glaciaires aux Iles Kerguelen. Comptes Rendus de l'Académie des Sciences 320, 573
567-573. 574
Fletcher, M.S., Moreno, P.I. 2011. Zonally symmetric changes in the strength and positon of the southern 575
westerlies drove atmospheric C02 variations over the past 14 ky. Geology, 39, 419- 422. 576
Fogwill, C. J., Turney, C.S.M., Hutchinson, D.K., Taschetto, A.S., England, M.H. 2015. Obliquity control 577
on southern hemisphere climate during the Last Glacial. Sci. Rep. 5, 11673; doi: 10.1038/srep11673. 578
25 Hall, K., 1984. Evidence in favour of an extensive ice cover on sub-Antarctic Kerguelen Island during the 579
last glacial. Pal Pal Pal 47, 225-232. 580
Hodgson, D.A., Graham, A.C.G., Roberts, S.J., Bentley, M.J., ÓCofaigh, C., Verleyen, E., Jomelli, V., 581
Favier, V., Brunstein, D., Verfaillie, D., Colhoun, E.A., Saunders, K., Mackintosh, A., Hall, K., McGlone, 582
M.S., Van der Putten, N., 2014. Terrestrial and marine evidence for the extent and timing of glaciation on 583
the sub-Antarctic islands. Quat. Sci. Rev. 100, 137-158. 584
.http://dx.doi.org/10.1016/j.quascirev.2013.12.001. 585
Ivy-Ochs, S., Synal, H.A., Roth, C., Schaller, M., 2004. Initial results from isotope dilution for Cl and 36Cl 586
measurements at the PSI/ETH Zurich AMS facility. Nuclear Instruments and Methods in Physics Research 587
Section B 223, 623- 627. 588
Jomelli, V., Mokadem, F., Schimmelpfennig, I., Chapron, E., Rinterknecht, V., Brunstein, D., Favier, V., 589
Verfaillie, D., Legentil, C., Michel, E., Swingedouw, D., Jaoen, A., Aster Team 2017. Sub-Antarctic 590
glacier extensions in the Kerguelen region (49°S, Indian Ocean) over the past 24 000 years constrained by 591
36Cl moraine dating. Quaternary Science Reviews, 162, 128-144. 592
Kaiser, J., Lamy, F. 2010. Links between Patagonian ice Sheet fluctuations and Antarctic dust variability 593
during the last glacial period (MIS 4-2). QSR, 29, 1464-1471. 594
Kelley, S. E., Kaplan, M.R., Schaefer, J.M., Andersen, B.G., Barrell, D.J.A., Putnam, A.E., Denton, G.H., 595
Schwartz, R., Finkel, R.C., Doughty, A.M. 2014. High-precision 10Be chronology of moraines in the 596
Southern Alps indicates synchronous cooling in Antarctica and New Zealand 42,000 years ago. Earth and 597
Planetary Science Letters 405, 194–206, doi:http://dx.doi.org/10.1016/j. epsl.2014.07.031.
598
Lamy, F., Kilian, R., Arz, H.W., Francois, J.P., Kaiser, J., Prange, M., Steinke, T. 2010. Holocene changes in 599
the position and intensity of the southern westerly wind belt. Nature Geoscience 3, 695–699. 600
Landais, A., Masson-Delmotte, V., Stenni, B., Selmo, E., Roche, D., Jouzel, J., Lambert, F., Guillevic, M., Bazin, L.,
601
Arzel, O., Vinther, B., Gkinis, V., Popp, T. (2015). A review of the bipolar see–saw from synchronized and high
602
resolution ice core water stable isotope records from Greenland and East Antarctica, Quaternary Science Reviews,
603
114, 18-32
604
Merchel, S., Bremser W., Alfimov V., Arnold M., Aumaître G. , Benedetti L., Bourlès D. L.,Caffee M. 605
Fifield L. K., Finkel R. C., Freeman S. P. H. T., Martschini M., Matsushi Y., Rood D. H., Sasa K., Steier 606
P., Takahashi T.,Tamari M. , Tims S. G. , Tosaki Y., Wilcken K. M., Xu S. (2011). Ultra-trace analysis 607
of 36Cl by accelerator mass spectrometry: an interlaboratory study. Anal Bioanal Chem DOI 608
10.1007/s00216-011-4979-2 609
Otto-Bliesner, B. L., E. Brady, G. Clauzet, R. Tomas, S. Levis, and Z. Kothavala, 2006a: Last glacial 610
maximum and holocene climate in CCSM. J. Climate, 19, 2526–2544. 611
26 Pahnke, K., Sachs, J.P. 2006. Sea surface temperatures of southern midlatitudes 0-160 kyr BP. 612
Paleoceanography, 21, PA2004, doi:10.1029/2005PA001191
.
613Parrenin, F., Masson-Delmotte, V., Köhler, P., Raynaud, D., Paillard, D., Schwander, J., Barbante, C., 614
Landais, Wegner, A., Jouzel, J. 2013. Synchronous Change of Atmospheric CO2 and Antarctic 615
temperature during the last deglacial warming. Science, 339, 1060-1063. 616
Phillips, F.M., Stone, W.D., Fabryka-Martin, J.T., 2001. An improved approach to calculating low-energy 617
cosmic-ray neutron fluxes near the land/atmosphere interface. Chem. Geol. 175, 689–701. 618
Poggi, A. 1977. Heat Balance in ablation area of Ampere Glacier (Kerguelen Islands). J. Appl. Meteorol., 619
16, 48-55, doi:10.1175/1520 0450(1977)016<0048:HBITAA>2.0.CO;2. 620
Putnam, A Schaefer, J., Denton, G.H., Barrel, D.J.A., Anderson, R.F., Koffman, T.N.B., Rowan, A.V., 621
Finkel, R.C., Rood, D.H., Schwartz, R., Vandergoes, M.J., Plummer, M.A., Brocklehurst, S.H., Kelley, 622
S.E., Ladig, K.L. 2013. Warming and glacier recession in the Rakaia valley, Southern Alps of New 623
Zealand, during Heinrich Stadial 1. EPSL, 382, 98-110. 624
Rind, D., J., Lerner, J., C. McLinden, C., Perlwitz1, J. 2009. An analysis of the Stratospheric ozone during 625
the Last Glacial Maximum. GRL 36, L09712, doi:10.1029/2009GL037617, 626
Rojas, M., Moreno, P., Kageyama, M., Crucifix, M., Hewitt, C., Abe-Ouchi, A., Ohgaito, R., Brady, E.C., 627
Hope, P. 2009. The Southern Westerlies during the last glacial maximum in PMIP2 simulations. Clim 628
Dyn, 32, 525–548. 629
Schaefer, J., Putnam A.E., Denton, G.H., Kaplan, M.R., Birkel, S., Doughty, A.M., Kelley, S., Barrel, 630
D.J.A., Finkel, R.C., Winckler, G., Anderson, R.F., Ninneman, U.S., Barker, S., Swartz R., Andersen B., 631
G., Schluechter, C. 2015. The Southern Glacial maximim 65,000 years ago and ist unfinished termination. 632
QSR. 114, 52-60. 633
Schimmelpfennig, I., Benedetti, L., Finkel, R., Pik, R., Blard, P.-H., Bourlès, D., Burnard, P., and Williams, 634
A., 2009. Sources of in-situ 36 Cl in basaltic rocks. Implications for calibration of production rates: 635
Quaternary Geochronology 6, 441-461. 636
Schimmelpfennig, I., Benedetti, L., Garreta, V., Pik, R., Blard, P.-H., Burnard, P., Bourles, D., Finkel, R., 637
Ammon, K., Dunai, T., 2011. Calibration of cosmogenic 36 Cl production rates from Ca and K spallation 638
in lava flows from Mt. Etna (38 N, Italy) and Payun Matru (36 S, Argentina): Geochimica et 639
Cosmochimica Acta 75, 2611-2632 640
Schimmelpfennig, I. Schaefer, J., Putnam, A., Koffman, T., Benedetti, L., Ivy-Ochs, S., ASTER Team, 641
Schlüchter, C., 2014. 36Cl production rate from K-spallation in the European Alps (Chironico landslide, 642
Switzerland). Journal of Quaternary Science 29, 407–413. 643
Sharma, P., Kubik, P.W., Fehn, U., Gove, H.E., Nishiizumi, K., Elmore, D., 1990. Development of 36Cl
644
standards for AMS. Nuclear Instruments and Methods in Physics Research Section B 52, 410-415. 645
27 Sime, C.C., Kohfeld, K.E., Le Quéré, C., Wolff, E.W., de Boer, A.M., Graham, R.M., Bopp, L. (2013). 646
Southern Hemisphere westerly wind changes during the Last Glacial Maximum: model-data comparison. 647
Quaternary Science Reviews 64, 104-120. 648
Stenni, D., Masson-Delmotte, V., Selmo, E., Oerter, H., Meyer, H., Rothlisberger, R. Jouzel, J.,Cattani, 649
O., Falourd, S. , Fischer, H., Hoffmann, G. Iacumin, P. Johnsen, S.J., Minster, B., Udisti R. 2010. The 650
deuterium excess records of EPICA Dome C and Dronning Maud Land ice cores (East Antarctica). 651
Quaternary Science Reviews 29, 146–159. 652
Stenni, B., Buiron, D., Frezzotti, M., Albani, S., Barbante, C., Bard, E., Barnola, J. M., Baroni M., 653
Baumgartner, M., Bonazza, M., Capron, E., Castellano, E., Chappellaz, J., Delmonte, B., Falourd, 654
S.,Genoni, L., Iacumin, P., Jouzel, J., Kipfstuhl, S., Landais, A., Lemieux-Dudon, B., Maggi, V., Masson-655
Delmotte, V., Mazzola, C., Minster, B., Montagnat, M., Mulvaney, R., Narcisi, B., Oerter, H., Parrenin, 656
F., Petit, J. R., Ritz, C., Scarchilli, C., Schilt, A., Schüpbach, S., Schwander, J., Selmo, E., Severi, M., 657
Stocker, T. F., Udisti, R. 2011. Expression of the bipolar see-saw in Antarctic climate records during the 658
last deglaciation. Nature Geoscience. 4, 46-49. 659
Stone, J.O., 2000. Air pressure and cosmogenic isotope production. Journal of Geophysical Research 105, 660
23753-23759. 661
Stone J.O., Fifield, K., Vasconcelos, P., 2005. Terrestrial chlorine-36 production from spallation of iron. 662
Abstract of 10th International Conference on Accelerator Mass Spectrometry. September 5-10, 2005, 663
Berkeley, USA. http://llnl.confex.com/llnl/ams10/techprogram/P1397.HTM. 664
Thompson, D.W.L., Wallace, J.M., 2000. Annular modes in the extratropical circulation. Part 1: Month to 665
month variability. J. Climate, 13, 1000-1016. 666
Thompson, D. W. J., Solomon, S., Kushner, P.J., England, M.H., Grise, K.M., Karoly, D.J., 2011. Signatures 667
of the Antarctic ozone hole in Southern Hemisphere surface climate change. Nature Geoscience 4, 741-668
749. 669
Vallon, M. 1977a. Bilan de masse et fuctuations recentes du Glacier Ampere (Iles Kerguelen, TAAF). 670
Zeitschrift fur Gletscherkunde und Glazialgeologie, 13, 55-85. 671
Vallon, M. 1977b. Topographie sous glaciaire du Glacier Ampere (Iles Kerguelen, TAAF). Zeitschrift fur 672
Gletscherkunde und Glazialgeologie, 13, 37-55. 673
Vallon, M. 1987. Glaciologie a Kerguelen, Proceedings of the Colloque C.N.F.R.A. sur la Recherche 674
Francaises dans les Terres Australes, Strasbourg, 11-17 September 1987. 675
Verfaillie, D., Favier, V., Dumont, D. Jomelli, V., Gilbert, A., D. Brunstein, D., H. Gallée, H. Frenot Y., 676
2015. Recent glacier decline in the Kerguelen Islands (49°S, 69°E) derived from modeling, field 677
observations, and satellite data. JGR 120, 637-654. 678
28 Vimeux, F., Cuffey, K. M., Jouzel, J. 2002. New insights into Southern Hemisphere temperature changes 679
from Vostok ice cores using deuterium excess correction, Earth Planet. Sci. Lett., 203, 829–843, 680
doi:10.1016/S0012-821X(02)00950-0. 681
WAIS Divide Project Members 2015. Precise interpolar phasing of abrupt climate change during the last 682
ice age. Nature 520, 661-665. 683
Watanabe, O., Jouzel, J., Johnsen, S., Parrenin, F., Shoji, H., Yoshida, N., 2003. Homogeneous climate 684
variability across East Antarctica over the past three glacial cycles. Nature 422, 509– 512. 685
686
Author Contributions: V.J., D.B., D.V., V.R., C.L. and V.F. conducted the field work on the Island; F.M. produced 687
the cosmogenic data, ASTER Team performed AMS measurements; I.S., V.M., V.R. and V.J. interpreted the
688
cosmogenic ages; A.L. V.J. interpreted the ice core signal; V.J. and I.S. prepared figures and V.J., I.S., V.R., V.F.,
689
D.V. and A.L. contributed to writing the paper.
690 691 692 693 694 695 696 697 698 699 700 701