HAL Id: hal-01359851
https://hal.archives-ouvertes.fr/hal-01359851
Submitted on 12 Sep 2016
HAL is a multi-disciplinary open access
archive for the deposit and dissemination of
sci-entific research documents, whether they are
pub-lished or not. The documents may come from
teaching and research institutions in France or
abroad, or from public or private research centers.
L’archive ouverte pluridisciplinaire HAL, est
destinée au dépôt et à la diffusion de documents
scientifiques de niveau recherche, publiés ou non,
émanant des établissements d’enseignement et de
recherche français ou étrangers, des laboratoires
publics ou privés.
Jérémy Moriot, Laurent Maxit, Jean-Louis Guyader, O. Gastaldi, Jocelyn
Perisse, Benoit Migot
To cite this version:
Jérémy Moriot, Laurent Maxit, Jean-Louis Guyader, O. Gastaldi, Jocelyn Perisse, et al.. Experimental
results of passive vibro-acoustic leak detection in SFR steam generator mock-up. Advancements in
Nuclear Instrumentation Measurement Methods and their Applications, Jun 2013, Marseille, France.
�10.1109/ANIMMA.2013.6727942�. �hal-01359851�
Abstract— Regarding to GEN 4 context, it is necessary to fulfil the high safety standards for sodium fast reactors (SFR), particularly against water-sodium reaction which may occur in the steam generator units (SGU) in case of leak. This reaction can cause severe damages in the component in a short time. Detecting such a leak by visual in-sodium inspection is impossible because of sodium opacity. Hydrogen detection is then used but the time response of this method can be high in certain operating conditions. Active and passive acoustic leak detection methods were studied before SUPERPHENIX plant shutdown in 1997 to detect a water-into-sodium leak with a short time response. In the context of the new R&D studies for SFR, an innovative passive vibro-acoustic method is developed in the framework of a Ph.D. thesis to match with GEN 4 safety requirements. The method consists in assuming that a small leak emits spherical acoustic waves in a broadband frequency domain, which propagate in the liquid sodium and excite the SGU cylindrical shell. These spatially coherent waves are supposed to be buried by a spatially incoherent background noise. The radial velocities of the shell is measured by an array of accelerometers positioned on the external envelop of the SGU and a beamforming treatment is applied to increase the signal-to-noise ratio (SNR) and to detect and localize the acoustic source. Previous numerical experiments were achieved and promising results were obtained. In this paper, experimental results of the proposed passive vibro-acoustic leak detection are presented. The experiment consists in a cylindrical water-filled steel pipe representing a model of SGU shell without tube bundle. A hydrophone emitting an acoustic signal is used to simulate an acoustic monopole. Spatially uncorrelated noise or water-flow induced shell vibrations are considered as the background noise. The beamforming method is applied to vibration signals measured by a linear array of accelerometers on the shell. Satisfying results are obtained regarding to detection and localization of the source smothered by the background noise.
Index Terms — SFR, SGU, Sodium, Steam Generator, beamforming, passive acoustic leak detection.
This research was carried in the framework of the LabEx CeLyA ("Centre Lyonnais d'Acoustique", ANR-10-LABX-60) by the LVA/ INSA de Lyon, in collaboration with AREVA and the CEA (Commissariat à l’Energie Atomique
et aux Energies Alternatives) within the framework of a co-financing
partnership. The authors are grateful for the interest and financial support received from these two entities.
J. Moriot and O. Gastaldi are with DEN/STPA/LIET, Centre CEA de CADARACHE, 13115 Saint Paul Lez Durance, France (e-mail: jeremy.moriot@gmail.com).
L. Maxit and J-L. Guyader are with Laboratoire Vibrations Acoustique, INSA-Lyon, F-69621, France.
J. Périsse is with Areva Company, 10 rue Juliette Récamier, 69006 Lyon, France.
B. Migot is with Areva Company, 30 Bd Industrie, 71200, Le Creusot, France.
I. INTRODUCTION
HE fast and reliable detection of a leak in a steam generator unit (SGU) of a sodium fast reactor (SFR) inducing a water-sodium reaction is of capital interest to fulfil to GEN 4 safety standards. This reaction can cause severe damage in the component in a short time. This paper presents a passive vibro-acoustic method to detect and locate the noise generated by such a leak inside the SGU. One considers the passive beamforming method applied to signals from an array of sensors that measure the vibrations field of the steam generator cylindrical shell. The beamforming technique has been developed extensively since the middle of the 20th century to detect far-field acoustic sources in the naval field [1]. Its robustness and ability to detect sources buried in noise has led to an intensive use in sonar systems for anti-submarine warfare. More recently, improved beamforming treatment have been used to locate an acoustic source in a reverberant environment [2], to characterise acoustic sources of manufactured products [3-4] or for tracking vehicles [5]. Beamforming methods have also been applied as non-intrusive tools in many industrial applications to detect structural defects in complex structures [6-7]. More specifically, different studies focussing on active and passive leak detection techniques in SFR SGU have been published in the past [8-10]. The paper by Kim et al. [11] focussed on characterising the acoustic noise spectra of different water-into-sodium leaks for a small leak flow (<1g/s). Chikazawa [12] applied a beamforming method to detect a leak at a frequency of 10 kHz in a SGU assuming that it emits a planar acoustic field. This assumption, which seems reasonable in the high frequency domain, necessitates a high number of sensors to cover the whole steam generator.Sing and Rao [13] looked at detecting the water injection into liquid sodium by measuring the external acoustic field with microphones located far from the system. Such a system is very simple but may be easily disturbed by external acoustic sources.
The beamforming requires spatial filters which are calculated considering the signal to detect and the background noise to reject. In the case of an acoustic field generated by a far-field source, without background noise, it can be assumed that the signal measured is a plane wave and that the Somerfield’s conditions are met. It is then possible to determine the angular incidence of the wave by processing the measured signal using a simple spatial filter. In our particular case, the source to detect is located close to the array in a
Experimental results of passive vibro-acoustic
leak detection in SFR steam generator mock-up
J. Moriot, L. Maxit, J-L. Guyader, O. Gastaldi, J. Périsse, B. Migot
determining the angular incidence of the wave is insufficient in order to locate the source. Choi and Kim [14] estimated errors resulting of the sphericity of the incident acoustic field, using beamforming and MUSIC methods in acoustic medium. Furthermore, the array measures the radial vibration field of the shell which results of a strong interaction between the fluid and the elastic shell. To the author’s knowledge, the detection of a near-field acoustic source has never been investigated in a fluid-filled elastic shell with a beamforming method applied to vibrational signals measured on the shell.
This paper presents experimental results obtained on a fluid-filled cylindrical shell representing a model of SGU. The system is excited by a harmonic acoustic source emitted by a hydrophone located in the fluid. This source is supposed to be small enough to be considered as an acoustic monopole. Applying the beamforming treatment, it is possible to locate the hydrophone by assuming a position of it in a detection space and by increasing the signal to noise ratio (SNR) at the real position of the source more than other assumed positions.
The background noise in a SGU is mainly due to the vibrations induced by the sodium flow on the external shell. Two kinds of background noise are considered in this paper: the ambient noise which is spatially incoherent and the noise generated by a turbulent water flow which is coherent.
The experimental system and the beamforming method are described in section II. It consists in applying a spatial filter to the signal measured by the array of accelerometers. The calculation of this spatial filter and its application are described in detail in this section. The method is tested on 4 signals having different SNR and background noise profiles. These experimental results are presented and discussed in section III. Conclusions and perspectives of the present experiment are given in section IV.
II. PRESENTATION OF THE EXPERIMENTAL SYSTEM AND
BEAMFORMING TECHNIQUE
A. Presentation of the Experimental Mock-up
As shown in Fig.1, the experiment mock-up consists in exciting a cylindrical pipe made of stainless steel and filled with water. The pipe is a reduced scale of a straight sodium envelope modular SGU for GEN-4 ASTRID project (Advanced Sodium Technological Reactor for Industrial Demonstration). The tube bundle has no significant effect on the acoustic wave propagation below a critical frequency
= /2 [15] where is the acoustic phase speed and
is the distance between each tube. This frequency exceeds 60 kHz for the SGU considered whereas the maximum frequency considered in this paper is 10 kHz.
This experiment has been done to validate the method which was previously tested on a numerical model. In order to keep the same numbers of acoustic wavelength along the radius of the real SGU and the mock-up, we define
γ
L as the hydraulic diameter and thickness scale ratio between the real SGU and the mock-up. To calculate this ratio, we have to consider that an effect observed at a certain frequency in thebecause of diameter and internal fluid changes. To take this into consideration, the scale ratio is equal to the ratio of the acoustic wavelength = / in these two media. Then we obtain:
0
/
0'
0/ (
0'
)
L
c
c
fγ
=
λ λ
=
γ
, (1)where c0 and c0’ are the acoustic phase velocity in the sodium and in the water, respectively and γf = f'/ f is the ratio of the frequencies in the mock-up and in the SGU. Setting the mock-up diameter at 0.22 m and the maximum frequency of the excitation at 15 kHz in the mock-up, we obtain = 3.6 and = 2.4.
The length of the pipe is then fixed to 306 cm, its external radius to 21.9 cm and its thickness to 0.82 cm.
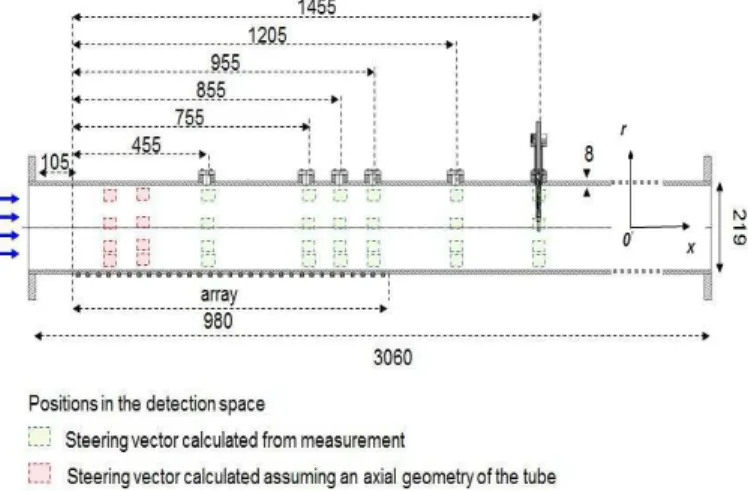
In order to simulate the noise generated by a sodium leak, a hydrophone B&K 8103 is excited by a harmonic signal (assumption of an acoustic monopole source). The amplitude and frequency of the signal can be controlled. The source can be positioned at the six positions represented by green squares in Fig. 1. The hydrophone with its support is represented in Fig. 2.
The background noise can be controlled by maintaining the flow regime with the speed of pump. The maximum water flow velocity is 2.1 m/s (70 L/s).
Fig. 1. Scheme of the scale experiment.
A 1 m length linear array composed of 50 accelerometers Kistler 8704B50 regularly spaced is used to sample the radial vibration field of the fluid filled pipe when it is excited by an acoustic source. The whole experiment has been performed inside Areva test facilities in Technical Center Le Creusot. The distance between the accelerometers has been set in order to ensure a correct spatial sampling of the flexural wavelength given by:
= 2 / 2 . (2)
, ℎ and ! = "ℎ#/12(1 − ') are the mass density, the thickness and the flexural rigidity of the shell, respectively. "
and ' are the Young’s modulus and Poisson coefficient of stainless steel, respectively. The flexural wavelength at 15 kHz, calculated with (2) is 5 cm.
Fig. 2. Acoustic excitation system.
The signals from the accelerometers are recorded with a PULSE B&K acquisition system. Applying a fast Fourier transform (FFT) to the signals measured by the 50 accelerometers gives us the spectral acceleration at each sensor position. Spectral accelerations measured by all the accelerometers of the array constitute a spatial sample of the radial acceleration field on the structure, at each frequency. These measurements are analysed by the beamforming algorithm to detect and localize the emitting hydrophone in the water.
Fig. 3. Picture of the mock-up
B. General Principle of the Beamforming Method
The beamforming technique consists in filtering the vibration field )*+, measured by the array when the hydrophone is at the position (-,, /,) of the detection space by steering vectors 0+1 corresponding to all possible positions (-1, /1) of the detection space. The general formula to calculate steering vectors assuming a completely incoherent background noise is: (3) * u u u
V
F
V
=
.)*+1 is the vibration field when the hydrophone is at the position
(-1, /1). It is a row vector of size 50. In order to study the
effect of the spatial filter applied in the beamforming, we consider the normalized beamforming output value:
/
u u s
y
=
y
σ
. (4)2, is the maximum Auto-Spectrum Density (ASD). We call reference sensor the sensor having the maximum ASD.
In (4), the output value of the beamforming is a scalar given for the steered position u by:
†
u u s u
y
= Γ
F
F
. (5)s
Γ
is the cross-spectrum (50 5 50 matrix) of the signal measured:†
s
V V
s sΓ =
. (6)By nature, the product (5) must be maximum when u=s. Steering vectors 0+1 are evaluated experimentally by measuring signals on the array for the different positions u in the detection space
Ω
.With the present mock-up, the detection space is constituted by the 32 green and red squares represented in Fig. 1. Green squares represent the positions where the hydrophone can be located. The vibration field due to the hydrophone excitation can then be measured and the steering vector corresponding to these positions can be calculated using (3). Assuming an axial symmetry of the tube relative to the centre of the array, we define fictive steering vectors corresponding to the positions represented by red squares in Fig. 1.
Axial positions x correspond to the 8 positions defined in (Fig. 1). In cylindrical co-ordinates radial positions r considered in the detection space are -64 mm, -2 mm, 47 mm and 88 mm.
III. EXPERIMENTAL RESULTS
A. Source and Background Noise
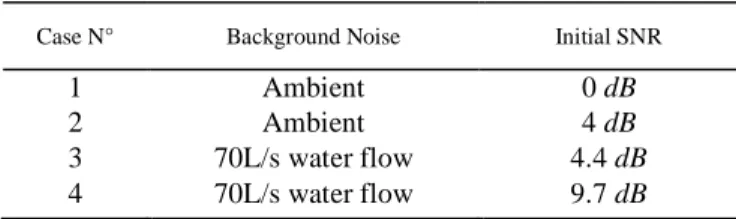
The hydrophone located in the water at the position xs = 755 mm and rs = 47 mm emits a sinusoidal signal at a frequency 6 kHz. Vibrations are recorded during 5 s by the 50 accelerometers. The sampling frequency is 32768 Hz. The cross-spectrum between these accelerometers is calculated at 6 kHz using (6). One considers 4 experimental configurations in term of background noise and SNR which are given in Table 1. Two different background noises are considered. In cases 1
is due to the electronic noise of the sensors themselves and the ambiance noise in the experimental building. We call it “ambient noise”. In cases 3 and 4, the background noise is due to vibrations induced by the turbulent water flow at 70 L/s.
The SNR is defined by
/
s Bg
SNR
=
σ σ
. (7)where
σ
s is the maximum ASD at 6 kHz when we measure the signal corresponding to a specific case andσ
Bg is the maximum ASD at 6 kHz when we measure the background noise alone.TABLEI
EXPERIMENTAL CONFIGURATIONS OF HARMONIC EXCITATIONS
Case N° Background Noise Initial SNR
1 Ambient 0 dB
2 Ambient 4 dB
3 70L/s water flow 4.4 dB
4 70L/s water flow 9.7 dB
The coherence between each pair of accelerometers is showed in Fig. 4 when the system is excited by a turbulent water flow at 70 L/s (Fig. 4.a) or when ambient noise is recorded (Fig. 4.b). This figure shows that the turbulent flow induces a partially coherent vibration field whereas the ambient noise is completely incoherent. From Fig. 4, we can attend to obtain a better result with the first two cases than others. Indeed, most the background noise is incoherent, better the beamforming treatment is efficient.
Fig. 4. Coherency between each pair of sensors for a turbulent flow induced vibration (a) and ambient noise (b).
B. Hydrophone Source Detection and Localization
The output values of the beamforming treatment calculated using (4) and (5) are represented in dB in Fig. 5 for each position in the detection space. In Fig. 4.a one considers the cross-spectrum of the ambient background noise alone. In Fig. 5.b and Fig. 5.c. one considers the cross-spectra corresponding to the cases 1 and 2, respectively. The position of the hydrophone is represented by a black circle whereas the
(a) incoherent background noise
(b) case 1
(c) case 2
Fig. 5. Beamforming output values for each position of the detection space, at 6 kHz if one considers only the incoherent background noise (a), the case 1 (b) and the case 2 (c). o: position of the hydrophone; x: position of the accelerometers.
In Fig. 5.a, the input signal is the cross-spectrum of the ambient noise. Output values of the beamforming are close to 0 dB and almost uniform on the detection space. In the case of a completely spatially incoherent noise, no source position is discriminated and no gain is added by the beamforming. In case 1, when the hydrophone emits a signal with a SNR equal to 0 dB (Fig. 5.b) the beamforming output is no longer uniform on the detection space. It reaches 4 dB at the hydrophone position which corresponds to the primary lobe of the beamforming output. Side lobes appears at positions (55, -2), (1205, 47) and (755, -64), on which the output value reaches about 2 dB. As the initial SNR is around 0 dB, the array gain is around 4 dB. In Fig. 5.c the SNR increases to 4 dB. The output value is about 8 dB at the source position and around 5 dB at side lobes positions. The detection seems to be effective when the background noise corresponds to a spatially incoherent noise.
Fig. 6 presents the output value of the beamforming when one considers the cross-spectrum of the background noise induced by a turbulent water flow at 70 L/s (Fig. 6.a) and the cross-spectra corresponding to the cases 3 and 4 (Fig. 6.b and 6.c, respectively).
(a) background noise induced by a turbulent water flow
(b) case 3
(c) case 4
Fig. 6. Beamforming output values for each position of the detection space, at 6 kHz if one considers only the background noise induced by a turbulent water flow (a), the case 3 (b) and the case 4 (c). o: position of the hydrophone; x: position of the accelerometers.
In Fig. 6.a, contrary to what one observed in the case of as incoherent signal (Fig. 5.a), output values reach 8 dB and are not uniform on the detection space. This situation may lead to a false detection since it can be interpreted as source representative to a leak noise. In Fig. 6.b, the harmonic signal is present and the SNR is 4.4 dB. One observes a focalization of the output at the position of the source. Side lobes appear at the same position than in Fig. 5 since their position is related to the frequency of the excitation. In Fig. 6.c., increasing the SNR to 9.7 dB leads to increase the focalization by keeping constant the output value at the primary lobe whereas it decreases at other positions. Here again, the localization seems to be more effective when the SNR is stronger. When the background noise does not respect totally the assumption of spatial incoherence the method can leads to a false detection in absence of source since the output values on the detection space are not uniform. Nevertheless, when the source is present, its detection is effective since one observes an increase of the beamforming output value at the hydrophone position more than other positions.
IV. CONCLUSION
The beamforming method has been applied to a very specific case: the detection of an acoustic source in a cylindrical tube filled with water using an array of accelerometers measuring radial accelerations of the shell. Because of its robustness, this technique has been investigated as a passive and non-intrusive solution to detect a sodium-water reaction in a SGU of a SFR. The importance of determining properly the steering vectors which are used to
filter the signal measured by the array of sensors has been highlighted. This can be done using a numerical model having a high degree of reliability or by measuring radial accelerations of the shell experimentally for different positions of the source. The second solution has been employed here. It necessitates a preliminary “learning phase” to create a base of steering vectors.
The detection and the localization of a hydrophone emitting a harmonic signal at have been investigated considering two different background noises. In the case of a completely spatially incoherent background noise, such as ambient electronic noise, the method shows very good results. The SNR is improved by 4 dB at the source position in the case of a smothered source and by 8 dB in a more favorable case (with a higher SNR). The response time to detect the source is equal to the recording period plus the time necessary to calculate the cross-spectrum between each pair of accelerometers of the array (which depends of the computing power).
In the case of a spatially coherent background noise, such as vibrations induced by a turbulent water flow, the beamforming output improves the signal at different positions in absence of source. When the source is present, results are similar to those obtained with an incoherent noise. Different “high resolution” methods such as Capon method can be used to calculate a spatial filter including the cross-correlation matrix of the background noise to reject it [16]. These methods are useful in the case of a stationary background noise. In a SGU it may fluctuate and Capon method may not be efficient.
V. REFERENCES
[1] R. J. Urick, “Properties of Transducer Arrays: Directivity Index,” in
Principles of Underwater Sound, 3rd ed., Ed. McGraw-Hill, 1983, USA. [2] P. Castellini, A. Sassaroli, “Acoustic source localization in a reverberant environment by average beamforming,” Mech. Syst. Signal. Process., vol. 24 pp. 796-808, Apr. 2010.
[3] K.R. Holland, P.A. Nelson, “An Experimental Comparison of the Focused Beamformer and the Inverse Method for the Characterisation of Acoustic Sources in Ideal and non-ideal Acoustic Environments,” J.
Sound Vibrat., vol. 331, pp. 4425-4437, Sep. 2012.
[4] E. Tiana-Roig, F. Jacobsen, E.F. Grande, “Beamforming with a Circular Microphone Array for Localization of Environmental Noise Source,” J. Acoust. Soc. Am., vol. 128, pp. 3535-3542, Dec. 2010.
[5] P. Marmaroli, J-M. Odobez, X. Falourd, H. Lissek. (2011, Aug). A Bimodal Sound Source Model for Vehicle Tracking in Traffic Monitoring. Presented at Conference EUSIPCO. [paper] Available: http://www.researchgate.net/publication/50981166_A_Bimodal_Sound_ Source_Model_for_Vehicle_Tracking_in_Traffic_Monitoring
[6] Y. Choi Y. Kim, “Near Field Impulsive Source Localization in a Noisy Environment,” J. Sound Vibrat. vol. 303, pp. 209-220, Jun. 2007 [7] G.C. McLaskey, S.D. Glaser, C.U. Grosse, “Beamforming Array
Techniques for Acoustic Emission Monitoring of Large Concrete Structures,” J. Sound Vibrat. vol. 329, pp. 2384-2394. Jun. 2010 [8] T. Kim, V. S. Yughay, S. Hwang, K. Jeong, J. Choi, “Advantages of
Acoustic Leak Detection System Development for KALIMER Steam Generators,” J. Korean Nucl. Soc. vol. 33 pp. 423-440, Jan. 2001. [9] L. Oriol, C. Journeau, (1995, France). Active Acoustic Leak Detection
in Steam Generator Units of Fast Reactors. Presented at Conference SMORN VII. [paper]. Available: http://www.oecd-nea.org/science/docs/pubs/smorn7-v1.pdf
[10] K. Hayashi, Y. Shinohara, K. Watanabe, “Acoustic detection of in-sodium water leaks using twice squaring method,” Ann. Nucl. Energy, vol. 23, pp. 1249-1259, Oct. 1996.
[11] T. Kim, V. S. Yugay, J. Jeong, J. Kim, B. Kim, T. Lee, Y. Lee, Y. Kim, D. Hahn, “Acoustic Leak Detection Technology for Water/Steam Small
Nucl. Technol. vol. 170, pp. 360-369, May 2010
[12] Y.Chikazawa. (2009, Japan). Development of an acoustic steam generator leak detection system using delay-and-sum beamformer. Presented at Conference ICAPP’09. [paper].
[13] R.K. Singh, A.R. Rao, “Steam Leak Detection in Advance Reactors via Acoustics method,” Nucl. Eng. Des. vol. 241, 2448–2454, Jul. 2011. [14] J. Choi and Y. Kim, “Spherical beam-forming and MUSIC methods for
the estimation of location and strength of spherical sound sources,” Mech. Syst. Signal Process. vol. 9, 569-588, Sept. 1995.
[15] M. A. Heckl and L. S. Mulholland, “Some recent developments in the theory of acoustic transmission in tube bundles,” J. Sound Vibrat., vol. 179, pp. 37-62, 1995.
[16] W. Zhang, J. Wang, Q. Wu, “Robust Capon beamforming against large DOA mismatch,” Signal Process., vol. 93, pp. 804-810, Oct. 2012.