HAL Id: hal-01616746
https://hal.archives-ouvertes.fr/hal-01616746
Submitted on 14 Oct 2017HAL is a multi-disciplinary open access
archive for the deposit and dissemination of sci-entific research documents, whether they are pub-lished or not. The documents may come from teaching and research institutions in France or abroad, or from public or private research centers.
L’archive ouverte pluridisciplinaire HAL, est destinée au dépôt et à la diffusion de documents scientifiques de niveau recherche, publiés ou non, émanant des établissements d’enseignement et de recherche français ou étrangers, des laboratoires publics ou privés.
Revisiting the structuring effect of transportation
infrastructure: an empirical approach with the French
Railway Network from 1860 to 1910
Christophe Mimeur, François Queyroi, Arnaud Banos, Thomas Thévenin
To cite this version:
Christophe Mimeur, François Queyroi, Arnaud Banos, Thomas Thévenin. Revisiting the structuring effect of transportation infrastructure: an empirical approach with the French Railway Network from 1860 to 1910. Historical Methods: A Journal of Quantitative and Interdisciplinary History, Taylor & Francis (Routledge), 2018, 51 (2), pp.65-81. �10.1080/01615440.2017.1393358�. �hal-01616746�
Revisiting the structuring effect of transportation infrastructure:
an empirical approach with the French Railway Network from
1860 to 1910
Christophe Mimeur 1, François Queyroi 2*, Arnaud Banos 2, Thomas Thévenin 1
Abstract
The development of the French railway network was mostly planned in a centralized manner. Despite the multiplication of travel opportunities, the local impact on the demographics is often given as an indirect effect of this spatial transformation. However, this “structuring effect” is still subject to controversies within the academia.
In this paper, we construct a historical geographic information system describing the evolution of the French network. We use it to compute accessibility measures based on network access and travel durations. We first observe than the network growth indeed achieved the various planning goals in term of functional accessibility. We then present further evidences that the “structuring effect” of the train network on cities demographics is very limited if not null.
Keywords : transportation infrastructure; French railroads; accessibility; structuring effect
1. Introduction
The opening of the first French railroads was perceived as a promise to “change the conditions of human existence” (Chevalier 1832). The transformation of the French society seemed obvious and would benefit the entire country by what is academically called “structuring effects”. While the accessibility gains are today the result of the opening of very high-speed lines (Bazin et al.. 2011), the first locomotives increased the speed of transportation six fold in the first half of the 19th century (Studeny 1995).
This paper discusses the process of acceleration along the railroads and explores the relations between the network development and demographic dynamics between 1860 and 1910 for cities with more than 2,500 inhabitants.
1CNRS, UMR8504 Géographie-cités (CNRS/Université Paris-1 PanthéonSorbonne/Université Paris Diderot) 2 TheMA, UMR6049 CNRS, Université de Bourgogne-Franche-Comté
We achieve this by using an original database, collected in a Historical Geographical Information System (Thévenin et al. 2013). We build from the H-GIS a graph linking each of the 36,000 French metropolitan “municipalities” (Mimeur 2016).
We will discuss firstly the potential of opportunity measures to have an access to the railway network, according to the hierarchy of the network. Our investigations suggest that the evolution of this transportation network reflects the great planning decisions of the 19th
century. They focused on the reachability to Paris followed by developments at a regional scale. Then we provide further evidences for the absence of correlation between the demographics at a local scale and the network growth based on the changes in multi-polar accessibilities. This suggests that the “structuring effect” of transportation network (if any) is limited when focusing on demographics.
In Section 2, we discuss the concept of “structuring effect” and the literature around it. In Section 3, we justify the temporal and spatial scales used and describe the modelisation of the transportation network as a graph. In Section 4, we adapt and revisit typologies (Alvarez et al. 2013; Bretagnolle 2003) which already exists to apprehend a network effect. Then we revisit accessibility measures and study the evolution of spatial differentiation over time. We define and analyse new multi-polar accessibility measures that focus on the contribution of the train network regardless of the location of the cities. We first confront the functional measures (distance to centres) with the great planning decisions of the 19th century and then compare
the multi-polar measures with demographic data. In Section 5, we provide concluding remarks as well as directions for future research.
2. State of the art
a. From mechanical to potential effects
The relationships between space and network is a popular thematic in geography, economy and sociology. This topic is particularly important in France not only for academic research but also for non-academic experts and decision makers (Bazin et al. 2011; Offner 2014, 1993). Despite the centrality of those issues, the “structuring effect” of transport infrastructures on the territory still remains a popular yet mostly unverified phenomenon.
The concept of “structuring effect” can be traced back to a political, economic and social doctrine. It was spread in France by State engineers following the theory of Saint-Simon (Dupuy 1987; Musso 1998). The ideology manifests itself by a “connexionist” ambition: unify and structure a nation through transportation networks (Howkins 1996). However, new inequalities appeared in terms of access and service supply (Ollivro 2000).
The first debate on the structuring effects of transportation infrastructures began with economists. Global and macroeconomic approaches demonstrated the role the railroads or highways play on national productivity (Boarnet 1995; Jenks 1944). Economists concluded that between a third and an half of American public investment to the Federal Aid Highway in 1956 improved national productivity (Keeler and Ying 1988). Others latter noted that the regress of American productivity was due to the decrease of public investments in
infrastructure (Aschauer 1989). Those debates continued as Fogel and Fishlow demonstrated the “passive role” of network development on the economy (Fishlow 1965; Fogel 1962): without the network, the economic losses would be less than 5% of the national income according to Fogel and less than 15% according to Fishlow.
The introduction of space first occurred with the development of growth pole theory (Perroux 1964; Chi et al. 2006). Researchers studied the differentiation between regions in terms of infrastructure especially in the context of European convergence (Vickerman 1995): the allocation of infrastructure is viewed as an economic factor of development. However, empirical studies on the relations between highway density and economic development show no evident statistical correlations (Crescenzi and Rodríguez-Pose 2008). They did not take into account intraregional differences and inequalities in terms of transport. Economists latter introduced location theory which integrates the notion of economies of scale made possible by the development of infrastructures (Hansen 1959; Krugman 1991; Quinet and Prager 2013). Econometrics researchers concluded that doubling highways’ length lead to a 15% employment increase (Duranton and Turner 2012). Others reported a 17% decline of the population of central cities with highways passing through (Baum-Snow 2007).
The existence of “structuring effect” is discussed. Evidences reported in previous studies suggest that network development does not imply a mechanistic wealth creation but a redistribution of growth conditions. This affirmation echoed in France with the provocative article of Jean-Marc Offner in 1993 describing the “structuring effect” as a political myth used to justify public investment and emphasizing the lack of methodological rigour in the literature (Offner 1993). This topic then was then investigated with fresh eyes in the French literature, this new line research even study the potential effects of stakeholders involvements (Offner 2014; Ureña et al. 2009).
Despite the existence of such strong positions in academia and the use of more nuanced terms to describe the effects of transportation infrastructure on territorial development, the relation between space and network remains mainly unverified. Recently, we could read that “transport infrastructure is a vital social and economic asset; it structures space and determines mobility” and that structuring effects may be spread over time: “decisions on infrastructure have impacts that last for decades, even centuries” (Short and Kopp 2005). Other contributions studied the causality in only one direction i.e. where new infrastructures would benefit from economic and territorial development (Chi 2012).
b. Spatial and temporal scales of “structuring effect”
We now discuss the spatial and temporal scales at which a “structuring effect” was investigated. The construction of a new transport infrastructure was often an opportunity to study territorial impacts. A good example is the Federal Aid Highway in the United States (Garrison, 1960). In France, studies were often made after the construction of new high-speed railroads (Facchinetti-Mannone 1995; Menerault 1997). In this context, one difficulty is to compare two situations (before and after the construction) due to the lack of precise data regarding an isolated new line (Bretagnolle 2014; Duranton and Turner 2012).
It is important to note that the demographical question was rarely investigated, except as a part of global economic development (Lichter and Fuguitt 1980). This remark especially applies to the studies of very high-speed railroads (Rietveld 1989) where population changes appear as an indirect consequence of labour market changes and structural demographic evolutions. Population change is affected by multiple factors like public policy (Banister and Berechman 2001). However, since long run studies are made harder by the lack of data, population change can be viewed as an “excellent summary of many functional properties” (Pumain 1997).
Most of the time, longitudinal analyses were conducted at a regional scale (Atack et al. 2010; Hornung 2012). But these approaches are not often associated with differentiated studies of localizations (Chi 2012; Martí-Henneberg 2011). They use simple approaches of network development across space: the network effect is studied with opening and closing dates of railroads despite of more and more sophisticated methods like GIS or econometrical technics (Kasrian et al. 2016). In France, Pumain concluded neither the opening or closing of stations nor the number of connections by train station had an influence on the demographic dynamics of cities (Pumain 1982). She also concluded that the network was influenced by the pre-existent urban hierarchy.
The simple presence or absence of entry points is however a limited way of assessing spatial discrepancies. Other studies take into account simple Euclidian distance to the nearest station (Alvarez et al. 2013 ; Hornung 2012). In the field of transportation geography, the concept of accessibility is often used in order to assess transportation opportunities (Geurs and Ritsema von Eck 2001; Kwan et al. 2003). Those measurements take into account opportunities of connections between cities, people, firms or activities (Holl 2007; Vandenbulcke et al. 2009).They can therefore be functional and be defined at multiple scales.
To conclude, the question of the “structuring effect” has been discussed within different disciplines and at different scales. Focusing on the railroads innovation and the demographic evolution, both large spatial and temporal scales are required to (re)introduce the concept of “structuring effect” (Bretagnolle 2014).
3. Data and structuration
This section explains how a Historical-GIS was built by assembling various historical sources. We describe the choices made in order to modelize the network and its evolution as multiple graphs. Those choices correspond to a trade off between historical accuracy and the generalisation imposed by the temporal and spatial scales used. It allows to build new measures along the network, which are still rarely used in long term studies of the impact of transportation infrastructure (Kasraian et al. 2016).
a. Historical GIS
Our approach is based on the idea of spatial heterogeneity. Using geographical information within a Geographical Information System (Wilson and Fotheringham 2008), we are able to
identify regularities, discontinuities and consider spatial dependencies (Anselin 1995). The study of railway development is enriched by the travel speed data as the first locomotives drastically decreased travel time duration in the 19th century.
The French data available were collected in a national research project called e-geopolis (Moriconi-Ebrard et al. 2010). Digitizing long-term census data series is a complex task due to the possible mutations of administrative boundaries and is still today one of the main challenges in the Geo-Humanities (Knowles 2005). However, in our case, the French administration boundaries were not subject to important mutations since the French Revolution (Motte et al. 2003): only 2 % of the 36 565 French “communes” (municipality) were affected by a change. Therefore, following (Gregory and Ell 2006) we use existing administrative units. Each municipality is then described by 19 different census data starting in 1831. Despite some errors or missing data in the 19th century, test validations suggest that
this database contain less than 4% of erroneous data (mostly missing data for small communes).
The originality of our work resides above all in the inventory of the French railroads network since its birth in the 1830s. The information is based on the actual railroads, vectorised from the Geographical National Institute (IGN). Then the digitalization of a map from the National French Railway Company (SNCF) is used to make an inventory of the densest railway network in the 1940s. In fact, the development of the French railroads network is characterised by many local service railroads in the countryside, financed by private initiatives. Diverse original sources like maps, tables, texts were collected to complete the H-GIS. Each section of the French railroads network has temporal attributes: opening and closing dates, the rail company owning the rails or the electrification date.
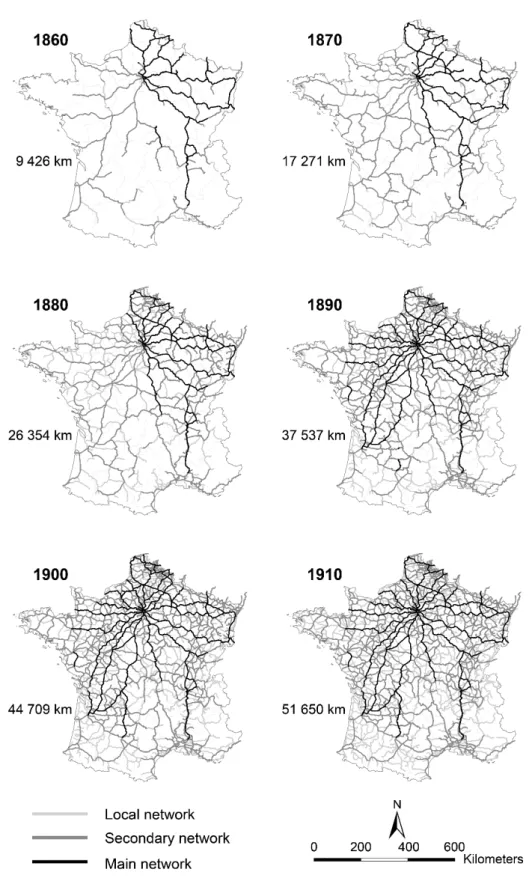
Around 56 000 kilometers of railway lines and about 11 000 stations are listed. The latter are associated with a commune, opening and closing dates. To explore the “speed revolution” (Studeny 1995), the estimation of speed along the entire network is required. This work is based on the estimation of speed according to the literature (Bretagnolle 2003) and a typology of lines between 1830 and 1930 (see Figure 1). This estimation was compared to a schedule guide from 1908 and speed maps from 1934 and 2001.
b. Modelling the railroad network in its geographic environment
Assessing the impact of railway network in space requires measuring its spatio-temporal evolution on the long run. Infrastructure-based accessibility measures (Geurs 2001; Ritsema, 2001) have the best potential but they require the transformation of linear data into a graph (Haggett et al. 1977) where points are stations and lines are railway sections. We do not consider here the frequency of trains making a stop in a given station as we do not have access to this data. Moreover, we assess the capacity to travel along the railway network without transfer time. The travel time to cross a given section is computed using the maximum speed, the length and the slope of the section according to a Digital Elevation Model (DEM). The result is an impedance indicator, which is necessarily dynamic over time because either the section may disappear or the maximum speed may change due to improvements of the infrastructure.
However, this first approach only takes into account cities connected to the network and it omits almost two-thirds of the French municipalities without train stations. Access to the railway network is necessarily discontinuous (Stathopoulos 1997) as oppose to the road network as 1) the railway network is very loose at the beginning of our period, 2) many municipalities are still not connected to the network. According to the bibliography on mobility in the long run (Flonneau and Guigueno 2009), most people were going to the station walking. The link between a city and a station should then be considered as a pedestrian segment. These links have to be integrated in a more comprehensive graph. Using the network by reaching the closest station may not be the best solution as walking to the second or the third may be faster.
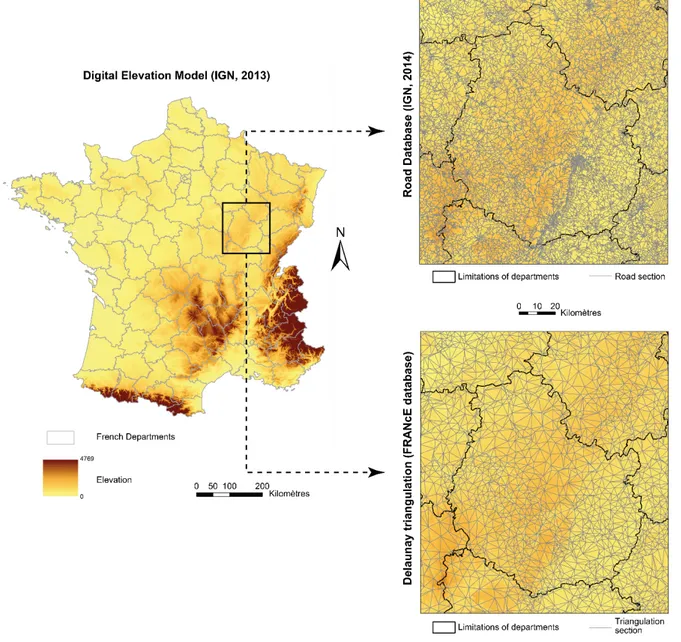
The estimation of real pedestrian routes has already been studied by archaeologists who proposed a decreasing function of speed according to the slope (Garmy et al. 2005) from a DEM (see left part of Figure 2). However, computing such indicators for all the pairs of cities in France is costly. An alternative solution would be to consider an actual roads database, composed of more than one million sections from country road to main road, without highways and high volume roads (see top of right part of Figure 2). The paths between cities are more relevant but the computation is still barely manageable. It can be argued that both of these solutions are of little interest since we focus on the comparison between travel durations instead of finding the “real” travel durations. We therefore use as a compromise a Delaunay triangulation (Delaunay 1934) between the 36 000 centroids of French “communes”. The new graph, derived from the Delaunay triangulation, is composed of 107,000 sections (see bottom
of right part of Figure 2). The graph we build is therefore the union of the edges representing
rail sections and the aforementioned triangulation. The difference between rail edges and walking edges only correspond to the speed difference. The speed along the railway network is at least six times higher than the walking speed. The loss of information is limited using this method (see Appendix I).
Figure 2 – Routes to railway stations: from DEM to Delaunay Triangulation
After estimating the routes to the railway station with a shortest path along the DEM, we compare travel durations given by using a road database and by using the Delaunay Triangulation. The results of those comparisons can be found in Appendix 1.
4. Methods
(Morris et al. 1979) defined accessibility according to four principles that can be adapted to a geohistorical approach (Mimeur 2016) : Accessiblity measure have to
translate the performance of a system transport, i.e. the “speed revolution” occurred in the 19th century ;
be coherent with models of behaviors, i.e. most people was travelling to the station by foot ;
be technically feasible, i.e. we have to adopt a formalism to study on long periods and the entire country ;
be easily interpretable, i.e. measures have to give a geohistorical sense.
Using these principles, we define in this section indicators reflecting the opportunities of network access and the travel speed increase due to the railway network. Some are based on existing works in history, economy or geography (Alvarez et al. 2013 ; Stanev et al. 2013, Franch et al. 2013).
The first indicator reflect network access opportunities and was proposed by (Bretagnolle 2003). We then present two categories of measures that are build around the notion of distance in graph theory: namely, the time required to reach a given local or national centres (called functional accessibility measures) and an indicator build around the average time required to reach other communes (called multipolar accessibility).
Functional and multipolar accessibilities measures are here defined in terms of travel duration. In order to avoid confusions, it is important to keep in mind that an increase (respectively a decrease) of those measures therefore correspond to an decrease (resp. an increase) of accessibility.
a. Opportunities of network access
The opportunities of network access can first be apprehended classically by a binary variable (Kasraian et al. 2016) describing the presence or absence of train stations. Obviously, it does not reflect the capacity for people that do not have a train station in their commune to reach a train station. But we can also identify two other limitations. First, different stations correspond to different access depending on the number of directions they have (being a “hub” or not). Second, the network have multiple scales corresponding to different type of lines (fast national or local). We suggest here the use of a discrete measure (see Figure 3) which combines two information (Bretagnolle 2003): the number of axes converging in a station and the quality of the infrastructure.
Figure 3 – The network access typology
b. Functional distance measures
The typology defined above does not provide a measure of the performance of the transport system. For that, we propose new accessibility measures that use the concept of travel duration.
We call “functional accessibility” a measure of the ability to reach a location of interest from a given city. In particular, we use as location of interest various centres of the French administration (the capital Paris, Regional centres and “department” centres).
The ability to reach those centres is given by the time duration of the fastest route. This corresponds to the usual graph theory definition of shortest path using time rather than length as edge weight. We use as graph the modelization described in Section 3.b. We do not take into account the frequency of train at the time. Therefore, the transition from the walking network to the train network is considered instantaneous. The walking and railway sections of the network are simply different in term of speed.
c. Multi-polar distances measures
“Multi-polar accessibility” refers here to the ability to reach multiple non-specific locations. The idea is to use a single measure that reflect the position of cities in the network. We define a measure of multi-polar accessibility that encompass population size and geographic positions. As for the functional accessibility discussed earlier, it is related to the concept of distance in networks. However, it should not be confused with centrality measures since a node can be very accessible as a neighbour of a central node (a hub) while not being central itself. Another common graph metric is the eccentricity i.e. the greatest distance from a city to another one (Harary 1969). We choose to adopt formulations of accessibility based on averaged values rather than maximum values. This allows to naturally take into account cities’ demographics (weighted averages).
We introduce a normalized mean time duration metric that assesses the multi-polar accessibility of a city regardless to its geographical positions. We believe that similar approaches could be use in different studies. A discussion and a comparison between different definitions can be found in Appendix II.
We note dG(u , v ) (respectively dT(u , v ) ) the multimodal (resp. walking) time duration
of travelling between city u and city v. We will use DGwn to denote the multi-polar
accessibility of a city DGwn (u)= 1
∑
wv∑
wv dG(u , v ) dT(u , v )with wv being the population size of city v and
∑
wv is the total population minus thenumber of inhabitants in u. Notice that the accessibility of u is high when DGwn is low.
This measure integrates the walking time duration and the population of other cities meaning that closer cities cities of average size may be more important than distant cities of larger sizes. This measure therefore indirectly incorporates a hidden functional hypothesis. Indeed, for a given city, the impact of the travel duration to Paris will important regardless of the walking distance due to the number of inhabitants in the capital. The impact of the travel duration to the city's regional centre will also be important due to its proximity and its size.
5. Results
We now investigate the evolution of the various measures during the chosen period 1860-1910. We first study the network coverage and accessibility indicators alone. We show that the network development followed centrally-made decisions. Then we show using that the data does not support the idea of a “structuring effect” of the network on demographics1.
We focus on a subset of French cities, taking only into account the “communes” that had more than 2500 inhabitants at least one time over the period. Indeed, cities of smaller sizes are more likely to have an erratic size evolution and several missing values. The threshold on cities size is the same as the one used in (Pumain 1982).
a. Investigating the planification strategies with network access typology and distance measures
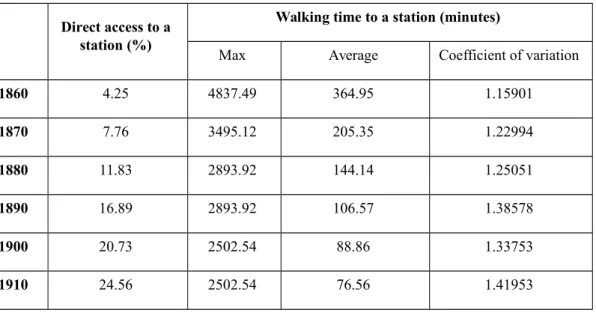
We first study the opportunities of network access (see Table 1). In 1860, less than 5 % of the 36,000 French communes were connected to the network, whereas one commune out of four were serviced by train in 1910. The coefficient of variation shows a relative homogenisation of the network since 50 years.
1 For the statistical tests results presented in this section, we removed outliers from distributions using the R
Direct access to a station (%)
Walking time to a station (minutes)
Max Average Coefficient of variation
1860 4.25 4837.49 364.95 1.15901 1870 7.76 3495.12 205.35 1.22994 1880 11.83 2893.92 144.14 1.25051 1890 16.89 2893.92 106.57 1.38578 1900 20.73 2502.54 88.86 1.33753 1910 24.56 2502.54 76.56 1.41953
Table 1 – Evolution of direct and indirect access to a station between 1860 and 1910. “Coefficient of variation” corresponds to standard deviation divided by the average.
In 1870, about 7,76 % of French communes with more than 2500 inhabitants have a station whereas people may have to walk 205.35 minutes in average to reach a station. The variation of the walking time to reach a station is increasing over time.
However, despite the decrease of the travel time to reach the nearest train station, however this evolution actually hide important disparities between the communes over the period. This can be seen using the functional accessibility measures. For that we need to compare what is gained thanks to the networks. This comparison between bimodal (walk + train) and unimodal before the innovation (walk) can be summarized by a simple linear regression for each decade and for each level of the French administration. The slope of the fit indicates how many times faster is the multimodal route when compared to the walking route on average. For instance, in the 1880s, the time needed to reach Paris was on average 5.2 times faster using the railroad network. Since we are not interested in the real travel duration but rather on their evolution, we will focus here not on the slopes value but on their evolutions over the different decades. Comparing the acceleration at three different levels of administration allows us to study how the network grew and thus identify three different growth phases. Since the increases of regression slopes is due to the improvement of the infrastructure and the arrival of the train in the countryside, we compare the slope between each decade with the evolution of the network construction between 1860 and 1930, according to a three-class hierarchy, describing fast, intermediate and slow network (Table 2 and Figure 4).
Evolution of the slope of linear regressions between walking path and bimodal path (%)
Access to Paris regional centerAccess to the departmental centerAccess to the
1860-70 46.49 57.73 11.82 1870-80 17.89 30.25 11.75 1880-90 14.71 25.73 20.92 1890-1900 12.25 14.47 13.98 1900-10 9.02 13.31 13.51 1910-20 6.71 4.38 3.34 1920-30 9.33 1.84 -1.18
Table 2 – Evolution of the slope of linear regressions between walking path and bimodal path Between 1860 and 1870, the slope of the linear regression comparing travel durations to Paris increased by more than 46%. Between 1900 and 1910, the main gain of accessibility was for the routes that reached the departmental centres, whereas the gain to reach Paris is lower than the gain to reach the regional centre. After 1910, the gain was higher in the case of the access to the French capital.
Figure 4 – Evolution of the network growth according to the hierarchy based on speed
The beginning of the 20th century is marked by important development of local networks. At the end of the
This confrontation shows three distinct phases:
The first phase corresponds to the important growth of the intermediate network between 1860 and 1880. It is the last construction decided with the Legrand plan, which drew a star network around Paris (Caron 1997). It mainly had an impact on the travel time to reach Paris and the regional centres between 1860 and 1870. The following decade shows the same hierarchy in the evolution of travel times. The gain to reach regional centres is almost twice the gain to reach Paris. It is the result of the first constructions of slow sections by private initiatives.
The second phase is a phase of intensive construction, consequence of the Freycinet Plan (Caron 1997) decided in 1878. It had an impact on the creation of fast and intermediate rails at the beginning. But it had no relevant effects on the travel times to reach Paris, as the fastest sections already existed. However, the growth of the network led to the decrease of travel times to reach departmental centres due to the multiplication of entry points for the train network. The train then reached most of the French “cantons”. The enforcement of this plan continued until 1914. So until 1910, the construction of a slow network increased the accessibility to the lowest levels of administration, whereas the gain to reach Paris stabilized (around 1.2 % each year on average).
After the stabilization of the network in the 1910s, the gain of accessibility slowed down with a 10 % loss between 1910 and 1920. The constructions started again after WWI with the primacy of faster infrastructures. Whereas the increase of accessibility to the regional and departmental centre was less than 5 %, the new sections stimulated the accessibility to reach the French capital from the West of France. This phase resulted in the connection of a part of the country to Paris but surprisingly had no impacts on the accessibility to lowest level of French administration in Vendée and Poitou-Charentes.
These results show the role of the main phases of construction of the network on the decrease of travel times. The beginning of the French Railway Network correspond to the apparition of branches around Paris. Afterwards, the effects of the network development was more local and was the consequence of a great plan to connect the entire country. At the end of the period, the improvement of the infrastructure had an uneven spatial impact on the country. The functional approach identifies correlations between the great planning decisions at national scale and the evolution of travel time at different administration scales. As we said all the stations are not equivalent, we assess here the implications of these phases of development on the growing disparities between stations, according to typology we discuss above.
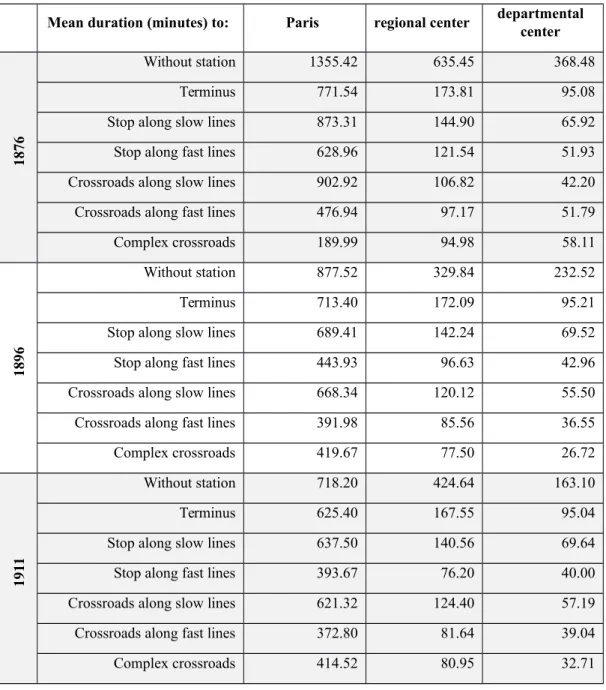
Table 3 shows the evolution of average travel time to functional centres according to network access typology. All stations received benefit from the development of the network between 1876 and 1886. The gap between a commune without a station and with a station is however evident. Over the period, the hierarchy of the network imposes more differentiation between a simple station crossed by fast lines and a station crossed by slow lines. It is also the case for crossroads with 3 or 4 lines.
Mean duration (minutes) to: Paris regional center departmentalcenter
18
76
Without station 1355.42 635.45 368.48
Terminus 771.54 173.81 95.08
Stop along slow lines 873.31 144.90 65.92
Stop along fast lines 628.96 121.54 51.93
Crossroads along slow lines 902.92 106.82 42.20
Crossroads along fast lines 476.94 97.17 51.79
Complex crossroads 189.99 94.98 58.11
18
96
Without station 877.52 329.84 232.52
Terminus 713.40 172.09 95.21
Stop along slow lines 689.41 142.24 69.52
Stop along fast lines 443.93 96.63 42.96
Crossroads along slow lines 668.34 120.12 55.50
Crossroads along fast lines 391.98 85.56 36.55
Complex crossroads 419.67 77.50 26.72
19
11
Without station 718.20 424.64 163.10
Terminus 625.40 167.55 95.04
Stop along slow lines 637.50 140.56 69.64
Stop along fast lines 393.67 76.20 40.00
Crossroads along slow lines 621.32 124.40 57.19
Crossroads along fast lines 372.80 81.64 39.04
Complex crossroads 414.52 80.95 32.71
Table 3 – Evolution of the average accessibility to functional centres according to the network access typology
The expansion of the network for the entire country explains the growing values for complex crossroads in 1896 and 1911. In fact, the development of the network has created new crossroads far from Paris: it confirms the previous results of the most significant accessibility gain for intermediate scale. We make here the hypothesis those crossroads are playing an important role in the network structure and the propagation of its performance to local scales. Now, to observe accessibility gain at a global scale, taking into account the decrease of walking time to reach a station, and taking into account the capacity of crossroads to influence
the performance of the global network, we look at the evolution of multi-polar accessibility over the period (see Figure 5). The decrease of mean travel time is slower at the end of the period, this suggests that further add-ons of rail roads were less and less effective on a global scale. The cone shape of the distribution suggests that the decreases in travel time are more important for cities with a low accessibility. This is especially the case for cities which acquired a train station during the period.
Figure 5 - Comparison of multipolar accessibility values between consecutive decades. The black line corresponds to the identity line (i.e where the accessiblity value does not change).
b. The relation between accessibility and demographics
We now examine the relation between accessibilities and demographics. The data studied here does not support the thesis of structuring effect of the train network on cities population. Rather it seems that the network development follow a spatial differentiation that was already present. This is consistent with the observations of (Pumain 1982).
(Alvarez et al. 2013) study the relation between population growth and network development by looking for each decade at the correspondence between gain/lost/no changes in coverage and population growth. They observe that population growth was stronger for English Parishes that gain coverage (better network access) and lower for those that lost coverage. However we argue this approach can hide another phenomenon. Namely that we observe a
stronger population growth because the areas that get a better access always had a better
growth than those that would never gain access.
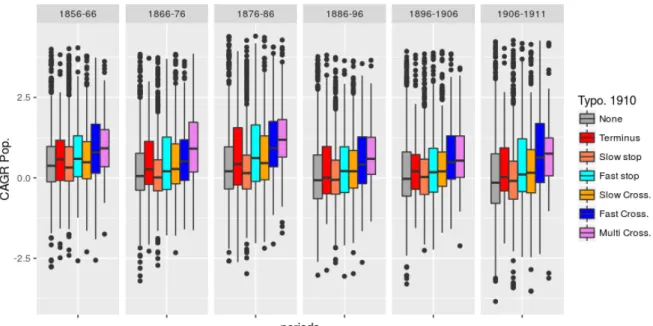
We can show this by looking at Figure 6 and 7. If we consider the situation at the end of our period (1911) we can observe that the hierarchy induced by multi-polar accessibility corresponds to important differences in population growth all along the period. It appears that the more accessible or connected a city was in 1910, the more likely it was to have a larger population growth. Similar patterns can be found looking at access time to political centres (see Appendix III). This observation is less obvious when looking that the network access typology (Figure 8) in 1910. Although commune with complex and fast crossings in 1910 seem to always have corresponded to higher growth rate during the period. This is actually confirmed by statistical tests (Welch t-test).
Figure 6 – Evolution of the population compound annual growth rate in communes according to multipolar accessibility in 1910.
Figure 7 – Evolution of the population annual growth rate for each period according to the
(Bretagnolle, 2003) network access typology in 1910.
In order to evaluate the impact of network transformation on population growth rate, we compare the difference in population growth before and after a given period of network change. This approach is similar to the one developed by (Pumain 1982).
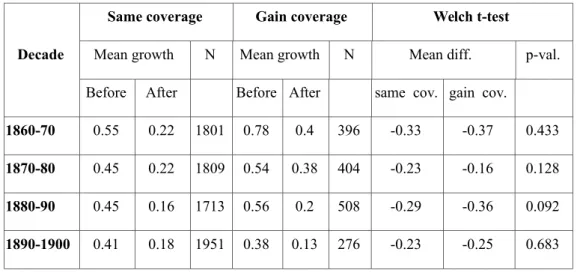
We start by looking at the changes in network topology (similar to (Alvarez et al. 2013) “changes in coverage” with a different topology). The results can be found in Table 4. It appears that the difference between communes that gained coverage and the others is not statistically significant. The same is true when looking that the relation between gain in accessibility whether functional or multi-polar (see the distributions in Figure 8). There is no significant correlations at any given period i.e. the increase in accessibility does not imply a positive change in population growth. Those conclusions were confirmed using non-parametric correlation tests (Spearman rank test).
Decade
Same coverage Gain coverage Welch t-test
Mean growth N Mean growth N Mean diff. p-val.
Before After Before After same cov. gain cov.
1860-70 0.55 0.22 1801 0.78 0.4 396 -0.33 -0.37 0.433
1870-80 0.45 0.22 1809 0.54 0.38 404 -0.23 -0.16 0.128
1880-90 0.45 0.16 1713 0.56 0.2 508 -0.29 -0.36 0.092
1890-1900 0.41 0.18 1951 0.38 0.13 276 -0.23 -0.25 0.683
Table 4 - Comparison between population CAGR of communes with more than 2500 inhabitants before and after a given decade according to the evolution of the commune typology (Bretagnolle,
2003). The observations corresponding to either extreme or missing values where removed. During the years 1870-1890, 404 communes improved their coverage (see Figure 3). Their average annual growth before that decade (i.e. from 1856 to 76) was 0.54%. After that decade (i.e. from 1876 to 1911), the average annual growth was 0.38%. It corresponds to a difference of -0.16 points. This last figure is not significantly different for the communes that kept the same coverage (p-value of the Welch t-test at 0.128).
Figure 8 - Comparison between accessibility gain (on four different decades) and the difference in the population increase between before and after each decade from each commune with more than 2500
inhabitants. The x-axis corresponds to the difference between the end and beginning of the decade multipolar accessibility A positive value in the y-axis indicates that the population growth was larger
after the decade than before.
One can speculate that the network has a different impact for cities of different characteristics. In particular, one can expect that the size of the cities is important. We perform the same tests by making a distinction between “small” and “large” cities using the population size (we use 20k inhabitants as threshold. Similar results can be obtained using 10k or a combination of both of this thresholds). The results are similar: it is very unlikely that a correlation exists between having new network access and the evolution of population growth whatever the decade and the city size. The same is true when looking at the evolution of multipolar accessibilities. The distribution of Figure 8 is dominated by small cities. When focusing on large cities (more than 20k inhabitants), the resulting distributions still does not suggest any kind of relation between the two dimensions.
Pop.
Same coverage Gain coverage Welch t-test
Decade Mean growth N Mean growth N Mean diff. p-val. Before After Before After same cov. gain cov.
> 20k 60-70 0.90 0.84 26 0.76 0.92 39 -0.06 0.16 0.36 70-80 1.00 0.84 58 0.91 0.72 20 -0.16 -0.19 0.89 80-90 1.23 0.81 60 1.05 0.59 32 -0.42 -0.45 0.86 90-1900 1.16 0.74 94 0.89 0.58 9 -0.41 -0.31 0.56 [2500,20k] 60-70 0.54 0.21 1762 0.78 0.36 370 -0.33 -0.41 0.19 70-80 0.43 -0.22 1751 0.51 0.36 384 -0.23 -0.16 0.11 80-90 0.42 0.13 1653 0.52 0.18 476 -0.29 -0.35 0.10 90-1900 0.37 0.15 1857 0.36 0.11 267 -0.22 -0.25 0.59
Table 5 - Comparison between population CAGR of communes with more than 20k inhabitants and between 2500 and 20k inhabitants before and after a given decade according to the evolution of the commune typology (Bretagnolle, 2003). The observations corresponding to either extreme or missing
values where removed.
Reading: see description of Table 4.
The results are consistent with the observations of (Pumain 1982). It appears that the development of network was based on a pre-existing city hierarchy but did not in return affect the population distribution on the territory.
5. Conclusion
In this paper, we confronted the network development and the accessibility gain to reach the centres of French administration. The French railway network became connected and its main goal was to reach Paris “by hook or by crook”. Whereas the gain to reach Paris are decreasing over time, the gains each decade to reach regional and departmental centres increased due to
the growth of intermediate and slow network. It corresponded to the diffusion of the rail innovation in France and the development of intermediate crossroads. However, at the end of our period, the slowing down of railroad construction and the new investments in a fast network translated into the increase of accessibility gain to reach Paris and the decrease of accessibility gains to the departmental centres. These conclusions correspond to the application of major planning decisions in the phase of stabilization of the 3rd French
Republic, which aimed to diffuse the rail innovation in the entire country.
By using finer multi-polar accessibility measures, we confirm the construction at the end of our period is marginal in the global accessibility. It was known that the creation of a new station had a limited impact on the demographic dynamics of newly connected cities. In the same way, the change in accessibility did not induce a significant change in population growth. A more likely hypothesis is therefore the development of network based on a pre-existing hierarchy. This confirms the previous conclusions of (Pumain 1982) who only focused on 44 departments.
In future works, we aim to adapt these conclusions to a modelling approach. The great plans of railroads development were often characterized by a centralized policy. We plan to apply simple rules in order to design a network maximising global accessibility according to population distribution. This empirical approach would be a model of network optimization that allow the comparison between a theoretic construction and the real constructions of the 19th century. The analysis of these differences would be a possible indicator of contradictions
in various local or national public transportation policies. Future studies will also have to take into account all the smaller “municipalities” (less than 2500 inhabitants) in order to analyse differentiated effects of network on urban and rural areas. In this context, the H-GIS would give information about the hierarchy of the network at this level according to the speed and the supply of services.
Acknowledgments
References
Alvarez E., Franch X., Martí-Henneberg J.. 2013, “Evolution of the Territorial Coverage of the Railway Network and Its Influence on Population Growth: The Case of England and Wales, 1871–1931.”, Historical Methods: A Journal of
Quantitative and Interdisciplinary History, 46(3): 175–191,
doi:10.1080/01615440.2013.804788.
Anselin L, 1995, “Local Indicators of Spatial Association—LISA”, Geographical Analysis, 27(2): 93–115
Aschauer, D.A., 1989. “Is public expenditure productive?”, Journal of Monetary Economic, 23, 177–200
Atack J, Bateman F, Haines M, Margo R A, 2010, “Did Railroads Induce or Follow Economic Growth? Urbanization and Population Growth in the American Midwest, 1850–1860”,
Social Science History, 34(2): 171–197
Banister D, Berechman Y, 2001, “Transport investment and the promotion of economic growth”, Journal of transport geography 9(3): 209–218
Baum-Snow, N., 2007, “Did highways cause suburbanization?”, The Quarterly Journal of
Economics, 122(2) 775–805
Bazin S, Beckerich C, Blanquart C, Delaplace M, Vandenbossche L, 2011, “Grande vitesse ferroviaire et développement économique local: une revue de la littérature”,
Recherche Transports Sécurité, 27(3): 215–238
Boarnet M G, 1995, “Highways and Economic Productivity: Interpreting Recent Evidence”,
CPL Biliography, 11(4): 476--486
Bretagnolle A, 2003, “Vitesse des transports et sélection hiérarchique entre les villes françaises”, Données urbaines, 4, 309--323
Bretagnolle A, 2014, “Les effets structurants des transports, une question d’échelles ?”
L’Espace géographique, 43(1): 51–67
Brown S., 2011, “Averaging Ratios: Characteristics of the Error of Approximation”, World
Applied Programming, 1(5): 288–293
Caron F, 1997, “Histoire des chemins de fer en France: 1740-1883”, Fayard, Paris. Chevalier M, 1832, “Système de la Méditerranée”, Aux bureaux du Globe, Paris
Chi G, Voss P R, Deller S C, 2006, “Rethinking highway effects on population change”,
Public Works Management & Policy, 11(1): 18–32
Chi G, 2012 “The impacts of transport accessibility on population change across rural, suburban and urban areas: a case study of Wisconsin at sub-county levels”, Urban
Crescenzi, R., Rodríguez-Pose, A., 2008. “Infrastructure endowment and investment as determinants of regional growth in the European Union”, Eib Papers 13, 62–101 Delaunay B, 1934, “Sur la sphere vide” Izv. Akad. Nauk SSSR, Otdelenie Matematicheskii i
Estestvennyka Nauk, 7(793-800): 1–2
Dupuy G, 1987, “Les réseaux techniques sont-ils des réseaux ?”, Espace géographique, 16(3): 175–184
Duranton G, Turner M A, 2012, “Urban Growth and Transportation”, The Review of
Economic Studies, 79(4): 1407–1440
Facchinetti-Mannone V, 1995, “L’impact régional du TGV Sud-Est”, Université de Provence - Aix-Marseille I, Aix-en-Provence
Fishlow A, 1965, “American Railroads and the Transformation of the Ante-bellum Economy”,
Harvard University Press Cambridge, MA
Flonneau M, Guigueno V, 2009, “De l’histoire des transports à l’histoire de la mobilité”
Presses universitaires de Rennes, Rennes
Franch X., Morillas-Torné M., Martí-Henneberg J.. 2013, “Railways as a Factor of Change in the Distribution of Population in Spain, 1900–1970.”, Historical Methods: A Journal
of Quantitative and Interdisciplinary History, 46(3): 144–56,
doi:10.1080/01615440.2013.803414.
Fogel R W, 1962, “A Quantitative Approach to the Study of Railroads in American Economic Growth: A Report of Some Preliminary Findings” The Journal of Economic History 22(2) 163–197
Garmy P, Kaddouri L, Rozenblat C, Schneider L, 2005, “Logiques spatiales et «systèmes de villes» en Lodévois de l’Antiquité à la période moderne”, Temps et espaces de
l’homme en société, analyses et modèles spatiaux en archéologie. XXVème rencontres internationales d’archéologie et d’histoire d’Antibes (Editions APDCA): 1–12
Garrison W L, 1960, “Connectivity of the Interstate Highway System”, Papers in Regional
Science, 6(1): 121–137
Geurs K T, Ritsema von Eck J R, 2001, “Accessibility measures: review and applications. Evaluation of accessibility impacts of land-use transportation scenarios, and related social and economic impact”, National Institute of Public Health and the
Environment, Bilthoven
Gregory I N, Ell P S, 2006, “Error‐sensitive historical GIS: Identifying areal interpolation errors in time‐series data”, International Journal of Geographical Information
Science, 20(2): 135–152
Haggett, P., Frey, A.E., Cliff, A.D., 1977. “Locational Analysis in Human Geography”, John Wiley & Sons, New York.
Hansen W G, 1959, “How accessibility shapes land use” Journal of the American Institute of
Planners, 25(2): 73–76
Harary F, 1969, “Graph Theory”, Addison-Wesley Publishing Company (Reading) Holl A, 2007, “Twenty years of accessibility improvements. The case of the Spanish
motorway building programme”, Journal of Transport Geography, 15(4): 286–297 Hornung, E., 2012. “Railroads and micro-regional growth in Prussia”, Ifo Working Paper, 127 Howkins, T. J., 1996, “Railway geography and the demarcation of Poland’s borders 1918–
1930”, Journal of Transport Geography, 4(4): 287–299
Jenks L. H., 1944, “Railroads as an Economic Force in American Development”, The Journal
of Economic History, 4(1): 1–20
Kasraian D., Maat K., Stead D., van Wee B.. 2016, “Long-Term Impacts of Transport
Infrastructure Networks on Land-Use Change: An International Review of Empirical Studies.”, Transport Reviews, 36(6): 772–792.
Keeler, T. E., Ying, J. S., 1988, “Measuring the benefits of a large public investment”, Journal
of Public Economics, 36(1): 69–85
Knowles A. K., 2005, “Emerging trends in historical GIS”, Historical Geography, 33(1): 7–13 Krugman, P., 1991, “Increasing returns and economic geography”, Journal of Political
Economy, 99, 483–499.
Kwan M.-P., Janelle D. G., Goodchild M. F., 2003, “Accessibility in space and time: A theme in spatially integrated social science”, Journal of Geographical Systems, 5(1): 1–3 Lichter D. T, Fuguitt G. V., 1980, “Demographic response to transportation innovation: The
case of the interstate highway”, Social Forces, 59(2): 492–512
Martí-Henneberg J, 2011, “Geographical information systems and the study of history”
Journal of Interdisciplinary History, 42(1): 1–13
Menerault P, 1997, “Dynamiques et politiques régionales autour du tunnel sous la Manche et du T.G.V. Nord”, Annales de Géographie, 106(593/594): 5–33
Mimeur C., 2016. “Les traces de la vitesse entre réseau et territoire, Approche géohistorique de la croissance du réseau ferroviaire français”, Thèse de Géographie, Université de Bourgogne-Franche-Comté
Moriconi-Ebrard F., Denis E., Marius-Gnanou K., 2010, “Repenser la géographie
économique. Les arrangements du rapport de la Banque Mondiale avec les sciences géographiques urbaines”, Cybergeo
Morris J.-M., Dumble P. L., Wigan M.-R., 1979, “Accessibility Indicators for Transport Planning”, Transportation Research Part A: General, 13(2): 91–109
Motte C., Séguy I., Théré C., 2003, “Communes d’hier, communes d’aujourd’hui: les communes de la France métropolitaine, 1801-2001: dictionnaire d’histoire administrative”, INED
Musso P., 1998, “Télcommunications et philosophie des réseaux. La postérité paradoxale de Saint-Simon”, PUF (Paris)
Offner J.-M., 1993, “Les «effets structurants» du transport: mythe politique, mystification scientifique”, Espace géographique 22(3): 233–242
Offner J.-M., 2014. “Les «effets structurants» du transport : vingt ans après”, Espace
géographique 43(1): 51–67
Ollivro J., 2000, “L’homme à toutes vitesses: de la lenteur homogène à la rapidité différenciée”, Presses universitaires de Rennes, Rennes.
Perroux F., 1964., “L’économie du XXe siècle” ; Presses Universitaire de France, Paris. Pumain D., 1982, “Chemin de fer et croissance urbaine en France au XIXe siècle”, Annales
de Géographie 91(507) 529–550
Pumain D., 1997, “Pour une théorie évolutive des villes”, Espace géographique 26(2) 119– 134
Quinet E., Prager J.-C., 2013, “Les effets des infrastructures sur la répartition spatiale des populations et des emplois”, Commissariat général à la stratégie et à la prospective, Paris, France
Rietveld P., 1989, “Infrastructure and regional development”, The Annals of Regional Science 23(4): 255–274
Short J., Kopp A., 2005, “Transport infrastructure: investment and planning. Policy and research aspects”, Transport Policy, 12(4): 360–367
Stanev K., 2013, “A Historical GIS Approach to Studying the Evolution of the Railway and Urban Networks: The Balkans, 1870–2001.”, Historical Methods: A Journal of
Quantitative and Interdisciplinary History, 46(3): 192–201.
doi:10.1080/01615440.2013.804789
Stathopoulos N., 1997, “Performance territoriale des réseaux de transport”, Presses de l’École
Nationale des Ponts et Chaussées, Paris
Thévenin T., Schwartz R., Sapet L., 2013, “Mapping the Distortions in Time and Space: The French Railway Network 1830–1930”, Historical Methods: A Journal of Quantitative
and Interdisciplinary History, 46(3): 134–143
Ureña J. M., Menerault P., Garmendia M., 2009, “The high-speed rail challenge for big intermediate cities: A national, regional and local perspective”, Cities, 26(5): 266–279 Vandenbulcke G., Steenberghen T., Thomas I., 2009, “Mapping accessibility in Belgium: a
tool for land-use and transport planning?”, Journal of Transport Geography, 17(1): 39–53
Vickerman R. W., 1995, “The regional impacts of Trans-European networks”, The Annals of
Regional Science, 29(2): 237–254
Wilson J. P., Fotheringham A. S., 2008, “The handbook of geographic information science”,
Appendix I
Our goal is to assess the capacity of the triangulated graph to reproduce realistic walking time durations without using known any road database. We apply the same speed of 5 km/h to each section and use a DEM to compute the duration taking the slope of the section into account. Then we compare the time durations using a complete database and the Delaunay triangulation in two different areas. The first is the French department of Côte d’Or (8,700 km²) which has moderate relief like a fragmented plateau. The second area is the French region “Pays de la Loire” (32,000 km²) which is a great plain. Table 1 shows the difference of travel durations between the two methods.
Area (km²) Coef. of variation Coef. of correlation (Spearman) Distance to the centre
Nantes Road Database 32,000 .48 .99
Triangulation .49
Dijon Road Database 8,700 .50 .98
Triangulation .49 Distance between each pair of cities Pays de la Loire Road Database 32,000 .18 .99 Triangulation .18
Côte d’Or Road Database 8,700 .15 .95
Triangulation .13
Table AI-1 – Comparison of travel durations based on a road database and the Delaunay triangulation
In the top part of the table, we compare the travel durations to reach the most important city of each area. In both cases, the durations based on the road database and the Delaunay triangulation are highly correlated: the Spearman correlation coefficient is superior to 0.98. And the two methods show a similar variation. The bottom of the table shows the estimation of travel durations between each pair of cities in each area. The Spearman correlation coefficient is also superior to 0.95 and the two methods have a similar variation.
In both cases, the distribution has the same form. Extreme values are also reproduced by the triangulation. It is known that the difference between shortest-path distances between two points on Delaunay triangulation are at least as long and no longer than 2.4 times their Euclidian distance. Here we can see that, using this method, the duration rankings is very similar to the one found in a precise database (at least in the case of France). The Spearman correlation coefficient between the two methods are 0.95 in Côte d’Or, 0.98 in the plain of Pays de la Loire (Table 1). Notice that the exact values are often superior to durations using the triangulation but the coefficient of variation between the two methods stay stable.
Appendix II
We discuss here four possible definitions of multi-polar accessibility and discuss the empirical difference between them. In the following, we note dG(u , v ) the distance between nodes u
and v in graph G and wu the population of city u. Here, the graph G is the union of the
triangulation (walking network) and the railroads (train networks). The distances computed can therefore correspond to a bimodal path.
DG(u)=
∑
dG(u , v )DGw(u)=
∑
wvdG(u , v)The first formulations DG and DGw correspond when averaged (ie. divided by the number
of cities or the total population respectively) to the expected time to go from u to another city. We now define the normalized version of multi-polar accessibilities.
DGn(u)=
∑
dG(u , v ) dT(u , v )DGwn(u)=
∑
wvdG(u , v ) dT(u , v )Here, dT(u , v ) corresponds to the distance using only the walking network T (the
triangulation without the railroads sections). Notice we have dT(u , v )⩽dG(u , v ) since T is a
subgraph of G. The normalized versions DGn and DGwn can be interpreted as the
contribution of the train network to the accessibility of cities. While weighted definitions seem natural (weighted means instead of simple means), the normalized definition requires more discussion. It is easy to see that in any grid-like network with borders (as the triangulation network) we will have a non-uniform distribution of DG or DGw values.
The reason is that the nodes in the centre are on average closer to anybody than the nodes on the borders. Consider the case where we add to a grid-like network T a train network that is topologically equivalent to the former but with faster edges (the resulting network is G). Then
DT and DG will have equivalent values (up to the ratio train speed over walking speed).
Therefore statements such as « due to the train network, u is more accessible than v since
DG(u)<DG(v ) » would be misleading since this difference only comes down to the
positions of vertices u and v in the plan. On the other hand, in this example, DGn will have
the same value for all nodes.
A direct effect of the division by the distance on the walking network is that cities that are farther away from city u will have a smaller impact on the accessibility of u. This is especially usefull for DGwn where the size of cities is taken into account. Another measure can be used
to counter this effect: it is the ratio DG(u)/ DT(u) between the simple accessibilities with
and without the train. The difference between this measure and DGn comes down to the
Figure AII-1 - Comparisons between the different definitions of accessibilities using the 1900 train network. Blue (resp. Red) points indicate cities with (resp. without) a train station.
We first look at the relation between the various definitions mentionned above. We can observe a strong correlation between average travel time DG and weighted average travel
time DGw . This is not surprising since with high population densities also corresponds to
areas with a high density of cities. The relation between DG and normalized average travel time DGn is however more complex. A remarkable thing occurs when using weighted
normalized average travel time DGwn . There is a strong correlation with DGn but we can
notice a distinct subpopulation in the distribution i.e. a group of cities with low DGn values
and more variable DGwn values. It mostly corresponds to cities closes to Paris that do not
have train stations. We have a similar effects for cities closes to Paris with train stations, but it is not as important. Note that the ratio of average DG(u)/ DT(u) does not present the same
Appendix III
Figure AII-1 – Evolution of the compound annual growth rate of population size in communes according to time accessibilities to Departement/Region/National centres (respectively) in 1910.