HAL Id: hal-02416245
https://hal.archives-ouvertes.fr/hal-02416245
Submitted on 23 Mar 2020
HAL is a multi-disciplinary open access archive for the deposit and dissemination of sci-entific research documents, whether they are pub-lished or not. The documents may come from teaching and research institutions in France or abroad, or from public or private research centers.
L’archive ouverte pluridisciplinaire HAL, est destinée au dépôt et à la diffusion de documents scientifiques de niveau recherche, publiés ou non, émanant des établissements d’enseignement et de recherche français ou étrangers, des laboratoires publics ou privés.
tanks
P. Mongabure, S. Vasic
To cite this version:
P. Mongabure, S. Vasic. Shaking table testing of cylindrical steel liquid storage tanks. COMPDYN 2017 - 6th ECCOMAS Thematic Conference on Computational Methods in Structural Dynamics and Earthquake Engineering, Jun 2017, Rhodes, Greece. �hal-02416245�
M. Papadrakakis, M. Fragiadakis (eds.) Rhodes Island, Greece, 15–17 June 2017
SHAKING TABLE TESTING OF CYLINDRICAL STEEL LIQUID
STORAGE TANKS
Ph. Mongabure1, S. Vasic2
1
Den-Service d’études mécaniques et thermiques SEMT CEA Université Paris-Saclay F-91191 Gif-sur-Yvette France e-mail: [email protected] 2
Den-Service d’études mécaniques et thermiques SEMT CEA
Université Paris-Saclay F-91191 Gif-sur-Yvette
France
e-mail: [email protected]
Keywords: seismic testing, shaking table, tanks
Abstract. This paper presents the experimental campaign carried out on cylindrical liquid storage steel tank specimens in CEA TAMARIS facility.
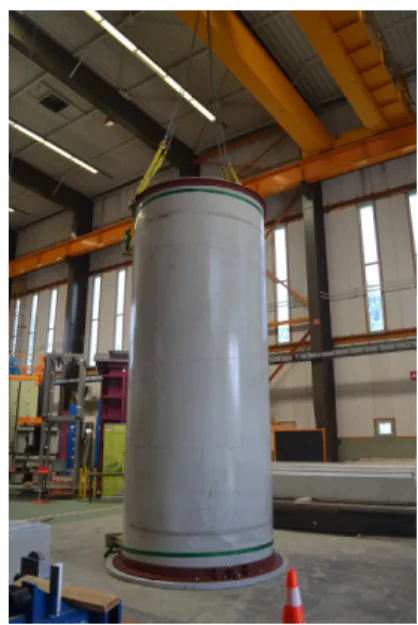
Two geometries of tanks have been tested on a shaking table under seismic conditions. The broad tank specimen (diameter 3 m, height 0.9 m) was dedicated to the study of sloshing and potential uplifting during the seism. This specimen was unanchored on the table and free to lift or slide. The influence of a floating roof on sloshing has been studied. The slender speci-men (diameter 2 m, height 5 m) was dedicated to the foot buckling of the cylindrical shell. The slender specimen was anchored to the table. All the specimens were water filled.
All these specimens were strongly instrumented with inner pressure sensors and wave gauges and outer accelerometers and displacement sensors. In addition a new 3D scanner has been used to detect any residual deformation of the tanks by after / before tests comparisons. The purpose was to give to the calculating teams all the needed measurements and informa-tion to check their models.
1 INTRODUCTION
In the framework of INDUSE2-SAFETY European project, CEA EMSI laboratory, hosting the seismic testing facility TAMARIS, has carried out experimental tests on tanks under seis-mic loadings. This experimental campaign formed the task 4.7 of the INDUSE-2-SAFETY project (called INDUSE2 in the following parts of this document).
The goals of this project are to study the petrochemical plants components fragility to im-prove the seismic safety assessment in EUROCODE 8. This project has received the grant agreement RFSR-CT-2014-00025 [1].
This article presents experimental results obtained on two tanks: a broad one (diameter 3 m, height 0.9 m) and a slender one (diameter 2 m, height 5 m).
2 TAMARIS EXPERIMENTAL FACILITY
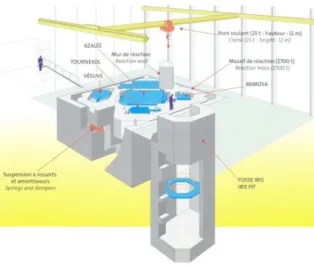
The Seismic Mechanical Study Laboratory (EMSI), part of the Mechanical and Thermal Study Section in CEA-Saclay has been operating the TAMARIS experimental facility since 1991. This facility is composed of four shaking tables, a test pit and a reaction wall (Figure 1). These testing means are positioned in a huge reaction massif made of reinforced concrete. The tests carried out are intended to better understand the mechanical behavior of structures, equipment or devices under dynamic and seismic loadings.
Mostly, the tests are performed on the tri-axial table AZALEE, which is capable of shaking specimens up to 100 tons and 1 g acceleration. It is a 6 x 6 m2 metallic struc-ture which is motioned in the three directions by eight actuators. The six Degrees Of Free-dom (6 DOF, three translations and three ro-tations) can be monitored by a MTS control system.
Another interesting device is the VESUVE table. It is a simpler but efficient shaking table. It is moved by a unique hori-zontal actuator (1 DOF). The VESUVE table is monitored by a SERVOTEST control
sys-tem. Figure 1: TAMARIS facility
The INDUSE2 tests on tanks have been conducted on the VESUVE table which has the following characteristics (Table 1).
Table DOF Control Dimensions (m x m) Payload (tons) Displacement (mm) Seismic control frequency (for empty table) (Hz) VESUVE 1 displacement 3.1 x 3.8 20 ±100 0 - 40
3 THE SPECIMENS 3.1 Initial configurations
Two configurations of steel tanks (Figure 2) are described in the INDUSE2 technical pro-posal [2]:
• a broad tank (unanchored, with or without floating roof),
• a slender tank (anchored).
Figure 2: Configurations of steel tanks [2]
3.2 Detailed design for the broad tank
The broad tank is scaled from a real tank (diameter 54 m, height 15 m). The scale ratio λ is 1/18. The specimen has a 3 m diameter and a 0.868 m height. It is formed by one cylindrical SS304 steel sheet 1 mm thick welded to a round bottom of the same material. A circular stiffener is welded to the top of the cylindrical shell. It has been fabricated by the Walter Tosto Company (Figure 3).
The broad tank was unanchored during the tests on the shaking table. It has been tested with a monoaxial seismic loading to study :
• the influence of a floating roof on sloshing created at low frequencies,
• the uplifting phenomenon induced by higher frequencies. The estimated mass of the empty tank is
123 kg. Once filled with water at 90% of its height (0.781 m), the specimen mass was 5.6 tons.
A roof has been built in CEA from wood and rigid foam to ensure the buoyancy (Figure 3). 43 springs were fit around the roof in order to simulate the rigidity of the centering system of the roof in the real tank.
3.3 Detailed design for the slender tank
The slender tank is scaled from real tanks (diameter 8 m, height 20 m). Its scale ratio λ is 1/4. The specimen has a 2 m diameter and a 5 m height. It is formed by four cylindrical S355JR steel sheet 1.5 mm thick assembled by longitudinal and circumferential weldments to create a cylindrical shell. This one is welded to a massive basis. A circular stiffener is welded to the top of the cylindrical shell. The slender tank has been fabricated by the Walter Tosto Company (Figure 4).
Four glued outer flanges reinforced the tank’s shell lower part without introducing any residual stress due to weldment. The slender tank has been tested with a monoaxial seismic signal to study the buckling of the cylindrical shell.
The basis has been designed to permit the bolting of the tank to an intermediate steel plate (2.3 x 2.3 m2, 2100 kg). This plate was itself bolted to the shaking table’s plate.
The mass of the empty tank was 2300 kg. Once filled with water at 90% of its height (4.5 m), the specimen mass was 16.4 tons. The total mass on the table was 18.5 tons.
Figure 4: Slender tank
3.4 Steels characterization
The two steels used for the tanks manufacture have been characterized according to the standard NF EN ISO 6892-1 A233. The laminating direction and the transverse direction have been discriminated. The results are shown in the following table (Table 2), where SST stands for Stainless Steel (SS304) Transverse, SSL for Stainless Steel Longitudinal, ST for Steel (S355JR) Transverse and SL for Steel Longitudinal.
Tank Steel Thickness Rp0.2 (N/mm2) Rm (N/mm2) A (%) Broad SST 1.0 368 722 51.8 Broad SSL 1.0 373 728 49.4 Slender ST 1.5 420 452 26.7 Slender SL 1.5 400 447 26.1
Table 2: Tanks steels mechanical characterization
3.5 Specimens testing position and orientation
The broad tank was positioned in the center of the table plate on an intermediate EPDM sheet (Figure 5). This rubber membrane increased the friction coefficient between tank base and the table to decrease sliding effect and protected the mechanical bearings and electrical circuits in case of water over topping.
Figure 5: Broad tank on VESUVE table
The same implementation was reproduced for the slender tank, apart the anchoring of the tank in the VESUVE table, as previously described.
In both cases, the orientation reference was:
• X axis is the direction of the displacement, positive when the rod goes out,
• Y axis is transverse,
• Z axis is the vertical one positive towards the top.
The tanks were positioned taking into account the longitudinal welds of the cylindrical shell. These weldments were placed at 45° in respect of the X axis. Each tank had its own ori-entation and generatrixes were marked every 45° in trigonometric oriori-entation. The 0°-180° axis was the seism axis, that is the X axis.
4 THE SEISMIC SIGNALS
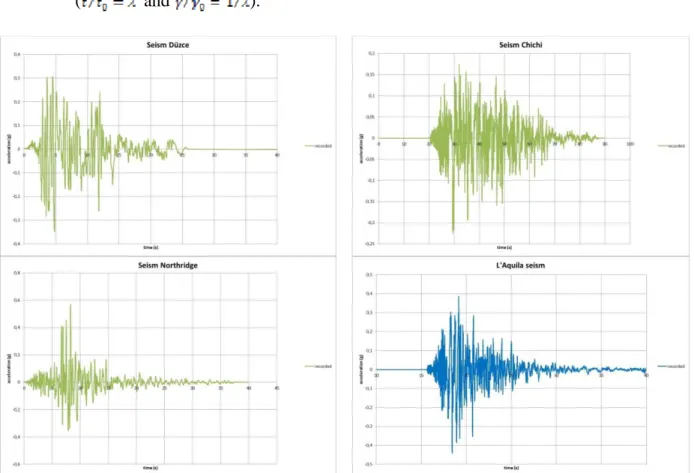
The seismic signals used for the tests were natural acceleration signals chosen to maximize the mechanical effects on the tanks (Table 3, Figure 6):
• for the sloshing behaviour of broad tank,
• for the uplifting behaviour of broad tank,
• for the buckling behaviour of slender tanks.
The VESUVE table is controlled with displacement feedback. So, the seismic accelero-grams have first been changed into displacement signals, and then a similitude has been ap-plied for each type of test taking into account the scale of the specimen.
Tank Effect Event Country Date Component Broad Sloshing Chichi Taiwan 21/09/1999
Broad Sloshing Düzce Turkey 12/11/1999
Broad Uplifting Northridge-01 USA 17/01/1994 NORTHRx Slender Buckling L'Aquila ITALY 06/04/2009 IT0789xa
Table 3: Signals used for the tanks
The most suitable similitude has been defined for each type of test (considering λ < 1):
X (seism direction) Y
• considering the sloshing behaviour on broad tank at low frequency, the Froude sim-ilarity was applied ( and ),
• considering the uplifting of a broad tank, an acceleration scaling was used ( and ).
• considering the buckling of slender tanks, the velocity similarity was applied
( and ).
Figure 6: Natural seismic signals selected for the tests (accelerations in green for broad tanks, in blue for slender tank)
5 THE INSTRUMENTATION
The instrumentation placed on the tanks and on the table measured the mechanical inputs (accelerations, pressures) and the mechanical outputs (strain, displacements, water level) of the experimental system table + tank. The implementation of the instrumentation is shown in Figure 7 for the broad tank and in Figure 8 for the slender one. 120 sensors ca have been posi-tioned on each tank.
5.1 Table instrumentation
A displacement sensor and a triaxial accelerometer measured the behavior of the table, i.e. the dynamic input at the foot of the tank.
5.2 Specimen instrumentation
Triaxial accelerometers were scattered on the outer surface of the tank in order to measure the accelerations distribution in regard to the height of the tank and the angle around the tank axis.
Pressure sensors measured the water pressure on the inner surface of the tank. They were scattered vertically and circumferentially in order to measure pressure variation versus time, that is the inner forces variation.
Level sensors measured the water level variations at the free surface of the tank. They were positioned around the top circumference of the tanks.
Local displacements, such as the uplifting of the tank base, were measured by vertical LVDT sensors fixed on the tank base and pointing on the table plate. Global displacements of the broad tank have been measured by cable displacement sensors placed between fixed point outside the table and the tank itself. For the slender tank due to its height, no traditional dis-placement sensors could be used. So an optical technique has been used. This one is presented in § 5.3.
Some strain gauges glued on the tanks measured relevant strains indicating that the desired phenomenon was triggered. They were positioned vertically on the outer surface of the slen-der tank’s foot to detect the buckling of the tank foot. And they were positioned on the inner side of the broad tank’s bottom plate to detect flexion triggered by the uplift.
Figure 8: Instrumentation of slender tank
5.3 3D stereovision target tracking
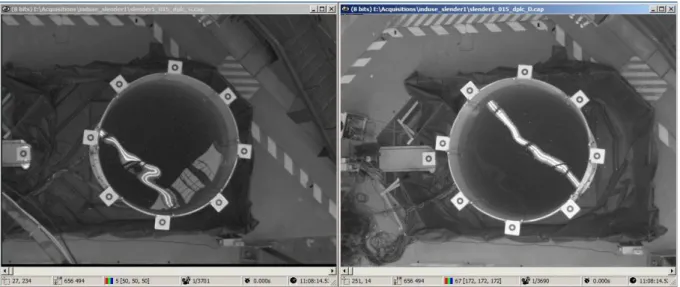
To measure the displacement of the top of the slender tank, no conventional sensors could be used due to the height of the tank (5 m). A stereoscopic video technique, so called target tracking (Figure 9), has been implemented. This technique has been used for several years in EMSI laboratory. This system based on a stereoscopic rig and dedicated softwares for acquisi-tion and post processing has been supplied by the VIDEOMETRIC Company (based in Cler-mont Ferrand, France).
The stereovision sensor is constituted of two CCD cameras encapsulated in a rigid carbon arm that produces twin stereoscopic images of the same object on which are posi-tioned dedicated targets. It is linked to a com-puter with an acquisition software. The images stored (Figure 10) during a test at a 100 Hz frequency are post processed (i.e. tar-gets are spotted, located and sorted in each image) to evaluate the targets displacements in all space directions versus time.
Figure 9: 3D target tracking principle
Figure 10: Stereoscopic view of SLENDER1 (top –down direction)
5.4 3D shape measurement
An optical technique for shape measurement has been used to compare the shape of the tanks before and after tests (Figure 11).
It is a structured light optical technique based on fringes pattern projection dedicated to tri-dimensional shape measurement. The fringes are projected by a conventional image projector. The illuminated surface is observed by a stereoscopic rig equipped with two high resolution cameras. This system has also been supplied by the VIDEOMETRIC Company.
The complete outer surface of a slender tank (ca 31 m2) is the result of the assembly of ca 50 individual scans (ca 2 m2 each). A sufficient overlap is necessary to be able to link all these individual scans. This operation is automatically performed by post processing using spherical markers scattered on the outer surface of a tank.
It was then possible to calculate the difference between pre and post-tests shapes, i.e. to calculate the residual deformations of the tanks.
Figure 11: 3D shape measurement of a broad tank
6 TESTS ON BROAD TANK
Three seismic signals (Table 3) have been used on BROAD1 tank:
• For sloshing, Düzce, Turkey and Chi Chi, Taiwan,
• For uplifting, Northridge (USA). 6.1 Sloshing testing
The limit for the tests was the over topping of the water, that is a wave height of 87 mm. This has been reached for Düzce signal at a table displacement of ±30 mm. In Figure 12, sev-eral graphs show the consistency of measurement through different aspects:
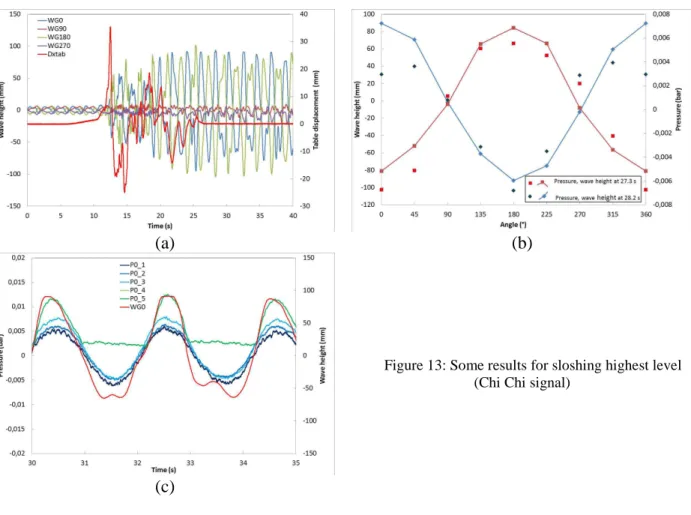
(a) The measurements versus time of the waves every 90°, WG0 and WG180 being along the seism axis, show the phase opposite movement of the waves along the X axis. On the contrary, the perpendicular gauges WG90 and WG270 measured almost zero waves. (b) Considering the wave height and bottom pressure repartition along the circumference,
both measurements are coherent at two different times (high wave at 0°, low wave at 0°).
(c) The pressures along the 0° generatrix (P0_1 lowest sensor, P0_5 highest sensor) are coherent with the wave height measurements at 0°.
Figure 12: Some results for sloshing highest level (Düzce signal)
(c)
The over topping has been reached for Chi Chi signal at a table displacement of ±35 mm. In Figure 13, the same types of graphs as previously shown for the Düzce signal give the same quality of measurements.
(a) (b)
Figure 13: Some results for sloshing highest level (Chi Chi signal)
6.2 Influence of the roof for sloshing testing The influence of the roof has been checked for the two signals. As expected, the roof creates a strong damping of the waves. In Figure 14, this damping is clearly shown by comparison with the measure-ments in Figure 12 (a), the input signal be-ing the same (Düzce, ±30 mm).
This result has been checked for the Chi Chi signal as well.
Figure 14: Wave height with the roof (Düzce signal)
6.3 Uplifting testing
The Northridge signal was used to trigger significant uplift on the broad tank. Some results are shown in Figure 15:
(a) An uplift of ca 40 mm was achieved at 180° for a -20 / +15 mm signal.
(b) This uplift was linked to a significant slide of the tank on the table (ca 70 mm). It was no use to increase the level of the signal for the slide effect was predominant on the up-lift effect. 40 mm was the highest upup-lift achievable with this implementation.
(c) The strains measured by the gauges are consistent with the uplift. The highest strain was obtained close to the tank’s wall, i. e. on J1 and J10. For example, J10 experienced a compression of 1100 µ strain.
(d) Finally, pressure measurements and uplift are also consistent. The pressure distribution along the circumference for the bottom sensors shows that a high pressure corresponds to low uplift whereas low pressure means high uplift.
(c) (d)
Figure 15: Some results for uplifting highest level (Northridge signal) 7 TESTS ON SLENDER TANK
One seismic signal has been used on SLENDER1 tank, the L’Aquila signal (Table 3). A ±15 mm signal level has been used at maxi-mum which corresponds to a ±1 g on the table at the tank’s foot. The buckling has not been achieved (Figure 16).
Figure 16: Slender tank ready to be tested
Several global facts can be shown from the time measurements:
(a) The highest drift (difference between top and foot) measured is ca 16 mm. A residual drift of ca 5 mm shows possible permanent deformation of the tank.
(b) An important amplification of the acceleration at the top gives measurement higher than 10 g for a table acceleration of 1 g.
(c) The comparison of the drift and strain gauge measurement shows a fine coherence of the local bending mechanism at 0°, a positive drift triggering a gauge tension.
(d) In the reverse, at 180° the positive drift triggers a gauge compression. The highest strain measured was a 1500 µstrain compression on J8 gauge.
(a) (b)
(c) (d)
Table 4: Some results for SLENDER1 highest level (L’Aquila signal)
Drifts and local strain give some indications about the tank behavior (Figure 17):
(a) The drifts at 0° and 180° are first in the same direction and then in opposition. This means that the global behavior of the tank shifts from bending mode to shell defor-mation mode after the strong part of the signal.
(b) Strong local deformation occurs on the 180° generatrix. The local bending shifted to local shell deformation which could be a buckling initiation.
(a) (b)
Figure 17: Behavior of slender tank
• The displacements of the top of the tank are mainly radial displacement as shown by the in plane displacements (Figure 18) of the seven targets positioned every 45° at tank’s top (the eighth one at 225° has fallen down).
• The residual deformations of SLENDER1 have been computed (Figure 19) as the geometrical distance between the posttest shape and the pretest shape, measured with the 3D scanner (see §5.4). This shows a four petals shape with ±8 mm ampli-tude, that is 0.8% residual radial strain.
Figure 18: Displacements of targets around the top of the tank
Figure 19: Difference of pretest / posttest shapes for SLENDER1
These measured deformations, at the foot (Figure 17) or at the top (Figure 18, Figure 19), are consistent with what can be observed on the videos shot during the tests.
8 CONCLUSIONS AND FUTURE WORK
The first analysis presented in this paper need to be strongly completed by some modal analysis, pre / posttest shape differentiation… All the intended goals have not been achieved in the study of the seismic behavior of tanks but the highly instrumented tanks gave a lot of measurements to be compared and analyzed.
A second slender tank will be tested in a close future. The goal is once more to trigger a significant buckling of its foot. The experience acquired in the first test will be used to achieve this goal.
ACKNOWLEDGEMENTS
This work has been funded by the European Research Project INDUSE-2-SAFETY (Grant No. RFS-PR13056).
REFERENCES
[1] ‘INDUSE-2-SAFETY’ Grant Agreement, Component fragility evaluation and seismic
safety assessment of ‘special risk’ petrochemical plants under design basis and beyond design basis accidents, RFSR-CT-2014-00025, EC 12/6/2014.
![Figure 2: Configurations of steel tanks [2]](https://thumb-eu.123doks.com/thumbv2/123doknet/12693912.355105/4.892.131.786.284.529/figure-configurations-of-steel-tanks.webp)