HAL Id: inria-00071768
https://hal.inria.fr/inria-00071768
Submitted on 23 May 2006HAL is a multi-disciplinary open access archive for the deposit and dissemination of sci-entific research documents, whether they are pub-lished or not. The documents may come from teaching and research institutions in France or abroad, or from public or private research centers.
L’archive ouverte pluridisciplinaire HAL, est destinée au dépôt et à la diffusion de documents scientifiques de niveau recherche, publiés ou non, émanant des établissements d’enseignement et de recherche français ou étrangers, des laboratoires publics ou privés.
The InfoVis Toolkit
Jean-Daniel Fekete
To cite this version:
ISSN 0249-6399
a p p o r t
d e r e c h e r c h e
TH `EME 3INSTITUT NATIONAL DE RECHERCHE EN INFORMATIQUE ET EN AUTOMATIQUE
The InfoVis Toolkit
Jean-Daniel Fekete
N
◦4818
Unit´e de recherche INRIA Futurs
Domaine de Voluceau, Rocquencourt, BP 105, 78153 Le Chesnay Cedex (France)
The InfoVis Toolkit
Jean-Daniel Fekete
Th`eme 3 — Interaction homme-machine, images, donn´ees, connaissances
Projet IN-SITU
Rapport de recherche n◦ 4818 — Mai 2003 — 11 pages
Abstract: This report presents the InfoVis Toolkit, designed to support the creation, extension and integration of advanced 2D Information Visualization components into in-teractive Java Swing applications. The InfoVis Toolkit provides specific data structures to achieve a fast action/feedback loop required by dynamic queries. It comes with a large set of components such as range sliders and tailored control panels required to control and configure the visualizations. These components are integrated into a coherent framework that simplifies the management of rich data structures and the design and extension of visualizations. Supported data structures currently include tables, trees and graphs. Sup-ported visualizations include scatter plots, time series, Treemaps, node-link diagrams for trees and graphs and adjacency matrix for graphs. All visualizations can use fisheye lenses and dynamic labeling. The InfoVis Toolkit supports hardware acceleration when available through Agile2D, an implementation of the Java Graphics API based on OpenGL, achieving speedups of 10 to 60 times.
The report also shows how new visualizations can be added and extended to become components, enriching visualizations as well as general applications.
Key-words: Information Visualization, Human-Computer Interaction, Toolkit, tables, trees, graphs
La boˆ
ıte `
a outils InfoVis
R´esum´e : Ce rapport d´ecrit la boˆıte `a outils InfoVis, con¸cue pour faciliter la cr´eation, l’extension et l’int´egration de composants de visualization d’information 2D avanc´es dans des programmes interactifs Java Swing. La boˆıte `a outils InfoVis offre des structures de donn´ees optimis´ees pour que la boucle action/perception des requˆetes dynamiques soit aussi rapide que possible. Elle fournit un ensemble riche de composants tels des barres de r´eglage d’intervalles ainsi que des boˆıtes de r´eglages permettant de controler et configurer les visua-lisations.
Ces composants sont int´egr´es dans un cadre coh´erent qui simplifie la gestion de structures de donn´ees riches et la conception et r´ealisation de visualisations. Les structures de donn´ees actuellement g´er´ees sont les tables, les arbres et les graphes. Les visualisations disponibles sont les diagrammes de points, les s´eries temporelles, les treemaps, les diagrammes nœud-liens pour les arbres et les graphes et les matrices d’adjacence pour les graphes. Toutes les visualisations peuvent utiliser des lentiles d´eformantes (Fisheyes) et des labels dynamiques. La boˆıte `a outil InfoVis permet d’utiliser des acc´el´erations graphiques mat´erielles grˆace `a Agile2D, une impl´ementation de la biblioth`eque graphique de Java reposant sur OpenGL. Cette impl´ementation permet des acc´el´erations de 10 `a 60 fois.
Ce rapport montre aussi comment cr´eer de nouvelles visualisations et les transformer en composants interactifs, enrichissant les visualisations et les applications en g´en´eral.
Mots-cl´es : Visualization d’information, Interaction Homme-Machine, Boˆıte `a outils, tables, arbres, graphes
The InfoVis Toolkit 1
The InfoVis Toolkit
Jean-Daniel Fekete
INRIA Futurs/LRI
Bat. 490
Université Paris-Sud
F91405 Orsay Cedex, France
Tel: 1-33-1-69-15-66-23
E-mail: [email protected]
INTRODUCTION
In recent years, Information Visualization has become popular outside its research community, both in industry and research. It is recognized as an important medium for communication, exploration and analysis in Data Mining, biology, sociology or cartography, to name a few.
Despite its well understood potential, information visualization applications are difficult to implement. They require a set of components – such as range sliders or fisheye lenses – and mechanisms – such as dynamic queries – that are not available or not well supported by traditional GUI toolkits. The literature on Information Visualization is large and resources describing the concrete implementation of key components are sometimes hard to find.
This article describes the InfoVis Toolkit: a coherent software architecture and a set of Java-based components designed to support the creation of information visualization applications and components for a large set of data structures. Its key features are:
• Generic data structures suited to visualization • Specific algorithms to visualize these data structures • Mechanisms and components to perform direct
manipulation on the visualizations
• Mechanisms and components to select, filter and perform well-known generic information visualization tasks
• Components to perform labeling and spatial deformation.
The InfoVis Toolkit has also been designed to experiment with new uses of visual attributes such as transparency or color gradients [ 12]. To do so efficiently, it can be used
with Agile2D1, an implementation of the Java graphics API based on the OpenGL API [ 23]. Using Agile2D, some graphic primitives draw 200 times faster than with the Java native implementation. We describe the tradeoffs of using Agile2D and raise some issues on the evolution of Java environments to better support visualization and hardware acceleration.
The InfoVis Toolkit is distributed as free software under a liberal license (QPL) in the hope that the Information Visualization community will adopt it as a workbench for implementing new ideas within an already rich toolkit. This article describes the general framework of the toolkit and some of its specific parts. It then discusses performance issues, in terms of memory footprint, layout and rendering time. The last section demonstrates how a new visualization is created, transformed into a component and integrated inside another visualization. The conclusion outlines areas of future work.
RELATED WORK
Implementing information visualization might look simple using a GUI toolkit: create a data structure for holding the data and use a component to render it on screen; then, add selection and dynamic queries. Toolkits such as Java Swing already have data structures for tables and trees as well as components to display and interact with them. However, these toolkits offer no support for dynamic queries, mapping of data attributes to visual attributes, dynamic labeling, spatial deformation, loading and saving from various formats, etc. Creating all these components from scratch is very long, tedious and
1
Agile2D has been developed for the HCIL of the University of Maryland by Jonathan Mayer and improved by the author. Figure 1: Examples of Scatter Plot, Treemap and Graph Visualizations Built with the InfoVis Toolkit
2 Fekete frequently difficult.
Chi describes a software framework for information visualization [ 11] but it does not come with a toolkit. Most InfoVis projects and products are created from scratch and several research centers have developed different applications for specific data structures and visualizations, all supporting a different subset of the useful components. Supporting all the components is long, difficult, and requires a global consistency hard to achieve when crafting a proof of concept.
Solutions exist to avoid starting from scratch. Among the toolkits related to Information Visualization, the most popular are PAD++ and Jazz [ 6, 7]. PAD++ and more recently Jazz are scene graph management toolkits designed to build zoomable user interfaces (ZUIs). They have been successfully used for creating InfoVis applications such as PhotoMesa [ 5] and SpaceTree [ 15]. These applications demonstrate new presentations and navigations, however, they do not offer the filtering and visual attribute management required to fully support information visualization techniques such as dynamic queries, dynamic labeling or spatial deformations. Commercial information visualization applications, such as SpotFire [ 3] usually come with a development toolkit to customize them. However, the level of customization they provide is limited. For example, it does not allow replacing all the range sliders by another kind of component or adding Excentric Labeling [ 13]. Doing so is very important when designing novel information visualization components and requires deep access into the toolkit/application.
Scientific visualization toolkits, such as the Visualization Toolkit [ 20] or IBM OpenDX [ 22], have a similar goal as the InfoVis Toolkit but for a different domain. They do not provide any support for 2D visualizations, dynamic queries, generic data structures, labeling, space deformation etc.
We have been involved in the design of several information visualization applications and components in the recent years, and we will use three of them in the rest of this article to show the differences between the design of a special purpose application and the use of a supporting toolkit. These applications are Treemap4 [ 16], SpaceTree [ 15] and MillionVis [ 12].
Treemap4 is a complete application for visualizing hierarchical data structures using Treemaps. It has several modules to adapt treemap visualization to different exploration tasks, and is also a testbed for student projects. It is a perfect example of an application that has grown over the years, mainly with students’ code.
SpaceTree is an application for visualizing hierarchical data structures with traditional node-link diagrams. To best fit the available screen space, it adds the dynamic rescaling of branches of the tree based on Furnas’s “degree of interest” calculation [ 14]. SpaceTree is mainly implemented by one knowledgeable programmer using the Piccolo toolkit – a downsized version of Jazz. MillionVis is an application and a library for information visualization that relies on hardware acceleration and custom interaction components. It is written in C++ and uses the OpenGL API. The InfoVis Toolkit is a
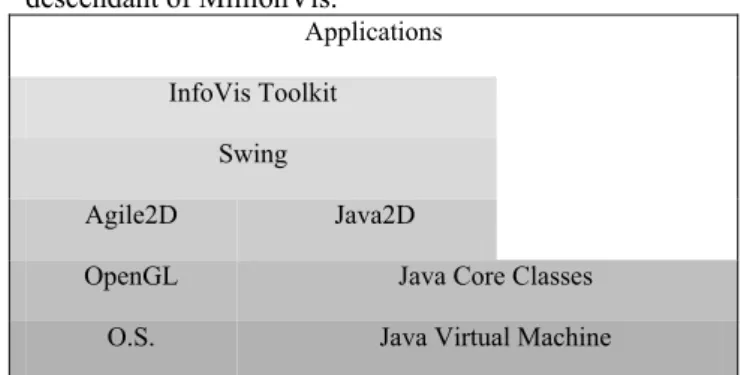
descendant of MillionVis. Applications InfoVis Toolkit
Swing
Agile2D Java2D
OpenGL Java Core Classes O.S. Java Virtual Machine Figure 2: The architecture of applications using the InfoVis Toolkit.
THE INFOVIS TOOLKIT
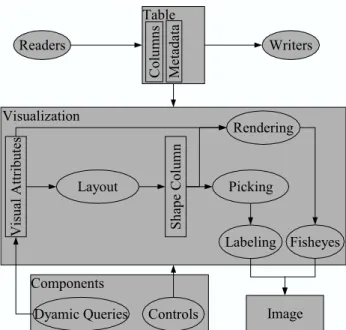
The InfoVis Toolkit is a Java library and software architecture (Figure 2) organized around five main parts: tables, columns, visualizations, components and input/ output. Figure 3 details the parts described below. The InfoVis toolkit provides a unified underlying data structure based on tables. Representing data structures with tables improves the memory footprint and performance, compared with ad-hoc data structures used by other specialized InfoVis applications. Any data structure can easily be implemented on top of tables. Layout algorithms are encapsulated into Visualization components that map data structures into visual shapes. Visualizations natively support dynamic labeling and fisheye views.
Using this unified framework, a large number of interactive components required by information visualization are made generic and reusable across all the concrete data types and visualizations. These components are: dynamic queries and filters, selection, sorting and visual attributes manipulation.
The InfoVis Toolkit currently supports three concrete data structures: tables, trees and graphs. For each data structure, it supports several visualizations: time series and scatter plots for tables, node-link diagrams and treemaps for trees, node-link diagrams and adjacency matrices for graphs.
We have also added experimental support for accelerated graphics based on the OpenGL API to allow for richer graphics attributes and faster rendering.
Tables and Columns
A table is a list of named columns plus metadata and user data. A column manages rows of elements of homogeneous type, i.e. integers, floating points or strings. The elements are indexed so columns are usually implemented with primitive arrays. Some rows can be undefined. This mechanism is important because in real data sets, values may be missing. Allowing undefined elements is also very useful for representing general data structures. Figure 4 shows the data structures class hierarchy.
For columns containing Java Objects and derived types, undefined rows contain the null value. For scalar types, an associative structure keeps track of undefined rows. This implementation is fast and efficient for dense columns, where most rows are defined. For sparse attributes – such as an XML structure encoded as a tree where each element may have a set of attributes – we
The InfoVis Toolkit 3
provide sparse column implementations also based on associative structures. Even for these associative structures, using integers as keys is much faster than using objects.
Columns also support the following features:
• they contain metadata, e.g. to express that an integer column contains categorical or numeral values; • they can trigger notifications when their content is
modified. Since columns are often modified in large chunks, notification can be deferred;
• they support formatting for input and output so, for example, dates can be stored in columns of “long integers” data types and still appear as dates when read or displayed. This is important because scalar attributes are more space and time efficient than the equivalent complex objects.
A data set is stored as a table where each row represents a record and each column an attribute. This is natural for tabular data sets, but we also represent trees and graphs with this data structure. Trees and graphs are implemented as wrappers on top of tables with topological information represented by internal columns. By convention, an internal column is a normal column with a special prefix in front of its name. It can contain internal information, e.g. topological or data synthesized
from other columns. These columns are not saved to files by data writers and not available for dynamic queries, with some exceptions.
Representing the topology of a tree consists in adding a “parent”, “first child” and “next sibling” column [ 18]. More columns are created on demand if performance requires so, for instance for the degree of nodes (number of children), the sorted children list or the children depth. Since these attributes are synthesized from the basic topological structure and should be recomputed when the topology changes, they are not created by default. The toolkit supports a synchronization mechanism to trigger the re-computation of synthesized columns when their dependencies are changed. This re-computation occurs rarely in real situations since the data sets are usually not modified once they have been loaded. With this synchronization mechanism, any synthesized value can be turned into a column and handled like any other attribute value for dynamic queries or more general filtering.
Internal columns are also used for selection and dynamic filtering. Selection is managed through a column of boolean values (a row is selected when its column value is true) whereas dynamic filtering uses a column of bit sets (see section Filtering Performance.) Boolean columns implement the Java ListSelectionModel interface and Tables implement the TableModel interface, enabling their integration into standard Java components.
Visualizations
Visualizations transform a set of semantic attributes stored in table columns into visual representations. They also perform filtering, zooming, navigation and picking. Each Visualization exposes a list of visual attributes that can be associated with columns. It then maintains an internal column of graphic shapes that are filtered before being rendered. Visualizations are redisplayed when at least one of the columns it refers to is modified. Furthermore, when a visual attribute used to compute the shapes is modified, the shapes are invalidated and recomputed for the next rendering or picking. This mechanism unifies all the column changes, either due to a change in attribute values, in selection or during dynamic queries. No attempt is made to optimize dynamic queries at this level.
Standard visual attributes include color, size, label and sorting order. Selecting and filtering, while not visual attributes, behave exactly in the same way. By default, they are associated with the related internal table columns, creating coordinated visualizations when several visualizations refer to the same table. For creating un-coordinated visualizations, new selection and filter columns should be associated with the visualizations: columns are independent data containers that can exist outside of tables.
Specific visualizations can add more visual attributes or add constraints to them. Scatter plots add x-axis and y-axis visual attributes. Treemaps constrain the column used for sizes to be additive with the hierarchy. Graph visualizations (both adjacency matrices and node-link diagrams) add visual attributes for edges and vertices.
Metadata
Table Column
DefaultTable TableProxy Tree Graph
TableModel DefaultTree DefaultGraph AbstractColumn ArrayColumn SparseColumn NumberColumn ObjectColumn StringColumn FilterColumn
BooleanColumn IntColumn LongColumn FloatColumn
ListSelectionModel
Figure 4: Hierarchy of tables and column classes defined by the InfoVis Toolkit.
Writers Readers Table Visualization C o lu m n s M et ad at a V is u al A tt ri b u te s Layout S h ap e C o lu m n Rendering Labeling Picking Fisheyes Image Components
Dyamic Queries Controls
Figure 3: Internal structure of the InfoVis Toolkit. Squares represent data structures whereas ellipses represent functions.
4 Fekete Visualizations use several sub-components to manage
colors, permutations, redisplay, labeling and spatial deformation.
Colors Mapping from abstract attributes to color is done through a color visualization: an interface that returns a color from a table row. Currently, we support four types of mapping for columns categorized as sequential, categorical, differential and explicit. The first three are described by Brewer [ 9] whereas the fourth simply means that the column directly contains a color specification. These categories can be explicitly stated in the column’s “valueCategory” metadata or guessed from the column type and range. When a column is specified for the color visual attribute, its color visualization is returned by a Color Visualization Factory. Factories are used in several places in the InfoVis Toolkit. They are meant to be extended and modified by programmers; they allow a loose coupling between related components – like columns and their color visualizations. Globally changing color management in all the visualizations of the toolkit only requires the corresponding factory object to be modified.
Permutations. Permutations are used both for sorting and deep filtering. They specify an order for table rows with the capability of filtering out a row by not specifying it in the order, hiding it from the visualization. Permutations also maintain the reverse mapping, from a row number to its index, and the count of visible rows. For tables, nothing more is required to manage permutations of rows. For trees, an updated view of the tree topology has to be maintained by the tree visualization with the children list sorted and filtered according to the permutation. For graph visualizations, we maintain permutations for the vertices and for the edges. Node-link diagram layouts are usually sensitive to the vertices and edges order. Matrix visualization requires two vertices permutations for the row and column order. The graph visualizations also need to maintain a modified graph topology with the edges sorted and filtered according to the edges permutation.
Redisplay. Redisplay is split between layout and rendering. Most of the time, a layout can be reused several times. Consider a user exploring a visualization: the first redisplay computes the layout. Then, the user explores the display, looking at labels through tooltips or excentric labels. These dynamic labels require some picking to be computed, the picking reuses the computed layout. Selection only causes a redisplay without re-layout. In general, filtering only changes the set of redisplayed items, not their layout. This may seem odd for treemaps or graphs. We could recompute the layout each time an item is filtered, but that would usually change the display dramatically, making it hard or impossible to follow the changes from one frame to the next. Instead, just like in the Treemap4 program, we “grey out” filtered items interactively and offer a “remove filtered” option to erase them afterwards through the permutation. Only this last command requires a re-computation of the layout. Some dynamic filters do trigger a re-layout, in particular the filtering of the X or Y axis column of scatter plots.
The complexity of layout algorithms is linear for all table
and tree visualizations (we are not aware of the need for more complex algorithm.) For graphs, only the matrix visualization is linear with the number of edges. All other graph layout algorithms are more complex and cannot be computed in interactive time for more than a few hundred items. This is also why we do not perform a layout when filtering a tree or a graph. When the user triggers a “hide filtered” or “hide selected” button, the items are hidden (removed from the permutation) and the layout is performed without them, which may take a couple of seconds for complex graphs.
Rendering Visualizations maintain a column of shapes and repaint them when required. The rendering of items relies on shapes but also on color computation and optionally fisheye lenses. By default, the rendering
iterates over each non-filtered rows in permutation order, computing the color with the color visualization component. The shape is painted, as well as a border – usually black for non-selected items and red for selected ones. We have also implemented the smooth-shading techniques used in MillionVis [ 12].
The basic visualization allows for smooth shaded rendering where, instead of outlining items and drawing them with a flat color, items are shaded slightly so that they are distinguishable, even if they overlap (Figure 5.) However, using smooth shading (using GradientPaint objects) is very expensive in Java.
We experimented with native OpenGL graphics from Java, but gave up because it forced us to maintain two different implementations of each visualization to remain compatible with Java components. Instead, we have used Agile2D, an encapsulation of Graphics2D based on OpenGL, to get better rendering performance. Despite its merits, Agile2D support is still experimental because the current implementation of Java and Swing is not designed to support alternate Graphics2D implementations. This leads to refresh and double-buffering issues that we have not yet been able to solve. However, the potentials are very promising, especially for visual attributes such as transparency or gradient that are very expensive in native Java, as described in the results section.
Labeling Visualizations optionally support tool tips or dynamic labeling [ 13]. They use the visualization’s picking mechanism to compute the labels under the pointer. Two methods are provided for picking: one returns the topmost item under a position and the second returns a list of items intersecting a rectangle.
Spatial Deformations Spatial deformations can be applied by the rendering after the shapes have been computed by the layout. The toolkit currently supports a subset of Carpendale’s [ 10] deformations within an extensible framework. We use a Fisheye object that transforms a Java shape into its deformation through the lens. Our implementation checks whether a specified shape intersects the lens and, if not, returns it without
The InfoVis Toolkit 5 further processing. If it does, we iterate over its outline,
applying the lens deformation to each of the control vertices. This method alone produces bad results even for simple shapes (Figure 6-b.) Instead, we further subdivide the shape’s outline with the following recursive procedure, assuming the lens is a continuous spatial deformation (Figure 6-c):
Procedure subdivide(segment, outShape) Subdivide the segment at midpoint Transform the first, middle and last
control points
If they are flatter than the tolerance, add the last point to outShape
Otherwise, split the original segment in two and call subdivide on both parts.
This algorithm gives good results if the tolerance is 1 pixel but may produces cracks otherwise. We also tried a regular grid-sampling on a view-aligned grid, with a default grid value of 4 pixels. This subdivision is not adaptive but behaves in a predictable manner, with worse performance than the adaptive algorithm, even with a small tolerance. We provide interactive controls for users to choose the tolerance if they wish to trade speed for quality.
Components
The information visualization literature describes a very large and rich set of interaction components, such as range sliders (or double edge sliders), alpha sliders and others visualization sliders. Moreover, visualizations can
themselves be tailored into components for specific interaction tasks, blurring the limit between information visualization components and traditional interactive components or widgets. For example, a tree selection component in a toolkit is an interactive visualization using a specific representation and interaction. There is no reason why only one type of visualization should be provided. Similarly, a data slider is simply a slider with a visualization overlaid on top of it. Based on these observations, we designed the InfoVis toolkit visualizations so they can be used as components or within components.
In addition to the visualization components, the InfoVis toolkit provides several components to support interactive manipulations. By default, each visualization comes with a control panel organized in a tab group to interactively manipulate or configure the visualization (Figure 7.) The coupling between the visualizations and their panels is done through factories to allow programmers to substitute their own panels, components and interaction modes. Predefined components include range sliders and color visualization selectors. More components can be added as Swing components or InfoVis embedded components. Sliders or range sliders can then visualize interesting features such as text paragraph marks, code indentation depth and distribution of data. Tree selection components can be implemented using any tree visualization. We describe an example of such an extension in the example section below.
RESULTS
Allocation for Java Object InfoVis
Table row h+2w w
Tree leaf h+2w 4w
Tree interior node h+2w+h+4c 4w Graph vertex 2h+w+(4+16)e 2w+3w e Allowed attributes not used, add 4 0 Allowed attributes used add w+h+(h+w)a w a
Table 1: Comparison of memory footprint between objects and InfoVis representations. Header size (h) is 8/12 bytes, Word size (w) is 4 bytes. Children count is c, edge count is e, attribute count is a. For simplicity here, we assume attributes use one word.
Evaluating a new toolkit is difficult because there is no well specified metrics for doing so. We have studied the memory footprint of data sets loaded compared with similar systems that can be benchmarked. We also describe performance in terms of rendering speed and Figure 7: Standard Control Panels for Treemap Visualization
a
b
c Figure 6: Subdivision of Shape Outlines for Fisheye Deformations; a) is the non-deformed visualization, b) is the non-subdivided deformation, c) is the correctly subdivided deformation.
6 Fekete filtering speed. We tried to improve rendering
performance by using an implementation of Java Graphics based on OpenGL. We discuss the tradeoffs for using it, the performance we achieve compared with other systems on a high end laptop equivalent to a standard desktop platform: a Dell M50 laptop running Windows XP with a 1.8GHz Pentium 4 processor and an NVidia Quadro4Go graphics card. InfoVis runs with Sun Java 1.4.1. Finally, we also show an example of a new visualization we created with the toolkit to show its modularity and extensibility.
Memory footprint
Table 1 summarizes the memory footprint of the InfoVis Toolkit compared with the simplest Java Objects. It should be noted that objects add some type safety compared with integers, besides their memory overhead. .
Footprint of Tables: Java Swing default tables are allocated as a vector of vectors. A Java Vector is a growable array of objects. Therefore, allocating a table of scalar objects such as integers or floating points requires one object per entry. The comparison with InfoVis tables, ignoring growable tables overhead, is the following: for n literal objects, Java Swing Tables requires n pointers plus n object structures plus n times the natural size of the literal whereas InfoVis only needs n times the natural size of the literal. On popular Java implementations, objects use at least 8 bytes for their headers and pointers use 4 bytes so Java uses 12 extra bytes for each value, four times more than the InfoVis toolkit2 for integers and floats.
Footprint of Trees: Encoding the topology of trees in a table is described by Knuth [ 18] as requiring at least three indexes per node: the parent, the first child and the next sibling. We use a fourth pointer to the last child for fast insertion at the end of the children list. Implementing trees with objects uses one object per node, containing at least a table of children and a pointer to the parent. When adding attributes to nodes, one pointer is added and each attribute is created as an object and stored in an array.
Real applications such as Treemap4 and SpaceTree, also store transient values in nodes because there is no convenient and efficient way to store them elsewhere using objects. Table 2 compares the node sizes without added attributes. SpaceTree nodes are larger because they are also scene graph nodes and they maintain a degree of interest attribute.
Program Node size Transient data size Treemap4 17w+3booleans 2w
SpaceTree 29w+20booleans 6w InfoVis 11w+1boolean 0
Table 2: Comparison of node sizes and transient storage sizes in Treemap4, SpaceTree and InfoVis.
Footprint of Graphs: InfoVis graphs are encoded as two tables: one for the vertices and one for the edges. For each vertex, we maintain an index to the first and last outgoing edge in the edge table. The edge table maintains three indexes for each edge: the incoming
2
In principle, 8 bytes are enough to describe a Java object header but 12 are used in some implementations.
vertex, the outgoing vertex and the next edge associated with the vertex. Thus, each vertex requires 8 bytes and each edge 12 bytes. A minimal Java implementation would use one object for each vertex, containing a list of edges, and one object for each edge, containing two pointers to the in/out vertices. Supporting attributes adds the same overhead as for trees.
Data Locality More important than footprint is data locality in memory, since current computer architectures use hardware caching to optimize contiguous memory usage. Primitive arrays are always contiguous whereas successively allocated objects are rarely contiguous as programs run and memory becomes fragmented. When filtering a data set, a dynamic query applies a Boolean expression to each row. Table 3 shows that data locality improves performance much more than avoiding indirection or type casts.
Allocation time and initialization of a 1,000,000 elements int array
190ms Allocation time and initialization of a 1,000,000
elements ArrayList of Integer
360ms Applying a “noop” filter object on the 1,000,000
elements of the int array
60ms Applying a “noop” filter object on the 1,000,000
elements of the ArrayList
80ms Applying a “noop” filter object on the 1,000,000
elements of the ArrayList randomly permuted
290ms Table 3: speed comparison of IntColumn and ArrayList in five contexts showing the importance of data locality.
Rendering Performance
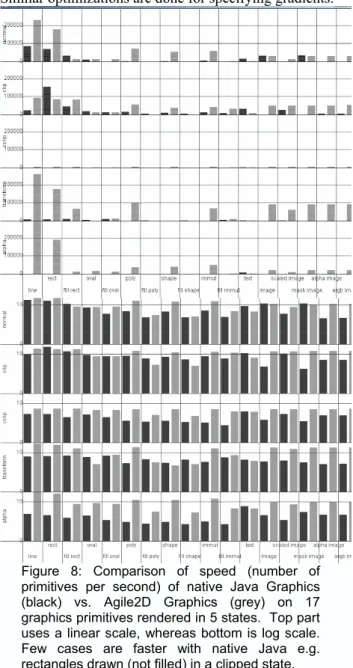
Rendering time depends on the implementation of the graphics libraries and sometimes on software optimizations to avoid expensive operations. In Java, graphics is implemented through the Graphics2D object, supposedly as efficient as possible on the available hardware. The InfoVis toolkit relies on the standard implementation of Graphics2D, but we also experimented with Agile2D, an implementation of the Graphics2D based on the OpenGL API that can take advantage of hardware acceleration when available. We also experienced with native OpenGL support from Java, but gave up because it forced us to maintain two different versions for each visualization. By relying on an encapsulation of Graphics2D based on OpenGL, we expected compatibility with Java code and better performance. Figure 8 compares the rendering speed of native vs. Agile2D implementations of Graphics2D. Applied to scatter plot visualization, Table 4 highlights the difference between the relatively low performances of native Java graphics compared with Agile2D graphics. It also shows the benefit of using OpenGL directly: Agile2D is 10 times faster than native Java2D – comparable with commercial products – but direct OpenGL is 60 times faster than Agile2D. For translucent lines, used in time series, Agile2D is 200 times faster than native Java.
Spotfire 120,000 item/s
InfoVis with Java native 12,000 item/s InfoVis with Java Agile2D 100,000 item/s
MillionVis 6,000,000 item/s
Table 4: Comparison of scatter plot rendering speed
The InfoVis Toolkit 7 To achieve the full OpenGL speed requires techniques
such as those described in [ 12] that do not match with the Graphics2D style of graphics since it relies on OpenGL vertex arrays. Vertex arrays are tables containing triangles or quadrilaterals, associated with graphical attribute information at each vertex. A vertex array can be thought of as a “buffered graphics” or “batched graphics” where several primitives are sent together to the graphics card in a format suited for direct rendering at full speed of each hardware component and without loading the processor. Supporting this model of “buffered graphics” could not easily be done in a way compatible with the “one primitive at a time” graphics model supported by Java and its components.
Still, we have started adding simple yet effective performance improvements: allowing colors to be specified as one literal integer value encoded with 8 bits for each components, as is done internally in Java. Java colors are objects and visualization requires the creation of large number of colors, leading to frequent allocations and garbage collections that we avoid with Agile2D. Similar optimizations are done for specifying gradients.
Filtering Performance
Filtering performance is the time required to compute which items need to be displayed, given a set of filtering expressions. Usually, each expression is a range query or set membership query and a dynamic query is the conjunctive combination of all the expressions [ 2]. To perform this operation as quickly as possible, dynamic queries rely on a column of bit sets. Each expression is allocated one bit. For each row, this bit is set when the expression returns true (the row is filtered.) When all the filters have been applied, only the rows with no bit set are displayed. When a dynamic filter is applied, only its bit is recomputed for all the rows so updating is always in time linear with the number of rows (if the filter time is constant, which is true for all our filters).
Tanin et al. [ 21] describe two optimizations to dynamic queries that are implemented by several visualization systems (including Spotfire and Treemap4). First, they note that sliders are displayed using a specified number of pixels and no more slider positions can be perceived so they pre-compute, for each pixel position of the sliders, the set of items that are affected by the slider going though this pixel (it can increase or decrease depending on whether the slider goes one way or the other.) Using this technique, a second optimization is then applied: not all items are redisplayed when the slider moves. When new items are added, they are simply displayed on top of the others. When they are removed, the items are drawn using the background color. Nothing is done to show the items underneath in scatter plots, as seen in Figure 9. This is considered as acceptable since this rendering is only transient, during the dynamic query.
We do not perform these optimizations for three reasons: they require a complicated implementation with intricate inter-dependencies between all the sliders to correctly compute the delta items; we do not want to deal with transient states during redisplay; finally, we want to provide sub-pixel precision when interacting with range-sliders. This is a very important issue when visualizing large data sets: if the precision of the sliders were related to their sizes, sliders would compete for screen real-estate with the visualization itself. Therefore, our range-sliders offer sub-pixel resolution: by moving the pointer away from the slider on the orthogonal direction, we increase the resolution and therefore the virtual length of the slider. There are many other ways described in the literature to avoid this pixel resolution problem [ 19, 1] and we felt using the optimization of Tanin et al. [ 21] would limit the toolkit. The filtering speed is approximately 3,000,000 items per second. The limiting factor to achieve a 100ms interaction loop is therefore the rendering, which limits to 10,000 the maximal number of visible items for smooth interaction.
Figure 8: Comparison of speed (number of primitives per second) of native Java Graphics (black) vs. Agile2D Graphics (grey) on 17 graphics primitives rendered in 5 states. Top part uses a linear scale, whereas bottom is log scale. Few cases are faster with native Java e.g. rectangles drawn (not filled) in a clipped state.
Figure 9: Optimizations of dynamic queries lead to incorrect display, all overlapping items being erased when some items are filtered out
8 Fekete
EXAMPLE OF EXTENSION
The InfoVis Toolkit is extensible. This section explains the steps required to create a new tree visualization and integrate it as a control component inside an adjacency matrix visualization.
As explained by Bertin [ 8], a matrix is an effective visualization for graphs if it can be reordered to exhibit clear visual patterns. With tens of vertices, rows and columns can be reordered interactively one by one. For more vertices, other methods are required. We have designed the VisAdj system, based on hierarchical clustering and interaction to reorder the clusters. To visualize the clusters, we use “Icicle trees” [ 4] next to the matrix (Figure 11.)
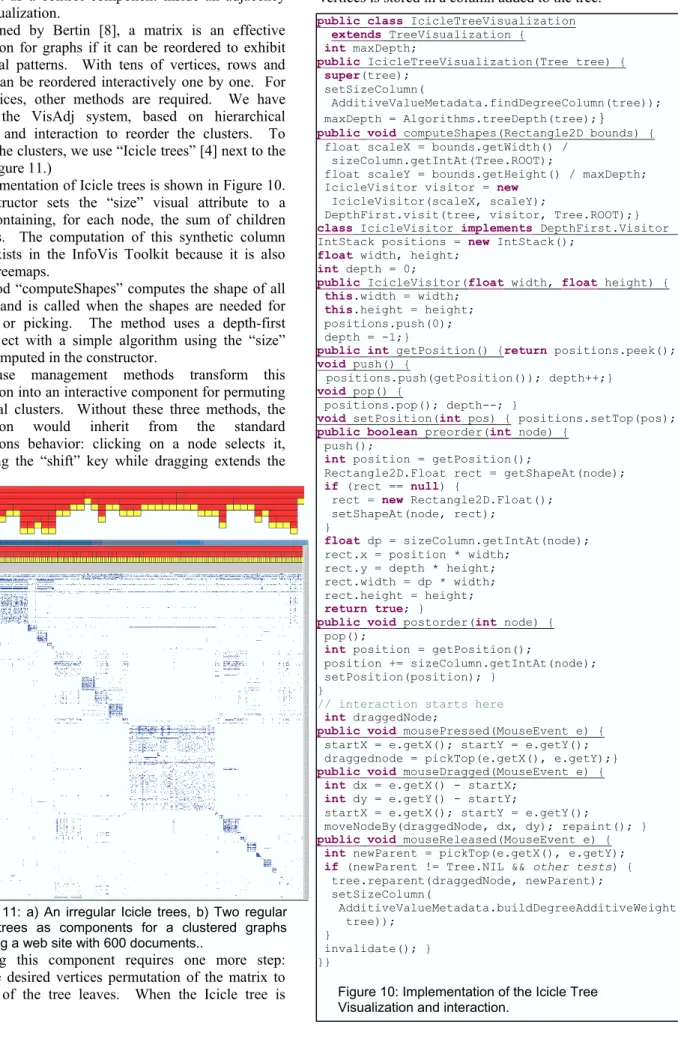
The implementation of Icicle trees is shown in Figure 10. The constructor sets the “size” visual attribute to a column containing, for each node, the sum of children leaf nodes. The computation of this synthetic column already exists in the InfoVis Toolkit because it is also used by Treemaps.
The method “computeShapes” computes the shape of all the items and is called when the shapes are needed for rendering or picking. The method uses a depth-first visitor object with a simple algorithm using the “size” column computed in the constructor.
The mouse management methods transform this visualization into an interactive component for permuting hierarchical clusters. Without these three methods, the visualization would inherit from the standard visualizations behavior: clicking on a node selects it, maintaining the “shift” key while dragging extends the selection.
Connecting this component requires one more step: setting the desired vertices permutation of the matrix to the order of the tree leaves. When the Icicle tree is
reordered, the permutation is computed by performing a depth first traversal collecting the vertices related to the leaf nodes. The mapping from leaf nodes to the graph vertices is stored in a column added to the tree.
a)
b)
Figure 11: a) An irregular Icicle trees, b) Two regular Icicle trees as components for a clustered graphs showing a web site with 600 documents..
public class IcicleTreeVisualization
extends TreeVisualization {
int maxDepth;
public IcicleTreeVisualization(Tree tree) {
super(tree);
setSizeColumn(
AdditiveValueMetadata.findDegreeColumn(tree)); maxDepth = Algorithms.treeDepth(tree);}
public void computeShapes(Rectangle2D bounds) {
float scaleX = bounds.getWidth() / sizeColumn.getIntAt(Tree.ROOT);
float scaleY = bounds.getHeight() / maxDepth; IcicleVisitor visitor = new
IcicleVisitor(scaleX, scaleY);
DepthFirst.visit(tree, visitor, Tree.ROOT);}
class IcicleVisitor implements DepthFirst.Visitor {
IntStack positions = new IntStack();
float width, height;
int depth = 0;
public IcicleVisitor(float width, float height) {
this.width = width;
this.height = height;
positions.push(0); depth = -1;}
public int getPosition() {return positions.peek(); }
void push() {
positions.push(getPosition()); depth++;} void pop() {
positions.pop(); depth--; }
void setPosition(int pos) { positions.setTop(pos);}
public boolean preorder(int node) {
push();
int position = getPosition();
Rectangle2D.Float rect = getShapeAt(node); if (rect == null) {
rect = new Rectangle2D.Float(); setShapeAt(node, rect);
}
float dp = sizeColumn.getIntAt(node);
rect.x = position * width; rect.y = depth * height; rect.width = dp * width; rect.height = height;
return true; }
public void postorder(int node) {
pop();
int position = getPosition();
position += sizeColumn.getIntAt(node); setPosition(position); }
}
// interaction starts here
int draggedNode;
public void mousePressed(MouseEvent e) {
startX = e.getX(); startY = e.getY(); draggednode = pickTop(e.getX(), e.getY);}
public void mouseDragged(MouseEvent e) {
int dx = e.getX() - startX; int dy = e.getY() - startY;
startX = e.getX(); startY = e.getY();
moveNodeBy(draggedNode, dx, dy); repaint(); }
public void mouseReleased(MouseEvent e) {
int newParent = pickTop(e.getX(), e.getY); if (newParent != Tree.NIL && other tests) { tree.reparent(draggedNode, newParent); setSizeColumn( AdditiveValueMetadata.buildDegreeAdditiveWeight( tree)); } invalidate(); } }}
Figure 10: Implementation of the Icicle Tree Visualization and interaction.
The InfoVis Toolkit 9 CONCLUSION AND FUTUR WORK
This article described the InfoVis Toolkit, a toolkit that supports the development and extension of 2D Information Visualization components and applications using Java and Swing. Its key features are:
• Generic data structures suited to visualization • Specific algorithms to visualize these data structures • Mechanisms and components to perform direct
manipulation on the visualizations
• Mechanisms and components to select, filter and perform well-known generic tasks of information visualization
• Components to perform labeling and spatial deformation.
InfoVis brings together several ideas from different domains and assembles them in a consistent framework, supporting the creation of new visualization techniques, thanks to optimized data structures and components to fit them together. It also supports the creation of new interaction components – such as new space deformation techniques or new sliders – that can easily replace existing ones for interacting on visualizations. It finally allows information visualization techniques to be easily integrated into any interactive application, bridging the gap between the information visualization community and the communities that need it.
The InfoVis Toolkit consists of approximately 30,000 lines of Java and a 300K Jar file. Agile2D is a 80K Jar file requiring 1MB of libraries for OpenGL. It is currently licensed under the Q Public License and is available at:
http://www.lri.fr/~fekete/InfovisToolkit. It is used by several research projects in domains including biology, cartography and trace analysis.
A major concern with the InfoVis toolkit is offering performance without losing flexibility and modularity. We will improve the Agile2D system to offer new abstractions while keeping with the Java2D compatibility as much as possible. We also hope Sun will allow better integration for non-native implementations of Graphics2D. By relying more on OpenGL, we expect to offer richer visual attributes to visualizations, including management of the third dimension with its related capabilities such as lighting, fog, depth clipping and stereovision to name a few. These capabilities do not require any 3D navigation to be usable.
In the near future, we also plan to implement mechanisms to support animation and continuous monitoring for time-oriented visualizations.
We look forward to continuing the development of the InfoVis Toolkit and expect the Information visualization community to provide visualization components and useful feedback to improve it.
REFERENCES
1. Ahlberg, C. and Shneiderman, B. The Alphaslider: A Compact and Rapid Selector, ACM CHI '94 Conference Proc. (Boston, MA, April 24-28, 1994) 365-371.
2. Ahlberg, C. and Shneiderman, B. Visual Information Seeking: Tight Coupling of Dynamic Query Filters with Starfield Displays. Proceedings of CHI '94, (Boston, MA, April 24-28) ACM, New York, (1994), pp. 313-317.
3. Ahlberg, C. and Wistrand, E. "IVEE: An Information Visualization & Exploration Environment," Proceedings of Information Visualization '95, p. 66-73.
4. Barlow, T. Neville, P.: A Comparison of 2-D Visualizations of Hierarchies. IEEE Symposium on Information Visualization 2001 (INFOVIS'01), 22-23 October 2001, San Diego, CA, USA. IEEE Computer Society pp 131-138
5. Bederson, B. B. PhotoMesa: A Zoomable Image Browser Using Quantum Treemaps and Bubblemaps. UIST 2001, ACM Symposium on User Interface Software and Technology, CHI Letters, 3(2), pp. 71-80.
6. Bederson, B., Hollan, J., Perlin, K., Meyer, J., Bacon, D., and Furnas, G., Pad++: A Zoomable Graphical Sketchpad for Exploring Alternate Interface Physics, Journal of Visual Languages and Computing, 7, 3-31, 1996.
7. Bederson, B., Meyer, J., Good, L., Jazz: An Extensible Zoomable User Interface Graphics Toolkit in Java, In ACM UIST 2000 ACM Press, pp. 171-180
8. Bertin, J. Graphics and Graphic Information Processing. Walter de Gruter & Co., Berlin, 1981. 9. Brewer, C. A., Guidelines for Use of the Perceptual
Dimensions of Color for Mapping and Visualization, in Color Hard Copy and Graphic Arts III, edited by J. Bares, Proceedings of the International Society for Optical Engineering (SPIE), San José, 1994, Vol. 2171, pp. 54-63.
10. Carpendale, M. S. T. and Montagnese, C. A framework for unifying presentation space, in Proc. of the 14th annual ACM symposium on User interface software and technology, 2001, Orlando, Florida, pp. 61 – 70.
11. CHI, E. H. A Framework for Information Visualization Spreadsheets. PhD thesis, Department of Computer Science, University of Minnesota, March 1999.
12. Fekete, J.-D. and Plaisant, C. Interactive Information Visualization of a Million Items Proceedings of IEEE Symposium on Information Visualization, 2002, pp 117 -124, Boston, October 2002.
13. Fekete, J.-D., and Plaisant, C. Excentric labeling: Dynamic neighborhood labeling for data visualization. In Proc. of CHI '9, ACM Press, May 1999, pp. 512-519.
14. Furnas, G. Generalized fisheye views in Proc. of CHI'86, ACM Press, 1986, pp. 16-23.
15. Grosjean, J., Plaisant, C., Bederson, B., SpaceTree: Supporting Exploration in Large Node Link Tree, Design Evolution and Empirical Evaluation, Proceedings of IEEE Symposium on Information Visualization, 2002 pp. 57 -64, Boston, October 2002.
10 Fekete 16. HCIL Treemap 4.0 Software, Available at
http://www.cs.umd.edu/hcil/treemap/
17. Hopkins, D., The design and implementation of pie menus, Dr. Dobb's Journal, v.16 n.12, p.16-26, Dec. 1991
18. Knuth, D.E. The Art of Computer Programming, Volume 1, Fundamental Algorithms, Third Edition, Addison-Wesley, Reading, Mass. 1997.
19. Pook, S. Lecolinet, E. Vaysseix, G. and Barillot, E. Control Menu: Execution and Control in a Single Inter-actor. In Extended Abstracts of CHI2000, pages 263- 264, 2000.
20. Schroeder, W Martin, K Lorensen, B. The Visualization
Toolkit: An Object Oriented Approach to 3D Graphics 3rd
Edition. Kitware, Inc.; Feb, 2003, ISBN: 1 1-930934-07-6 21. Tanin, E., Beigel, R., and Shneiderman, B., Incremental
Data Structures and Algorithms for Dynamic Query Interfaces, SIGMOD Record (25) 4, 21-24, December 1996.
22. Thompson, D. Braun, J. Ford, R. OpenDX: Paths to
Visualization. VIS, Inc. 5515 Skyway Drive,
Missoula, MT 59804,
http://www.vizsolutions.com/paths.html.
23. Woo, M. Neider, J. Davis, T. and Shreiner, D. OpenGL
Programming Guide, Third Edition, Addison-Wesley,
Unit´e de recherche INRIA Futurs
Domaine de Voluceau - Rocquencourt - BP 105 - 78153 Le Chesnay Cedex (France)
Unit´e de recherche INRIA Lorraine : LORIA, Technopˆole de Nancy-Brabois - Campus scientifique 615, rue du Jardin Botanique - BP 101 - 54602 Villers-l`es-Nancy Cedex (France)
Unit´e de recherche INRIA Rennes : IRISA, Campus universitaire de Beaulieu - 35042 Rennes Cedex (France) Unit´e de recherche INRIA Rhˆone-Alpes : 655, avenue de l’Europe - 38330 Montbonnot-St-Martin (France) Unit´e de recherche INRIA Rocquencourt : Domaine de Voluceau - Rocquencourt - BP 105 - 78153 Le Chesnay Cedex (France)
Unit´e de recherche INRIA Sophia Antipolis : 2004, route des Lucioles - BP 93 - 06902 Sophia Antipolis Cedex (France)
´ Editeur
INRIA - Domaine de Voluceau - Rocquencourt, BP 105 - 78153 Le Chesnay Cedex (France)
http://www.inria.fr