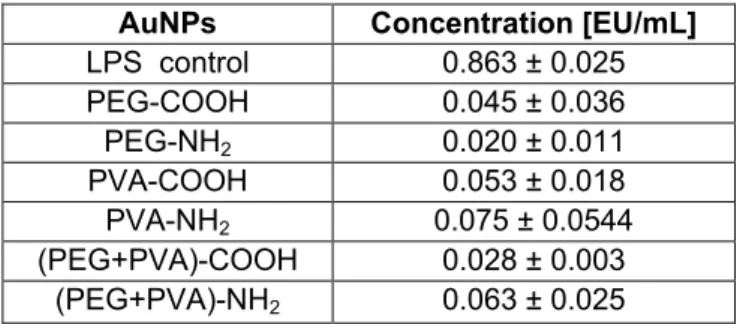
Table S1. Endotoxin quantification in the AuNPs suspensions. Results are expressed as Mean±SD (n=3).
AuNPs Concentration [EU/mL] LPS control 0.863 ± 0.025 PEG-COOH 0.045 ± 0.036 PEG-NH2 0.020 ± 0.011 PVA-COOH 0.053 ± 0.018 PVA-NH2 0.075 ± 0.0544 (PEG+PVA)-COOH 0.028 ± 0.003 (PEG+PVA)-NH2 0.063 ± 0.025
1 Supporting Information
1
Cell viability 2
Trypan Blue exclusion assay and phase contrast pictures 3
4
The experiment was performed according to the manufacturer’s protocol (Sigma
5
Aldrich, T8154-100ML). Briefly, 100μL of cell suspension was mixed with 100μL of
6
Trypan Blue dye and incubated at RT for 3min. After the incubation period, 10μL of
7
the mixture was applied to a haemocytometer (Blau Brand, Ref. 717805, Germany)
8
and a cell count was performed (a total of 100 cells were counted for each sample).
9
The percentage viability in relation to the negative control (i.e. cells not treated with
10
AuNPs) was subsequently calculated. Cells that were incubated at -80oC for 30min
11
were used as a positive control. Complementary to that, phase contrast pictures at a
12
x40 magnification were captured (Motic, AE2000 Inverted Microscope Motic
13
Deutschland GmbH, Wetzlar, Germany) in order to characterize the morphology of
14
the cells following AuNP exposure. Results (Fig. S3) indicate the PVA-NH2 AuNPs at
15
100μg/ml induce significant decrease in cell viability (p<0.01) compared to the
16
negative control (untreated cells).
17 18
Polymer mediated Cytokine secretion 19
In order to examine if the polymers that were used as coating for the AuNPs are
20
associated with cytokine secretion, MDDCs were exposed to 20 and 100μg/ml of the
21
polymers, without the presence of AuNPs. TNF-α and IL-1β ELISA measurements
22
were also performed as mentioned on the Methods section (Fig. S7)
23
Polymer synthesis 24
PEG-COOH 25
The PEG-COOH solutions are prepared by dissolving 0.6mg of COOH-PEG
26
(Creative PEGWorks) in 1mL of PBS pH 7.4, followed by sonication of the solution to
27
RT for 20min.
28
PEG-NH2 29
The PEG-NH2 solutions are prepared by dissolving 0.6mg of NH2-PEG (Creative
30
PEGWorks) in 1mL of PBS pH 7.4, followed by sonication the solution to RT for
31
20min.
32
PVA-COOH 33
The polymer solutions are prepared by dissolving 0.7mg of COOH-PVA (Kuraray
34
Poval KL-506), and 1.2mg of PVA (INV-000019, Mowiol 3-85) in 1mL of PBS pH 7.4,
35
followed by rapidly heating the solution to 90°C for 15min and cooling to RT.
36
PVA-NH2 37
The polymer solutions are prepared by dissolving 0.2mg of NH2-PVA (Vinyl
38
amine/vinyl alcohol co-polymer M12), and 1.1mg of PVA (INV-000019, Mowiol 3-85)
39
in 1mL of PBS pH 7.4, followed by rapidly heating the solution to 90°C for 30 min and
40
cooling to RT.
2 (PEG+PVA)-COOH
1
The polymer solutions are prepared by dissolving, 0.4mg of COOH-PEG (Creative
2
PEGWorks) and 0.4mg of COOH-PVA ( Kuraray Poval KL-506) in 1mL of PBS pH
3
7.4, followed by sonication the solution to 40°C for 30min and cooling to RT.
4
(PEG+PVA)-NH2 5
The polymer solutions are prepared by dissolving 0.4mg of NH2-PEG (Creative
6
PEGWorks) and 0.4mg of NH2-PVA (Vinyl amine/vinyl alcohol co-polymer M12) in 1
7
mL of PBS pH 7.4, followed by sonication the solution to 40°C for 30min and cooling
8
to RT.
9
ELISA 10
MDDCs were exposed to 20 and 100μg/ml of polymer with/without the addition of
11
100ng/mL LPS. After 16h of incubation, supernatants were collected and the TNF-α
12
and IL-1β ELISA experiments were performed, as described in the Methods section.
13
Endotoxin Testing
14
Initially, the quantification of endotoxin content of all AuNPs solutions was performed 15
by using the PYROGENTTM - 5000 Limulus Amebocyte Lysate assay (Lonza, USA). 16
The results were observed to be below the limit of detection, <0.003EU/mL, 17
(Courtesy of Dr. Huber at the Institute of Pharmacy, Inselspital, Bern, Switzerland). 18
Since there is evidence that AuNPs interfere with endotoxin assays, we have used 19
the Pierce LAL Chromogenic Endotoxin Quantification kit (Cat. No.:88282, Thermo 20
Scientific, Waltham, MA, USA) was utilized according to the kit’s instruction. 21
According to the literature [1-3] this kit is suitable for endotoxin testing of
22
nanoparticles, since the interference effect is brought to a minimum. Results indicate 23
that all the used AuNPs suspensions have an endotoxin content of less than 24
0.1EU/mL. The EU limits for medical devices are defined by the US FDA with the limit 25
of 0.5 EU/mL for products that directly or indirectly contact the cardiovascular system 26
and lymphatic system [4].The exact values measured in our samples are shown in
27
Table S1. 28
29
LPS-AuNPs interference testing
30 31
In order to examine potential interference between LPS and AuNPs, 20μg/ml AuNPs 32
and 100ng/ml LPS were incubated for 24h at RT. DLS (scattering angle of 90o for
33
5min, at RT. Each treatment was run 3 times) measurements were performed in 34
order to observe potential differences in the size of the LPS-treated AuNPs. Non-LPS 35
treated AuNPs suspensions were used as a control. Table S2 demonstrates that no 36
alterations in size take place. These results can be explained by the lack of 37
electrostatic and hydrophobic interactions between LPS and the polymer on the Au 38
surface, which does not favor the LPS adsorption on AuNPs. Gao et al. [5] have
39
previously demonstrated that only when electrostatic attraction and hydrophobic 40
stacking are both present, the binding of LPS on AuNPs can be not only highly 41
efficient, but also positively cooperative. In a complementary study, Lan et al [6]
42
reported a new colorimetric sensor, which is capable of detecting picomolar 43
concentrations of LPS. The sensor performance was demonstrated to originate from 44
multiple electrostatic and hydrophobic cooperative interactions. 45
3
Correlation calculations
1 2
In order to calculate correlation between the cell-associated Au and the secreted 3
cytokines, the Pearson’s correlation method was used. According to the experimental 4
design that was followed, each experiment was repeated three times (n=3) and all 5
treatments were measured in triplicates. This gives a 3X3=9 (N=9). For the Pearson’s 6
correlation the degrees of freedom (df) is given from the formula df=N-2. According to 7
our experimental design df=9-2=7. According to the two-tailed Probabilities Table at 8
the statistical significance level of 0.05, the R value is equal to 0.666. None of the 9
obtained values is higher than 0.666 (p>0.05), so there is no statistical relevance. 10
11 12
Figure Legends 13
Figure S1. Colloidal stability in serum supplemented cell culture medium. 14
Extinction spectra of polymer-coated AuNPs kept at 37°C and 5% CO2 in RPMI 1640
15
medium with 10% FCS, 1% L-Glu, 1%, Pen-Strep, 10ng/mL GM-CSF and 10ng/mL
16
IL-4. The spectra were normalized based on their absorbance at 400nm.
17 18
Figure S2. Phase Contrast Images of MDDCs exposed to 100μg/ml of AuNPs, 19
with/without LPS. MDDCs were exposed to 100μg/ml of AuNPS with different 20
surface functionalizations for 16h, in the presence or absence of 100ng/mL LPS. The 21
only functionalization that is affecting cell viability is the PVA-NH2. In this case few
22
viable cells could be observed. LPS has no effect on viability. Scale bar: 100μm. 23
24
Figure S3. Trypan Blue Exclusion assay. AuNPs at a concentration of 20μg/mL 25
show levels of viability similar to the negative control. The only case when a
26
significant reduction in cell viability takes place was when cells were exposed to
27
100μg/mL PVA-NH2 AuNPs. LPS does not have an effect on cell viability. Untreated 28
cells were used as negative control and cells that were put to -80oC for 30min as
29
positive control. Cells from different cell cultures were taken for each repetition (Error
30
Bars: Mean±SD, **: p<0.01, n=3).
31
Figure S4. FACS Gating strategy for MDDCs population analysis. Initial gating 32
was done in Forward (FSC) and Side Scatter (SSC) to unstained (A, A’) and stained
33
MDDCs (B, B’). Histograms (C, C’) show representative frequencies of MHC-II+
34
MDDCs. Similar measurements were performed for the CD1c and CD83 markers.
35 36
Figure S5. MHC-II expression in the presence of OVA. The expression of MHC-II 37
was measured at 30, 60 and 120min upon OVA incubation (Error bars: Mean±SD,
38
n=3).
39 40
Figure S6. CD83 expression in the presence of OVA. The expression of CD83 41
was measured at 30, 60 and 120min upon OVA incubation (Error bars: Mean±SD,
42
n=3).
43 44
Figure S7. Polymer mediated cytokine secretion. (A) None of the polymers tested 45
showed significant increase of TNF-α production at 20 and 100μg/ml. Untreated cells
46
were used as negative control and cells exposed to 100ng/ml LPS as positive control. 47
Each experiment was repeated 3 times and cell supernatants from different cell 48
cultures were used (Error bars: Mean±SD, *p<0.05, n=3). (B) No significant amounts
4
of IL-1β were produced for the tested polymers at 20 and 100μg/ml. Untreated cells
1
were used as negative control and cells exposed to 100ng/ml LPS as positive control.
2
Each experiment was repeated three times and cell supernatants from different cell
3
cultures were used (Error bars: Mean±SD, n=3). 4
5
Figure S8. Correlation of AuNPs uptake and cell mediated cytokine secretion. 6
The numbers of cell-associated AuNPs of all the tested types were plotted against
7
the released cytokine concentration. The findings, expressed as Pearson’s r 8
correlation coefficients indicate that there is no correlation (p>0.05) observed 9
between the two variables (all the different tested AuNPs types versus the amounts 10 of produced cytokines). 11 12 REFERENCES 13
[1] Li Y et al., Optimizing the use of commercial LAL assays for the analysis of
14
endotoxin contamination in metal colloids and metal oxide nanoparticles. 15
Nanotoxicology 2014, Early online:1-12 16
[2] Neun and Dobrovolskaia (2011) Detection and quantitative evaluation of
17
endotoxin contamination in nanoparticle formulations by LAL-based assays Methods 18
Mol Biol 697:121-30
19
[3] Smulderss et al (2012) Contamination of nanoparticles by endotoxin: evaluation of
20
different test methods. Particle and Fibre Toxicology 9:41 21
[4]http://www.fda.gov/drugs/guidancecomplianceregulatoryinformation/guidances/uc
22
m314718.htm#_Toc315937935 23
[5] Gao J, Lai Y, Zhao Y Exploring and exploiting the synergy of non-covalent
24
interactions on the surface of gold nanoparticles for fluorescent turn-on sensing of 25
bacterial lipopolysaccharide. Nanoscale 2013 5(17):8242-8 26
27
[6] Lan M, Wu J, Liu W, Zhang W, Ge J, Zhang H Copolythiophene-derived
28
colorimetric and fluorometric sensor for visually supersensitive determination of 29
lipopolysaccharide. J Am Chem Soc 2012 134(15):6685-94 30
31 32 33