HAL Id: hal-00705264
https://hal.archives-ouvertes.fr/hal-00705264v2
Submitted on 29 Aug 2014HAL is a multi-disciplinary open access
archive for the deposit and dissemination of sci-entific research documents, whether they are pub-lished or not. The documents may come from teaching and research institutions in France or abroad, or from public or private research centers.
L’archive ouverte pluridisciplinaire HAL, est destinée au dépôt et à la diffusion de documents scientifiques de niveau recherche, publiés ou non, émanant des établissements d’enseignement et de recherche français ou étrangers, des laboratoires publics ou privés.
Temporal Trends and Regional Variability of 2001-2002
DENV-3 Epidemic in Havana City: Did Hurricane
Michelle Contribute to its Severity ?
Ying-Hen Hsieh, Hector de Arazoza, Rachid Lounes
To cite this version:
Ying-Hen Hsieh, Hector de Arazoza, Rachid Lounes. Temporal Trends and Regional Variability of 2001-2002 DENV-3 Epidemic in Havana City: Did Hurricane Michelle Contribute to its Sever-ity ?. Tropical Medicine & International Health, John Wiley & Sons Ltd, 2013, 18 (7), pp.830-838. �10.1111/tmi.12105�. �hal-00705264v2�
Temporal Trends and Regional Variability of 2001-2002
Multi-wave DENV-3 Epidemic in Havana City: Did
Hurricane Michelle Contribute to its Severity?
Ying-Hen Hsieh1, Hector de Arazoza2,3, Rachid Lounes3
1Department of Public Health and Center for Infectious Disease Education and
Research, China Medical University, Taichung, Taiwan 40402
2Department of Mathematics, University of Havana, San Lazaro y L, Ciudad de La
Habana, Cuba,
3Laboratoire MAP5, UMR-CNRS 8145, Université Paris Descartes, 75270 Paris Cedex
06, FRANCE
Running Title: 2001-2002 DENV-3 outbreak in Havana
Word count: 31913494 (excluding the tables)
Correspondence to: Department of Public Health and Center for Infectious Disease Education and Research, China Medical University Taichung, 91 Hsueh-Shih Road, Taichung, Taiwan 404. Tel and fax: 886-4-22075913, email:[email protected]
Abstract
Objectives
To investigate the temporal and regional variability of the 2001-2002 d engue outbreak in Havana City, when 12,889 cases, mostly of DENV-3 type, were reported over a period of 7 months.
Methods
A simple mathematical model, the Richards model, is utilized to fit the weekly reported dengue case data by municipality, in order to quantify the transmissibility and temporal changes of the epidemic in each municipality via the basic reproduction number R0.
Results
Model fits indicate either a 2-wave or 3-wave outbreak in all municipalities. Estimates for R0 vary greatly, from 1.97 (95% CI: 1.94, 2.01), for Arroyo Naranjo to 61.06 (60.44, 61.68) for Boyeros.
Conclusions
Wide regional variability in our estimates of R0 for dengue is consistent with studies from various regions of the world, most likely due to heterogeneity in community structure, geographical locations, and social networking. The epidemic had initially started to ease around late October (e-week 43). However, infections spread once again after e-week 45, perhaps due to Hurricane Michelle, one of the most destructive and wettest tropical cyclones ever in Cuba that may have contributed to a protracted and more severe epidemic. For all municipalities with 3 waves, model fit indicates a new third wave occurred after Christmas/New Year, mostly likely attributable to a decrease in reporting during the holidays. Our results illustrate the potential impact of
climatological events on disease spread, further highlighting the need to be well-prepared for potentially worsening disease spread in the aftermath of natural disasters such as hurricanes/typhoons.
Keywords: Dengue; Cuba; DENV-3; mathematical model; basic reproduction number;
Introduction
Dengue virus infection in humans causes a spectrum of illness ranging from asymptomatic or mild febrile illness to severe and fatal hemorrhagic disease, namely Dengue fever (DF) and dengue hemorrhagic fever/dengue shock syndrome (DHF/DSS), for which secondary infection is considered the main individual risk factor (Nimmannitya et al. 1987; Halstead SB, 1988; Guzman & Kouri 2002). Infection with any of the four known serotypes of Dengue (1, 2, 3, and DENV-4) causes a similar clinical presentation that may vary in severity, depending on the strain and serotype of the infecting virus and the immune status, age, and genetic background of the human host, and induces life-long protective immunity to the infecting serotype, accompanied by short-term cross-protective immunity against the other viruses (Sabin 1952). Due to its wide spread and multiple serotypes, the disease, even in absence of fatal forms, produces significant economic and social costs in terms of absenteeism, immobilization, debilitation, medication, and death).
Environmental factors such as climate and geography have been known to affect the spatio-temporal patterns of dengue transmission (Johnson et al. 2009). For example, climatological factors affect the development, maturation, and survival of the vector Ae. aegypti (see, e.g., Jetten & Focks 1997 or Mourya et al. 2004) as well as its role in the human-vector dengue transmission cycle. In particualr, the extrinsic incubation period (or the time for infected female mosquitoes to become infectious after biting an infectious individual) has been shown to be influenced by ambient temperature (Keating 2001, Chowell & Sanchez 2006, Chowell et al. 2011). Moreover, factors such as high spatial heterogeneity levels in vector or host density plays an important role in determining the risk of dengue outbreaks and the reproduction number. Interestingly, a recent study (Chowell et al. 2011) shows significant heterogeneity in seasonality and
timing of dengue epidemics at the province level across Peru, suggesting that dengue is frequently imported into coastal regions through infective sparks from endemic regions of neighboring endemic countries, where propitious environmental conditions promote year-round mosquito breeding sites. This pattern was found to be associated with climatologic conditions as well as connectivity among geographic regions.
In Cuba, Dengue viruses are transmitted by the Aedes aegypti mosquito. The mosquito is characterized by its biting pattern, which consists of multiple blood meals during each egg-laying cycle, and its ability to grow in water reservoir during of its immature stages (i.e., egg, larva and pupa). These features make it an ideal vector for dengue virus transmission, especially in large urban areas where the human population density is high with abundant artificial containers in where the aquatic stages of Aedes aegypti flourish (Hammond et al. 2007). Aedes aegypti is infected by sucking infected human blood, while humans are infected with dengue viruses when bitten by an infective mosquito. The global spread of dengue can be directly attributable to the proliferation and adaptation of mosquitoes.
Currently the only way to control and reduce dengue transmission is to implement alternative strategies such as: (i) reduction of vector populations in both the adult (by fumigation and/or by other chemical/biological treatments, e.g., Thomé et al. 2010) and the immature stages (by eliminating breeding sites); (ii) early detection of infected humans to prevent the virus transmission to susceptible mosquitoes. In Cuba the rainy season (lasting 6 months from May to October) produces a proliferation of mosquito populations which includes Aedes aegypti. This persistent presence of Aedes aegypti, together with the increased international arrivals from dengue-endemic countries in recent years, has led to several outbreaks including a major 2001 outbreak in Havana City (Pelaez et al. 2004).
In the Caribbean region the first major outbreaks of dengue fever (with a significant number of severe cases) occurred in Cuba in 1977 (with DENV-1) and in 1981 (with DENV-2). Both epidemics affected the entire country, producing more than 500,000 and 300,000 dengue cases, respectively. In 2000, a minor outbreak of dengue was detected in Havana City with 138 cases of DF, when DENV-3 and DENV-4 viruses were isolated. In 2001, dengue transmission was detected in Havana City where 12,889 cases, mostly of DENV-3 type, were reported with 78 DHF cases and 3 deaths due to Dengue (Pelaez et al. 2004).
To ascertain how did this epidemic come to pass, we will employ a simple mathematical model, the Richards model, to investigate the temporal progression of the epidemic in various municipalities in Havana City and to quantify the transmissibility of the epidemic via the basic reproduction number R0.
Methods and Materials
Data
The 2001-2002 dengue outbreak case data by reporting week (epidemiological week or e-week) for each of the 15 municipalities in Havana City are obtained from the Pedro Koury Tropical Medicine Institute (IPK) in Havana, Cuba, which spans from May 30, 2001 when the first case was reported in Playa (Figure 1), to the last reported case on February 27, 2002. Subsequently the data spans 40 weeks, from e-week 22 of 2001 (May 27 to June 2, 2001) to e-week 9 of 2002 (February 24-March 2, 2002).
During the 2001-2002 Dengue III epidemic in Havana all suspected Dengue fever cases were tested. Dengue infection was confirmed in 17.86% of them through serological studies. The initial test was carried out at the Provincial Epidemiological Center of Havana using the ultramicro-enzyme-linked inmunosorbent assay (ELISA) for Dengue IgM detection. A second seoconversion test is carried out 2-3 weeks after
illness onset to confirm seroconversion, at the National Reference senter for Dengue in Cuba at the Tropical Medicine Institute "Pedro Kouri". For more information see Pelaez
et al. (2004).
The Richards model
We fit the data to the Richards model (Richards 1959): where C(t) is the cumulative number of cases reported at time t (in weeks). Here the prime “” denotes the rate of change with respect to time. The model parameter K is the maximum case number (or final outbreak size) over a single phase of outbreak, r is the per capita growth rate of the infected population, and a is the exponent of deviation. The solution of the Richards model is , where ti is the turning point of the epidemic (or the inflection point of the cumulative case curve), , and ln denotes the natural logarithm. Using the Richard model, we can directly fit empirical data from a cumulative epidemic curve to obtain estimates of epidemiological meaningful parameters, including the growth rate r.
In such a model formulation, the basic reproduction number R0 is given by the formula , where T is the disease generation time defined as the average time interval from infection of an individual to infection of his or her contacts. To take into account of the extrinsic and intrinsic incubation periods as well as the duration of viremia, we use an estimated generation time of T=24 days with a range of 16-34 days (see Hsieh & Chen 2009, for detailed explanation). Expression of dengue reproduction number that more explicitly connect the intrinsic growth rate and the epidemiology of host/vector can also be found in, e.g., Favier et al. (2006). It has been shown mathematically that, given the growth rate r, the equation provides the upper bound of the basic reproduction number regardless of the distribution of the generation interval used (Wallinga & Lipsitch 2007). Additional technical details regarding the Richards model can be found
in (Hsieh et al. (2004); Hsieh & Cheng (2006); or Hsieh (2008).
The turning point or inflection point ti of the cumulative case data, defined as the time when the rate of case accumulation changes from increasing to decreasing (or vice versa) can be easily pinpointed as the point where the rate of change transitions from positive to negative; i.e., the moment at which the trajectory begins to decline. For epidemics with two or more phases, a variation of the S-shaped Richards model has been proposed (Hsieh & Cheng 2006). This multi-staged Richards model distinguishes between two types of turning points: the initial S-Shaped cumulative case curve which signifies the first turning point that ends initial exponential growth, or simply the time where peak incidence of a wave of cases occurs; and a second type of turning point in the cumulative epidemic curve where the growth rate of the number of cumulative cases begins to increase again, signifying the beginning of the next wave. This variant of Richards model provides a systematic method of determining whether an outbreak is single- or multi-phase in nature, and can be used to distinguish true turning points from peaks and valleys resulting from random variability in case counts. Readers are also referred to (Hsieh & Ma (2009); and Hsieh & Chen (2009) for its applications to dengue, to (Hsieh (2010; Hsieh et al. (2010),; Hsieh et al. (2011a),; Hsieh et al. (2011b) for applications to 2009 H1N1, and to (Wang et al., (2012in press) for the connection between the Richards model and the traditional SIR compartmental model. Model parameter estimates based on the explicit solution of the Richards model can be obtained easily and efficiently using any standard software with a least-squares approximation tool, such as SAS or Matlab.
Results
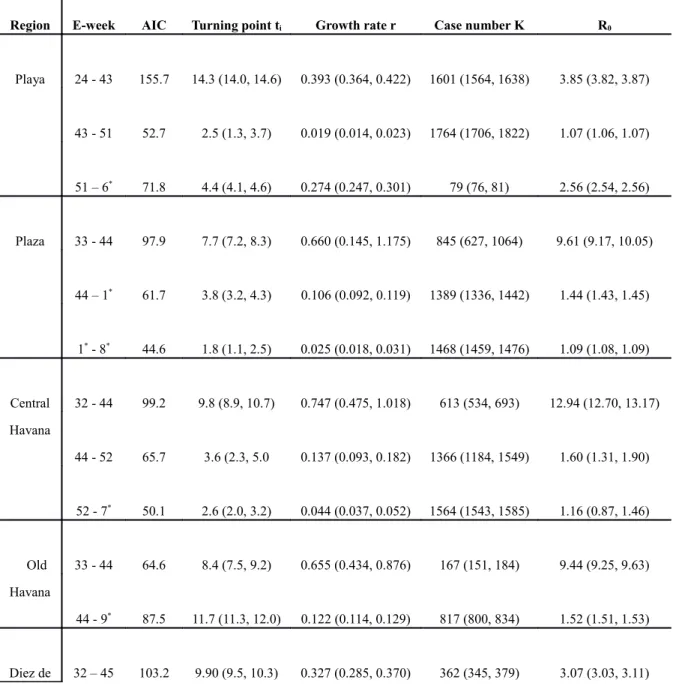
City, with estimates for ti, r, K, R0 and their respective 95% confidence intervals (CI), are listed in Table 1. The Akaike Information Criterion (AIC, Akaike 2974)) values are also given as a measure of the respective goodness of fit for each wave of the local outbreak. The municipality of Cotorro had only 34 cases reported very late after e-week 40 (in September) and scattered over the next 20 weeks, and hence cannot be fitted to the Richards model. We also fitted the combined total case data of all 15 municipalities in Havana City including Cotorro (see Table 1b), for the purpose of comparison. Note that the week in which the true turning point for each wave occurred is ti weeks (3rd column in the tables) after the first week of the wave, rounding off to the next integer week. For example, the turning points for the three waves in Playa occurred in e-week 39 (24+14.3 in the first row of Table 1a), e-week 46 (43+2.46), and e-week 4 of 2002 (51+4.38), respectively.
The model fits for the most severely affected municipalities, namely Playa (with the first reported case of this epidemic), Plaza, Central Havana, and Old Havana, as well as for all 15 municipalities of Havana City, are given in Figure 2.
All model fits indicate a 2-wave or 3-wave outbreak for each of the 14 municipalities as well as for all of Havana City. Outbreaks in Old Havana, Regla, and Guanabacoa only are 2-wave, while all other municipalities exhibit 3-wave outbreaks. For the purpose of comparing regional heterogeneity, we also provide timeline graphs of the 14 fitted municipalities in Figure 3.
Table 1a. Estimated multi-wave Richards model parameters values with 95% confidence intervals (in parenthesis) for Playa, Plaza, Central Havana, Old Havana, Diez de Octubre, Cerro, Marianao, and Lisa. Note that the week in which the true turning point for each wave occurred is ti weeks after the first week of the wave. Akaike Information Criterion (AIC) values are given
for the respective goodness of fit.
Region E-week AIC Turning point ti Growth rate r Case number K R0
Playa 24 - 43 155.7 14.3 (14.0, 14.6) 0.393 (0.364, 0.422) 1601 (1564, 1638) 3.85 (3.82, 3.87) 43 - 51 52.7 2.5 (1.3, 3.7) 0.019 (0.014, 0.023) 1764 (1706, 1822) 1.07 (1.06, 1.07) 51 – 6* 71.8 4.4 (4.1, 4.6) 0.274 (0.247, 0.301) 79 (76, 81) 2.56 (2.54, 2.56) Plaza 33 - 44 97.9 7.7 (7.2, 8.3) 0.660 (0.145, 1.175) 845 (627, 1064) 9.61 (9.17, 10.05) 44 – 1* 61.7 3.8 (3.2, 4.3) 0.106 (0.092, 0.119) 1389 (1336, 1442) 1.44 (1.43, 1.45) 1* - 8* 44.6 1.8 (1.1, 2.5) 0.025 (0.018, 0.031) 1468 (1459, 1476) 1.09 (1.08, 1.09) Central Havana 32 - 44 99.2 9.8 (8.9, 10.7) 0.747 (0.475, 1.018) 613 (534, 693) 12.94 (12.70, 13.17) 44 - 52 65.7 3.6 (2.3, 5.0 0.137 (0.093, 0.182) 1366 (1184, 1549) 1.60 (1.31, 1.90) 52 - 7* 50.1 2.6 (2.0, 3.2) 0.044 (0.037, 0.052) 1564 (1543, 1585) 1.16 (0.87, 1.46) Old Havana 33 - 44 64.6 8.4 (7.5, 9.2) 0.655 (0.434, 0.876) 167 (151, 184) 9.44 (9.25, 9.63) 44 - 9* 87.5 11.7 (11.3, 12.0) 0.122 (0.114, 0.129) 817 (800, 834) 1.52 (1.51, 1.53) Diez de 32 – 45 103.2 9.90 (9.5, 10.3) 0.327 (0.285, 0.370) 362 (345, 379) 3.07 (3.03, 3.11)
Octubre 45 – 52 61.5 4.6 (4.1, 5.1) 0.157 (0.133, 0.180) 848 (806, 891) 1.71 (1.69, 1.73) 52 - 7* 29.9 2.8 (0.9, 4.7) 0.636 (0.228, 1.043) 119 (109, 129) 8.84 (8.56, 9.13) Cerro 38 - 43 5.4 4.1 (4.0, 4.1) 0.483 (0.470, 0.496) 375 (369, 381) 5.23 (5.22, 5.24) 43 - 51 75.1 2.6 (0.3, 4.9) 0.195 (0.056, 0.335) 850 (763, 937) 1.95 (1.85, 2.06) 51 - 8* 78.1 5.9 (4.7, 7.1) 0.030 (0.023, 0.037) 1009 (985, 1033) 1.11 (1.10, 1.11) Mariana o 29 - 44 86.1 12.7 (12.6, 12.8) 0.581 (0.556, 0.605 627 (618, 636) 7.32 (7.30, 7.34) 44 - 1* 61.3 1.7 (0.5, 2.9) 0.122 (0.088, 0.156) 1062 (1037, 1088) 1.52 (1.49, 1.55) 1* - 6* 33.0 3.4 (2.4, 4.4) 0.028 (0.018, 0.038) 1147 (1130, 1165) 1.10 (1.10, 1.11) Lisa 34 - 44 39.8 7.7 (7.5, 7.9) 0.760 (0.674, 0.847) 249 (241, 257) 13.56 (13.48, 13.63) 44 - 1* 58.1 4.4 (3.6, 5.2) 0.081 (0.066, 0.097) 426 (406, 445) 1.32 (1.31, 1.33) 1* - 7* 26.6 1.9 (1.1, 2.8) 0.034 (0.023, 0.044) 478 (472, 483) 1.12 (1.12, 1.13) * denotes e-week in 2002.
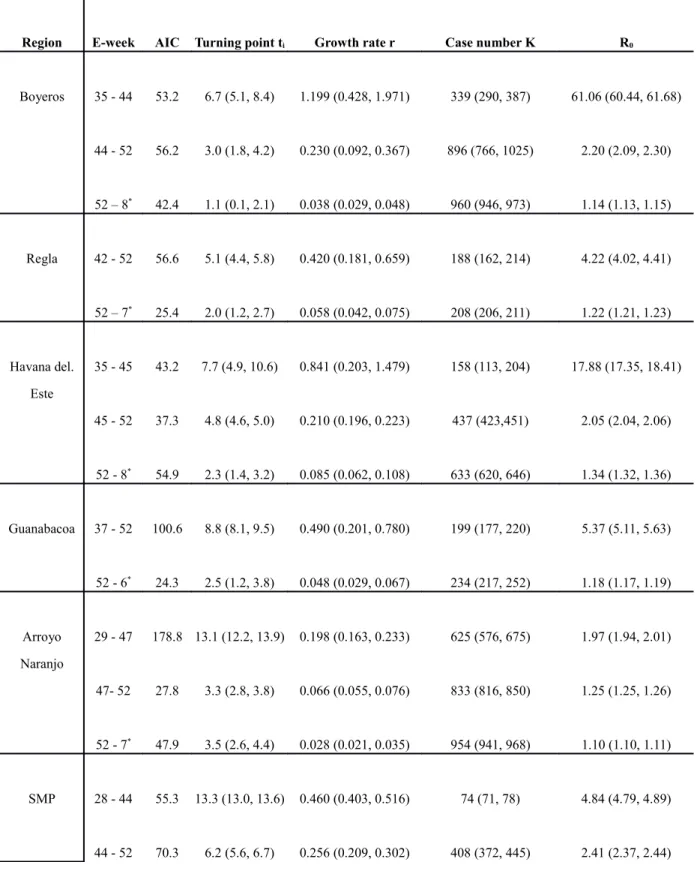
Table 1b. Estimated multi-wave Richards model parameters values with 95% confidence intervals (in parenthesis) for Boyeros, Regla, Habana de Este, Guanabacoa, Arroyo Naranjo, and SMP. Note that the week in which the true turning point for each wave occurred is ti weeks after the first week of the wave. Akaike Information Criterion (AIC) values are given for the respective goodness of fit.
Region E-week AIC Turning point ti Growth rate r Case number K R0
Boyeros 35 - 44 53.2 6.7 (5.1, 8.4) 1.199 (0.428, 1.971) 339 (290, 387) 61.06 (60.44, 61.68) 44 - 52 56.2 3.0 (1.8, 4.2) 0.230 (0.092, 0.367) 896 (766, 1025) 2.20 (2.09, 2.30) 52 – 8* 42.4 1.1 (0.1, 2.1) 0.038 (0.029, 0.048) 960 (946, 973) 1.14 (1.13, 1.15) Regla 42 - 52 56.6 5.1 (4.4, 5.8) 0.420 (0.181, 0.659) 188 (162, 214) 4.22 (4.02, 4.41) 52 – 7* 25.4 2.0 (1.2, 2.7) 0.058 (0.042, 0.075) 208 (206, 211) 1.22 (1.21, 1.23) Havana del. Este 35 - 45 43.2 7.7 (4.9, 10.6) 0.841 (0.203, 1.479) 158 (113, 204) 17.88 (17.35, 18.41) 45 - 52 37.3 4.8 (4.6, 5.0) 0.210 (0.196, 0.223) 437 (423,451) 2.05 (2.04, 2.06) 52 - 8* 54.9 2.3 (1.4, 3.2) 0.085 (0.062, 0.108) 633 (620, 646) 1.34 (1.32, 1.36) Guanabacoa 37 - 52 100.6 8.8 (8.1, 9.5) 0.490 (0.201, 0.780) 199 (177, 220) 5.37 (5.11, 5.63) 52 - 6* 24.3 2.5 (1.2, 3.8) 0.048 (0.029, 0.067) 234 (217, 252) 1.18 (1.17, 1.19) Arroyo Naranjo 29 - 47 178.8 13.1 (12.2, 13.9) 0.198 (0.163, 0.233) 625 (576, 675) 1.97 (1.94, 2.01) 47- 52 27.8 3.3 (2.8, 3.8) 0.066 (0.055, 0.076) 833 (816, 850) 1.25 (1.25, 1.26) 52 - 7* 47.9 3.5 (2.6, 4.4) 0.028 (0.021, 0.035) 954 (941, 968) 1.10 (1.10, 1.11) SMP 28 - 44 55.3 13.3 (13.0, 13.6) 0.460 (0.403, 0.516) 74 (71, 78) 4.84 (4.79, 4.89) 44 - 52 70.3 6.2 (5.6, 6.7) 0.256 (0.209, 0.302) 408 (372, 445) 2.41 (2.37, 2.44)
52 - 8* 59.8 4.1 (3.5, 4.7) 0.082 (0.068, 0.097) 616 (603, 629) 1.33 (1.32, 1.34) Havana City Total 24 - 44 216.0 17.5 (17.4, 17.7) 0.316 (0.305, 0.327) 5933 (5771, 6095) 2.96 (2.95, 2.97) 44 - 52 94.2 4.5 (4.1, 4.8) 0.095 (0.087, 0.103) 11003 (10578, 11418) 1.39 (1.38, 1.39) 52 - 9* 101.2 3.0 (2.7, 3.4) 0.037 (0.034, 0.041) 12879 (12820, 12938) 1.14 (1.13, 1.14) * denotes e-week in 2002.
The model fits for the most severely affected municipalities, namely Playa (with the first reported case of this epidemic), Plaza, Central Havana, and Old Havana, as well as for all 15 municipalities of Havana City, are given in Figure 2.
All model fits indicate a 2-wave or 3-wave outbreak for each of the 14 municipalities as well as for all of Havana City. Outbreaks in Old Havana, Regla, and Guanabacoa only are 2-wave, while all other municipalities exhibit 3-wave outbreaks. For the purpose of comparing regional heterogeneity, we also provide timeline graphs of the 14 fitted municipalities in Figure 3.
Conclusions and Discussion
Previous large dengue epidemics in Cuba were associated with DENV-1 (in 1977) and DENV-2 (in 1981). More recently, two smaller dengue outbreaks were reported in 1997 (DENV-2) and September 2000 (DENV-3 and DENV-4) (Pelaez et al. 2004). Subsequently, there was very little pre-existing immunity among the population in Havana for this 2001-2002 DENV-3 epidemic, although some cases of DHF/DSS might have occurred in persons infected with DENV-3 in a background of immunity to DENV-1 and DENV-2 from either the 1981 epidemic or dengue epidemics during or before the 1940s (Alvarez et al. 2006). Table 1 indicate that the estimates for R0 in the
initial wave vary from 1.97 (95% CI: 1.94, 2.01) for Arroyo Naranjo to 17.88 (17.35, 18.41) for Havana del. Este. Only Boyeros had an unusually high disease transmission potential of R0=61.06 (60.44, 61.68) in the initial wave starting comparatively late in
e-week 35 (Figure 3b), possibly caused by multiple imported cases from neighboring municipalities with earlier outbreaks which has been shown to be able to impact the estimation of basic reproduction number (Nishiura & Roberts 2010). The wide regional variability exhibited in our estimates is consistent with other reported values of R0 for
dengue in literature in various regions of the world using high resolution spatial and temporal data (see, e.g., Favier et al. 2006; Luz et al. 2003; Favier et al. 2006; Chowell
et al. 2007; Chowell et al. 2008, or Table 2 in Hsieh & Chen 2009), most likely due to
heterogeneity in community structure, geographical locations, interevention measures, as well as in social networking. Interestingly, a study (Chowell et al. 2008) using provincial data were able to show a hierarchy of transmission events from large to small population areas during the large 2000–2001 dengue epidemic in Peru. We also note that although variability across municipalities is probably well represented in estimates for R0, the accuracy of the actual R0 levels may be affected by the lack of explicit dependence of climatic conditions on dengue transmission dynamics in our modeling.
Moreover, there is also a clear regional heterogeneity in the temporal trend, where Old Havana, Regla, and Guanabacoa are 2-waved while the other municipalities are 3-waved. In particular, Central Havana, which is closely nearby to Old Havana but has a different model fit with one additional (third) wave occurring at the turn of the calendar year (e-week 52).
Except for Playa (which had the earliest outbreak and a turning point as early as e-week 39), Regla, and Guanabacoa (regions, along with Cotorro, having late outbreaks starting as late as in September), all other municipalities as well as all of Havana City
had a first turning point (peak incidence) during e-weeks 41-43 that indicates a downturn of cases, regardless of whether the data fit exhibits a 2-wave or 3-wave outbreak. Moreover, with the exception of Arroyo Naranjo, Regla, and Guanabacoa, all other municipalities as well as all of Havana City has a turning point of second type around e-weeks 43-45 that signals an increase in case number and the beginning of a new wave of cases, regardless whether it has a 2-wave or 3-wave outbreak. Interestingly, all 14 municipalities had a turning point (peak incidence) during e-weeks 46-51, regardless of the number of waves or the timing of initial outbreak. Finally, for all 11 municipalities with 3 waves, the third wave started around e-week 51 to e-week 1 of 2002. The last turning point (peak incidence), or a downturn toward the end of the outbreak, came during e-weeks 2-5 of 2002 for all municipalities except Old Havana which had a 2-wave outbreak.
Even within Havana city, geographical heterogeneity played a significant role in temporal trends as well as transmission potential of the infected individuals. Playa, Plaza and Central/Old Havana have more work offices where people commute to daily, and hence are important in driving the epidemic (Figure 3a), while the municipalities of Guanabacoa, Regla and Cotorro all contain some less populated areas and therefore have very late and very minor outbreaks.
More significantly and intriguing is the underlying cause of this multi-wave epidemic. For the first wave, we note that Hurricane Michelle, the most destructive hurricane in the history of Cuba based on its actual damage (Pielke et al. 2003), struck Cuba on November 4, 2001, the first day of week 24 in our study. Landing on the coast of western and southern Cuba, Michelle was one of the wettest tropical cyclones ever in Cuba, produced 4–5 foot waves along with a heavy storm surge. Rainfall amounting up to 754 mm was recorded across the island ( Instituto Nacional de Recursos Hidráulicos
2003 ) . Previous studies (e.g., Hsieh & Chen 2009; Chowell & Sanchez 2006; Wu et al.
2007) have proposed that extreme weather conditions, such as typhoon or hurricane which brings substantial amount of precipitation, can be shown to be significantly correlated to the occurrence of a wave of reported dengue cases with a lag of several weeks. Typically, a typhoon/hurricane first brings a sudden drop in temperature causing mosquito inactivity and decreased biting/infection, the ensuing heavy rainfall then leads to increased breading reservoir for the larvae to proliferate. It is hence conceivable that Hurricane Michelle had contributed to, if not actually causing, the new wave of cases in these municipalities after e-week 45. In other words, the dengue epidemic in Havana had started to ease initially around e-weeks 41-43 (first turning point/peak incidence), but spread once again after e-week 45 after Hurricane Michelle, causing a more severe and longer-lasting epidemic. We note that, since the case data is by reporting week, there is a delay of around one week from actual infections to reporting, mainly due to intrinsic dengue incubation period of 4-7 days (see, e.g., Nishiura H & Halstead 2007).
Our result illustrates the potential impact of climatological events on disease spread. It further highlights the need for health community to be aware and better prepared, with programs such as preemptive spraying and elimination of reservoirs for larvae, for a potentially worsening disease spread in the aftermath of natural disasters such as hurricanes and typhoons.
After a downturn (peak incidence) around e-weeks 46-51, a new turning point (of second type) for start of a third wave occurred after e-weeks 51 for all 11 municipalities with 3-wave fit (not including Old Havana, Regla, and Guanabacoa). However, we note that Christmas and New Year happened to fall on, respectively, e-weeks 52 and e-week 1 of 2002. The new wave of reported cases is likely attributable to a decrease in reporting partly due to reluctance on the part of some ill persons for hospital visits
during the holidays, and a subsequent surge in cases after the holidays. Hence the cause for this third wave is human behavior, rather than anything relating to disease transmission or other environmental or social factors.
During the 1981 dengue epidemic, the Cuban health authorities started a National Program for Eradication of Aedes aegypti which has continued to the present. The campaign was based on the principles of dengue control established by the Pan American Health Organization (PAHO) Guidelines (Pan American Health Organization 1994) with the involvement of the whole community (governmental and political bodies at all levels, householders, community organizations, etc.), where thousands of workers were mobilized with the task of periodic inspection of housing, detection and elimination of breeding points for the vector, chemical control of mosquitoes, and an educational campaign. These activities were carried out regularly and reinforced whenever cases of dengue are detected, as workers clean up empty places looking for larvae and spray all homes within 500-meter radius of the suspected case. The 2001 epidemic was no exception (Pelaez et al. 2004), which may have contributed to the 2001 epidemic being less severe than the previous epidemics in 1977 and 1981. Community-wide cross pre-immunity from earlier epidemics may also have played a role, which is however difficult to gauge without sizable serologic dataset.
A Further limitation of this work is that the Richards model does not explicit incorporate vector biology or the effect of temperature on extrinsic incubation period or vector mortality rate, which could impact our results. However, to appropriately consider these biological aspects of the dengue transmission requires a much more complex vector-host model that incorporates environmental factors such as seasonality as well as detailed and high quality vector and human data, and therefore is beyond the scope of the current work.
Acknowledgments
YHH is supported by the National Science Council of Taiwan (grants 100-2314-B-039 -028-MY3 and 100-2115-M-039-002). This work was carried out during visits to the University of Paris Descartes by YHH and H de A. The authors received support from the French ”Agence National pour la Recherche” project ”Viroscopy”. H de A also received support from the Spanish AECID, from their project PCI D/023835/09. We would like to thank Dr. Gustavo Kouri, who passed away recently, and his colleagues at the Pedro Kouri Tropical Medicine Institute for access to the dengue surveillance data used for this study. The authors also would like to thank the reviewers for constructive comments which greatly improved this paper.
References
1. Akaike H (1974) A new look at the statistical model identification. IEEE
Transactions on Automatic Control 19(6), 716-723.
2. Alvarez M, Rodriguez-Roche R, Bernardo L et al. (2006) Dengue hemorrhagic fever caused by sequential dengue 1-3 virus infections over a long time interval: Havana epidemic, 2001-2002. Am J Trop Med Hyg. 75, 1113-1117.
3. Chowell G & Sanchez F (2006) Climate-based descriptive model of dengue fever: the 2002 epidemic in Colima, Mexico. Journal of Environmental Health 68, 40-44. 4. Chowell G, et al. (2007) Estimation of the reproduction number of dengue fever
from spatial epidemic data. Mathematical Biosciences 208, 571–89.
5. Chowell G, et al. (2008) Spatial and temporal dynamics of dengue fever in Peru: 1994–2006. Epidemiology and Infection 136(12), 1667-1677
6. Chowell G, Cazelles B, Broutin H et al . (2011) The influence of geographic and climate factors on the timing of dengue epidemics in Perú, 1994-2008. BMC
Infectious Diseases 11, 164.
7. Favier C, Degallier N & Rosa-Freitas MG (2006) Early determination of the reproductive number for vector-borne diseases: the case of dengue in Brazil.
Tropical Medicine and International Health 11, 332-340.
8. Guzman MG & Kouri G (2002) Dengue: an update. Lancet Infect Dis 2, 33-42.
9. Halstead SB (1988) Pathogenesis of dengue: challenges to molecular biology.
Science 239, 476–481.
10. Hammond SN, Gordon AL, Lugo E et al. (2007) Characterization of Aedes Aegypti (Diptera: Culicidae) Production Sites in Urban Nicaragua. J Med Entomol.
44(5), 851-860.
11. Hsieh YH (2008) Richards model: a simple procedure for real-time prediction of outbreak severity. To appear in “Proceedings of Workshop of China-Canada Joint
Program on Modeling of Infectious Diseases”, Xian, China, 2006. World
Scientific, Singapore.
12. Hsieh YH (2010) Pandemic Influenza A (H1N1) during Winter Influenza Season in the Southern Hemisphere. Influenza and other Respiratory Viruses 4(4), 187-197. 13. Hsieh YH & Chen CWS (2009) Turning Points, reproduction number, and Impact
of Climatological events on Multi-Wave Dengue Outbreaks. Trop Med Internat
Health 16(4), 1-11.
14. Hsieh YH, Cheng KF, Chao DY et al. (2011ab) Transmissibility and Temporal Changes of 2009 pH1N1 Pandemic during Summer and Fall/Winter Waves. BMC
Inf Diseases 11, 332.
outbreaks. Emerging Infectious Diseases 12(1), 122-127.
16. Hsieh YH, Fisman D & Wu J (2010) Epidemic Modeling in Real Time: 2009 Novel A (H1N1) Influenza Outbreak in Canada. BMC Research Notes 3, 283. 17. Hsieh YH, Lee JY & Chang HL (2004) SARS epidemiology. Emerging Infectious
Diseases 10(6), 1165-1167.
18. Hsieh YH & Ma S (2009) Intervention Measures, Turning Point, and Reproduction Number for Dengue, Singapore, 2005. Am J Trop Med Hyg. 80, 66-71.
19. Hsieh YH, Ma S, Valasco-Hernandez J, Lee V & Yen LW (2011ba) 2009
Influenza A (H1N1) in Mexico: Initial Outbreak, Turning Points, and Reproduction Number. PLoS ONE 6(8), e23853.
20. Instituto Nacional de Recursos Hidráulicos (2003) Lluvias intensas observadas y grandes inundaciones reportadas, Instituto Nacional de Recursos Hidráulicos, Havana, Cuba (in Spanish).
21. Jetten TH & Focks DA (1997) Potential changes in the distribution of dengue transmission under climate warming. Am J Trop Med Hyg. 57(3), 285-297.
22. Johansson MA, Dominici F & Glass GE (2009) Local and global effects of climate on dengue transmission in Puerto Rico. PLoS Negl Trop Dis 3(2), e382.
23. Keating J (2001) An investigation into the cyclical incidence of dengue fever. Soc
Sci Med 53(12),1587-1597.
24. Luz PM, Codec¸o CT, Massad E & Struchiner CJ (2003) Uncertainties regarding dengue modeling in Rio de Janeiro, Brazil. Memórias do Instituto Oswaldo Cruz
98(7), 871-878.
25. Mourya DT, Yadav P & Mishra AC (2004) Effect of temperature stress on immature stages and susceptibility of Aedes aegypti mosquitoes to chikungunya
virus. Am J Trop Med Hyg. 70(4), 346-350.
26. Nimmannitya S, Thisyakorn U, Hemsrichart V (1987) Dengue haemorrhagic fever with unusual manifestations. Southeast Asian J Trop Med Public Health 18, 398-406.
27. Nishiura H & Halstead SB (2007) Natural history of dengue virus (DENV)-1 and DENV-4 infections: Reanalysis of classical studies. J Infectious Diseases 195(7), 1007-1013.
28. Nishiura H & Roberts MG (2010) Estimation of the reproduction number for 2009 pandemic influenza A(H1N1) in the presence of imported cases. Eurosurveillance
15(29), pii=19622 (short note).
29. Pan American Health Organization (1994) Dengue and Dengue Hemorrhagic Fever in the Americas: Guidelines for Prevention and Control. 548 p.
30. Pelaez O, Guzman MG, Kouri G et al. (2004) Dengue 3 epidemic, Havana, 2001.
Emerg Infect Dis. 10, 719-722.
31. Pielke RA, Rubiera J, Landsea C, Fernández ML & Klein R (2003) Hurricane
Vulnerability in Latin America and the Caribbean: Normalized Damage and Loss Potentials. Nat Hazards Rev 4(3), 101-114.
32. Richards FJ (1959) A flexible growth function for empirical use. J of Experi
Botany. 10, 290-300.
33. Sabin AB (1952) Research on dengue during World War II. Am J Trop Med Hyg 1, 30-50.
34. Thomé RCA, Yang HM & Esteva L (2010) Optimal control of Aedes aegypti mosquitoes by the sterile insect technique and insecticide. Mathematical
35. Wallinga J & Lipsitch M (2007) How generation intervals shape the relationship between growth rates and reproductive numbers. Proc Biol Sci. 274(1609), 599-604.
36. Wang XS, Wu J & Yang Y. (2012) Richards Model Revisited: Validation by and Application to Infection Dynamics. J of Theoret Biol, in press313, 12–19.
37. Wu PC, Guo HR, Lung SC, Lin CY & Su HJ (2007) Weather as an effective predictor for occurrence of dengue fever in Taiwan. Acta Tropica 103(1), 50-57.
Figure Legends
Figure 1. Geographical map of 15 municipalities of Havana City with colors signifying temporal spread of dengue. Color red denotes Playa with outbreak starting before e-week 24; yellow denotes municipalities with outbreak starting between e-weeks 28-35; blue denotes municipalities with outbreak starting after e-week 37; green denotes Cotorro with a very minor outbreak (34 cases) starting on e-week 40.
Figure 2. Richards model fit for 2001 dengue outbreak in (2a) Playa, (2b) Plaza, (2c) Central Havana, (2d) Old Havana, and (2e) all of Havana City.
Figure 3. Timelines for 2001 dengue outbreak (with turning points in green numerals) in: (3a) Playa, Plaza, Central Havana, Old Havana; (3b) Diez de Octubre, Cerro, Marianao, Lisa, Boyeros, and Arroyo Naranjo; (3c) Regla, Havana de Este, Guanabacoa, SMP, and Havana City total.