HAL Id: hal-00093585
https://hal.archives-ouvertes.fr/hal-00093585
Submitted on 13 Sep 2006HAL is a multi-disciplinary open access archive for the deposit and dissemination of sci-entific research documents, whether they are pub-lished or not. The documents may come from teaching and research institutions in France or abroad, or from public or private research centers.
L’archive ouverte pluridisciplinaire HAL, est destinée au dépôt et à la diffusion de documents scientifiques de niveau recherche, publiés ou non, émanant des établissements d’enseignement et de recherche français ou étrangers, des laboratoires publics ou privés.
receptor involves DNA strand breaks.
Clémence Kress, Hélène Thomassin, Thierry Grange
To cite this version:
Clémence Kress, Hélène Thomassin, Thierry Grange. Active cytosine demethylation triggered by a nuclear receptor involves DNA strand breaks.. Proceedings of the National Academy of Sci-ences of the United States of America , National Academy of SciSci-ences, 2006, 103(30), pp.11112-7. �10.1073/pnas.0601793103�. �hal-00093585�
Active cytosine demethylation triggered by a nuclear
receptor involves DNA strand breaks
Clémence Kress
1, Hélène Thomassin
2, and Thierry Grange
$Institut Jacques Monod du CNRS
Universités Paris 6-7, Tour 43, 2 place Jussieu, 75251 Paris Cedex 05, France
Present addresses:
1MRC Human Genetics Unit, Western General Hospital, Crewe Road, Edinburgh EH4 2XU, UK 2Institut Pasteur, CNRS URA 2578, 25-28 rue du Docteur Roux, 75724 Paris Cedex 15, France
$ Corresponding author:
Phone: 33-1-44275707; Fax: 33-1-44275716; E-mail: [email protected]
Category: Biological Sciences/ Biochemistry
ABSTRACT
Cytosine methylation at CpGs contributes to the epigenetic maintenance of gene silencing. Dynamic reprogramming of DNA methylation patterns is believed to play a key role during development and differentiation in vertebrates. The mechanisms of DNA demethylation remain unclear and controversial. Here, we present the first detailed characterization of the demethylation of an endogenous gene in cultured cells. This is triggered in a regulatory region by a transcriptional activator, the glucocorticoid receptor. We show that DNA demethylation is an active process, occurring independently of DNA replication, and in a distributive manner without concerted demethylation of cytosines on both strands. We demonstrate that the DNA backbone is cleaved 3’ to the methyl-cytidine during demethylation, and suggest that a DNA repair pathway may therefore be involved in this demethylation.
INTRODUCTION
In vertebrates, DNA methylation occurs at the carbon-5 position of cytosine in the dinucleotide CpG. This DNA modification is involved in stabilizing the silent state of genes, either by locally preventing regulators from binding to their target or by recruiting specific proteins that favor the formation of silent chromatin (1, 2). DNA methylation participates in the control of several aspects of mammalian development, including X chromosome inactivation, parental imprinting and tissue-specific expression of genes (1, 2). Alterations in the methylation patterns of a number of genes are believed to be involved in both the initiation and the progression of cancer (3, 4).
The propagation of the methylated state through DNA replication is ensured by the action of maintenance and de novo DNA methyltransferases (DNMTs) (1, 5, 6). DNA methylation is subject to regulated reprogramming, in particular during development (1, 7, 8). Genome-wide waves of demethylation and remethylation are observed during gametogenesis and after fertilization. Localized DNA demethylation occurs later at specific genes, mostly when and where differentiation requires their activation. Although maintenance and de novo methylation are relatively well understood, the mechanisms of DNA demethylation are still unclear and controversial (1, 6, 9, 10). Two distinct mechanisms have been shown to act during the genome-wide demethylation occurring after fertilization in mouse : a passive mechanism resulting from the absence of maintenance methylation following replication is responsible for the demethylation of the maternal genome (11), whereas an active mechanism of unknown nature appears to be responsible for the demethylation of the paternal genome (7). The mechanisms of local gene-specific demethylation are also unclear (9). Passive and active demethylation, and a combination of the two, have all been proposed to occur in various local events analyzed (12-15).
Several attempts have been made to characterize the mechanism of DNA demethylation in vitro (reviewed in 9). Three classes of mechanisms have been proposed: direct removal of the methyl moiety from the base, excision of the methylated base, and excision of the methylated nucleotide. These pathways were supported by the identification of corresponding enzymatic activities (16), but these demethylases have failed to gain widespread acceptance due to the lack of reproducibility of the data and to the caveats in the experimental approaches used (17, 18). It is thus essential to firmly establish the nature of the biochemical pathways of MeCpG demethylation in live cells.
To study the mechanisms of local targeted DNA demethylation in living cells, we have investigated an enhancer-specific demethylation event at an endogenous gene, triggered by a transcriptional activator during development. We analyzed the demethylation occurring at a glucocorticoid-responsive unit (GRU) located 2.5 kb upstream from the transcription start site of the tyrosine aminotransferase (Tat) gene upon activation by the glucocorticoid receptor. This event takes place in the liver prior to birth and is involved in the memorization of the first stimulation of the gene by glucocorticoids (19). We demonstrate that demethylation of cytosines at this gene under physiological conditions results from an active mechanism that involves the creation of nicks in the DNA 3’ to the methylcytidine. This would be consistent with the involvement of a demethylase initiating a base or nucleotide excision repair.
RESULTS
Demethylation of the Tat gene enhancer does not require passage through S phase
DNA demethylation of the Tat enhancer can be triggered ex vivo by glucocorticoid treatment of either cultured e.d.15 fetal hepatocytes or a rat hepatoma cell line (H4IIEC3). The glucocorticoid receptor (GR) induces a chromatin-remodeling event over the 450 bp that encompass the four demethylated CpGs (20). This chromatin remodeling is rapid (15 min-1 hour), and reversible following hormone withdrawal. In contrast, DNA demethylation is slow and persists in non-stimulated cells (19).
Three of the four MeCpGs that are demethylated are clustered within a 15 bp region (Fig 1 A). The features of the demethylation kinetics of these MeCpGs are best seen by ligation mediated PCR (LM-PCR) analysis of genomic DNA treated with hydrazine and piperidine under conditions where DNA is cleaved only at unmethylated cytosines (Fig. 1 B). In hepatoma cells, the three Cs were all demethylated slowly. Demethylation was detectable after a few hours of stimulation and proceeded steadily over a 24-hour time period. The relatively slow kinetics of methylation loss seems consistent with a passive mechanism, but the different rates observed for neighboring Cs on the same strand (compare U2 with U1 and U3 on Fig. 1) suggests rather that demethylation is not the mere consequence of the absence of maintenance methylation following DNA replication. The slow kinetics might reflect a more subtle connection between DNA replication and demethylation or that a passage through a specific phase of the cell cycle is required for another reason..
Arresting cell growth at particular phases of the cell cycle by means of drugs and/or specific culture conditions was not a suitable procedure for the investigation of a putative role of DNA replication in DNA demethylation, since the activation of the Tat gene by GR was affected by these treatments, independently of the DNA methylation status of the GRU (data not shown and 21). In growing cells, however, the Tat gene can be activated throughout the cell cycle except during mitosis (21). Cells released from a treatment inducing a cell cycle arrest resume growth synchronously and regain their capacity to respond normally to glucocorticoids (data not shown). They are therefore well suited for the study of the demethylation mechanism of the Tat gene without any interference that might be caused by the continued presence of drugs. To determine rigorously whether passage through a specific phase of the cell cycle was important for demethylation, we compared asynchronously and synchronously growing cells. Since LM-PCR analysis of hydrazine-piperidine treated DNA cannot be used for precise
quantification, we used MethylQuant, a novel real-time PCR approach for quantifying the methylation status of a single cytosine (22), to measure the demethylation rate. Bisulfite-treated genomic DNA was PCR amplified, and the methylation status of a specific cytosine was quantified by real-time PCR by using a primer whose 3’-end discriminates for the methylation status of the cytosine of interest. Figure 2 shows the quantification of the methylation status of U3 that has an intermediate demethylation rate as shown in Figure 1. Within an asynchronous population not stimulated by glucocorticoids, the level of unmethylation for each position is 2-10%, due to the presence of unmethylated cytosines scattered amongst the Tat GRU molecules (vide infra). The proportion of unmethylated U3 cytosines did not change during the first 6 hours of glucocorticoid treatment but, after this lag and during the next 18 hours, it steadily increased to reach 85%. The rapid demethylation of 70% of the cytosines that occurred between 6 and 24 hours argues against a purely passive demethylation mechanism, since the cells had a doubling time of about 24 hours in the conditions used here, and thus underwent, at most, a single replication event during this period.
To find out if passive demethylation was nevertheless involved, in combination with active demethylation, i.e. whether there was active demethylation of the hemimethylated cytosines produced upon replication, we analyzed the possibility that demethylation occurs
preferentially during S phase. Cells were synchronized at the beginning of S phase by
aphidicolin treatment and then released from the block in the presence of glucocorticoids. A 6-hour time lag was again found before any demethylation was observed (Fig. 2), and consequently no detectable loss of methylation occurred during S phase, revealing that maintenance methylation occurred normally at this stage. Demethylation was detected at 8 hours when the majority of the cells had completed S phase and steadily proceeded thereafter for the next 16 hours, during G2 and the following G1, before most of the cells had initiated their next S phase. Thus, there was no evidence of a preferential demethylation of hemimethylated CpGs resulting from replication: demethylation began with an active mechanism on fully methylated CpGs. The rate of demethylation was similar in non-synchronized and non-synchronized cells, although the start of demethylation in the latter was slightly retarded, probably due to passage through mitosis. We also observed that it was possible for demethylation to occur during S phase, since the demethylation rate was not slowed down by the entry into S phase of cell populations synchronized and treated with glucocorticoid in G1 (data not shown). Quantitative analyses of demethylation at positions 1 and 2, which were demethylated faster or slower than U3 also revealed that demethylation can
occur outside the S phase (vide infra and data not shown). This conclusion is also supported by the observation that demethylation of these three Cs occurred in aphidicolin-treated cells even though the drug decreased the efficiency of both glucocorticoid induction and DNA demethylation (data not shown). In conclusion, demethylation appears to occur at all phases of the cell cycle permissive for Tat gene activation, with no preferential phase, and is accomplished mainly by an active mechanism.
Distributive nature of cytosine demethylation in the Tat GRU
We next assessed whether demethylation of the four MeCpGs occurred through a processive or a distributive mechanism in living cells, i.e., whether the various Cs of individual Tat gene molecules, in particular 2 Cs belonging to the same CpG, are demethylated in a concerted fashion. To this end, we used hairpin-bisulfite PCR which allows simultaneous analysis of the two strands of a DNA molecule (5). A hairpin linker, targeted and ligated to restriction-enzyme-cleaved genomic DNA, prevents the strand separation that occurs upon subsequent bisulfite conversion and PCR amplification. Single PCR molecules corresponding to the two linked strands are then cloned and sequenced. We applied this method to DNA samples prepared from synchronized cells undergoing demethylation, and focused on the cells that had not yet undergone demethylation (0 hour time point) and on those that were undergoing active demethylation after the end of S and during G1 (10 and 16 hour time points). The various methylation patterns of the four CpGs of the Tat GRU, and their frequencies, show that during the demethylation process there is no bimodal distribution of fully demethylated and fully methylated molecules (Fig. 3). The Cs were demethylated progressively in a rather stochastic manner, resulting in molecules with a demethylation level ranging from 0 to 7 demethylated Cs. The frequency of molecules with multiple unmethylated positions increased with the duration of glucocorticoid stimulation. The different Cs were not all demethylated at the same rate, even though similar rates were observed for Cs belonging to the same CpG (Fig. 3 B). The demethylation of CpG #1 was the most rapid, whereas that of CpG #4 was the slowest. For most positions, extensive demethylation occurred between 10 and 16 hours, when most of the cells were outside S phase, further demonstrating the replication-independent nature of this demethylation event.
When the frequencies of demethylated Cs found at each position in either hemimethylated or fully demethylated CpGs were compared, there appeared to be a bias in favor of fully demethylated CpGs, except for CpG #4 where hardly any demethylation was detectable at U4, even when demethylation of L4 was above 20%. (Fig. 3 B). This bias in favor of fully
demethylated CpG could have been due to a preferential demethylation of hemimethylated CpG, but statistical analyses revealed, however, that it mainly reflected the presence of a population of slowly demethylating cells (Supplementary Fig. 1), presumably those refractory to induction during mitosis (21). There was only a slight preferential demethylation of a MeC facing a demethylated C and no preferential demethylation of neighboring Cs. Overall, demethylation appeared to proceed in a distributive manner, essentially with independent demethylation of Cs.
Cytosine demethylation is associated with cleavage of the DNA backbone
In cultured e.d.15 fetal hepatocytes, glucocorticoid-dependent DNA demethylation of the Tat enhancer was similar to that of hepatoma cells but there were some distinctive features: rapid demethylation was observed in the first 5 hours following hormonal activation and the various Cs were demethylated at similar rates (Fig. 4 A). After 5 hours, however, demethylation did not progress any further, since the demethylation levels reached 10 and 24 hours after glucocorticoid addition were similar. Presumably, only a subpopulation of the Tat gene enhancer responded to glucocorticoids, since the fraction of chromatin that became accessible to restriction enzyme cleavage was about 3-4 fold lower in e.d.15 fetal hepatocytes than in hepatoma cells (compare Fig 7 in 19 with Fig 1 in 20). Thus, demethylation occurred rapidly in the fraction of responsive enhancer, which prompted us to test whether this rapidity would make fetal hepatocytes a valuable system for revealing the properties of the active demethylation observed in hepatoma cells.
Since some of the cytosine demethylase activities that have been previously proposed involve base or nucleotide excision, we wished to assess whether glucocorticoid treatment induced DNA backbone cleavage within the Tat GRU when it underwent demethylation. To this end, we used the same LM-PCR procedure that we had used to analyze hydrazine-piperidine cleaved genomic DNA, except that we performed it directly on the genomic DNA, without any prior treatment. In LM-PCR, a DNA linker is ligated to free 5’-P ends available within the region of interest without prior knowledge of their distribution, PCR amplification is then performed with the linker and a gene-specific primer and, after a few further rounds of PCR amplification with a labeled nested gene-specific primer, the amplified products can be detected on a gel (23). PCR amplification generally reaches a plateau in conditions allowing detection of minor cleavage products and the same overall plateau is reached for different initial numbers of molecules. Thus, specific cleavage products show up if they have a discrete distribution, and if they are more abundant than the background cleavages that occur during
DNA preparation and that give rise to products distributed throughout the amplified region (23). In this way, we could detect glucocorticoid-induced cleavage products within the Tat GRU while it was undergoing demethylation, i.e., after 5 hours of dexamethasone treatment (Fig. 4 B-C). The corresponding bands were seen on both strands at specific positions above a background of widely distributed bands. These bands were not visible after a 24-hour dexamethasone treatment when demethylation was completed (Fig. 4 B), but could already be detected 3 hours after hormone addition (data not shown). No cleavages above background were detectable at CpGs that were not demethylated upon glucocorticoid treatment, such as those in the vicinity of the Tat GRU (Fig 4 D).
To estimate the proportion of gene copies that were giving rise to the cleavage products detected, we performed competitive LM-PCR by mixing a fixed amount of genomic DNA from fetal hepatocytes treated for 5 hours with dexamethasone with varying amounts of restriction enzyme digested rat genomic DNA and then analyzing the mixture by LM-PCR (Fig. 4 E). The genomic DNA competed for the detection of the three cleavage products up to the 1/625th dilution showing that about one gene copy out of a thousand presented a specific cleavage. This is consistent with a short half-life intermediate produced during the demethylation process. Registration with the genomic sequencing ladders revealed that the glucocorticoid-induced strand breaks affected every MeCpG undergoing demethylation, and were located 3’ to the methyl-cytidine, yielding fragments whose 5’-end corresponds to the guanosine of the dinucleotide CpG (Fig 4 F). Phosphorylation of these 5’-ends is required for linker ligation allowing LM-PCR amplification, and thus the strand breaks detected here had a 5’-P-end. Any other types of demethylation intermediates, if they exist, would have escaped the detection. These breaks were detected on both strands, but they were distributed on different DNA molecules, since they were not detected with the linker ligation strategies that allow analysis of double-stranded breaks with either blunt or staggered ends (24; data not shown). This is consistent with the distributive nature of demethylation. We did not detect any glucocorticoid-induced specific strand breaks above background in hepatoma cells despite evidence of an active demethylation in these cells. Since the demethylation occurring in hepatoma cells was slower than in fetal hepatocytes, it is likely that there were fewer demethylation events per unit of time, and, therefore, the number of demethylation intermediates produced might have been too low to show up against background cleavages. Alternatively, a faster repair of the cleavage products in the hepatoma cells could also have precluded their detection. In conclusion, during demethylation of cytosines, the DNA backbone was cleaved 3’ to the modified nucleotide.
DISCUSSION
DNA demethylation mechanism
The demethylation event that we have described here differs from those that have previously been described in vertebrates based on biochemical analyses. The cleavage product 3’ to the methyl-cytidine is not compatible with an activity that directly removes the methyl group and leaves the base intact (16, see Fig. 5 A). It indicates the involvement of a mechanism producing DNA strand breaks, and suggests that the methylated base is processed by a base lesion repair pathway. Nucleotide excision repair of the MeC would be compatible with the cleavage observed, but there is no evidence in favor of such a mechanism, since the only demethylating nuclease activity reported so far excises the dinucleotide MeCpG (25, see Fig. 5 A). Base excision repair initiated by a MeC glycosylase could also lead to the 3’ cleavage (Fig. 5 B-C). Bifunctional glycosylase/lyases couple base excision (DNA glycosylase activity) with 3’-phosphodiester bond breakage (DNA nicking activity) leaving a 5’-P end 3’ to the excised methyl-cytidine, i.e., the type of ends we detected with LM-PCR (Fig. 5 C). Monofunctional enzymes do not have this nicking activity, but a transient 5’-P end 3’ to the MeC is also produced during the short-patch repair of the abasic lesion (Fig. 5 B). Hydrolysis of abasic sites before the ligation step of LM-PCR, which may occur during DNA purification and denaturation prior to LM-PCR first extension step, would also give 5’-P ends 3’ to the MeC. Thus, both mono- and bifunctional DNA glycosylases are compatible with the cleavage products detected.
Putative DNA demethylases
Two monofunctional glycosylases involved in thymine excision in T:G base pairs, TDG and MBD4, have been proposed to be active on MeC (26, 27) but these data obtained in vitrohave not been reproduced in other studies (28, 29), and could have been due to deamination of some of the MeC within the substrates used, which would have created unappreciated G/T mismatches (9). A demethylation pathway involving deamination of the MeC by cytidine deaminases followed by DNA repair of the T:G mismatch has also been suggested to exist (30). The involvement of TDG in DNA demethylation was investigated in cultured cells. In one study, over-expression of TDG led to DNA demethylation of a retinoic acid receptor (RAR) target gene, but surprisingly it was observed in the absence of RAR activation (31). In a second study, inhibition of TDG by antisense oligonucleotides interfered with the transient demethylation of repetitive sequences that was observed upon myoblast differentiation (32). TDG, however, has a coactivator activity that is independent from its glycosylase activity and
it participates, with the coactivator p300/CBP, in the transactivation of various target genes (33, 34). Thus, the effect exerted by TDG on DNA demethylation might have been indirect and have resulted from its transcriptional activation properties. MBD4-/- mice do not show any developmental defects suggestive of perturbed DNA demethylation, but rather show an increase in the frequency of C->T transitions at CpGs consistent with a role in DNA repair (35). Hence, in the absence of solid and reproducible biochemical evidence, or of well controlled genetic experiments showing a glycosylase-dependent involvement of TDG or MBD4 in DNA demethylation, it is not clear whether these enzymes are good candidates for this demethylation process. Furthermore, TDG and MBD4 have been proposed to act preferentially on hemimethylated CpGs (26, 27), but we observed that active DNA demethylation occurred on symmetrically methylated DNA and did not show a significant preference for generating symmetrically demethylated CpGs. In plants, two DNA glycosylase-lyases, ROS1 and DEMETER, antagonize the repression exerted by DNA methylation (36, 37). DEMETER has just been shown to remove MeC in vivo and in vitro (37) and, in contrast to TDG, its DNA glycosylase activity is required for activation of gene expression (38). Our results suggest that similar activities are also involved in DNA demethylation in vertebrates and revive the need to clarify the connections between DNA repair and demethylation. These activities could be targeted to specific regulatory sequences either directly through interaction with one of the transcription factors binding these sequences, or indirectly through transcription factor-induced chromatin remodeling (9).
Prevention of double-strand breaks during DNA demethylation
Since DNA demethylation occurs through a mechanism inducing strand cleavage, there is a risk that double-stranded breaks might appear, because multiple modified bases are often found in proximity. Previous characterizations of demethylation events taking place in cells suggested that a coupling of replication-dependent and active demethylation (14), or a slow two-step active mechanism producing hemimethylated sites first (12), could prevent the generation of these detrimental DNA damages. We have not found any evidence of such a two-step mechanism. Demethylation of MeCpGs occurred on both strands independently from replication through an active mechanism affecting fully methylated CpGs, and the various Cs were not first hemimethylated all together before being fully demethylated in a clear two-step manner. The two-step demethylation observed previously might be the consequence of the use of transgenes as demethylation substrates. Indeed, they may not undergo the same regulation of methylation patterns as the endogenous gene that we studied in its natural chromatin context, particulary in the case of chromatin organization dependent modifications. Tat GRU
demethylation seems rather slow and is not processive, and these features might minimize the risk of double-stranded breaks. But does such a mechanism perform the demethylation of the paternal genome occurring in the mouse egg following fertilization (7), which is rapid, replication-independent and affects numerous fully methylated CpGs? A mechanism introducing a large number of DNA strand breaks would bear the risk of damaging genome integrity and, indeed, we obtained no evidence of extensive cytidine incorporation at this developmental stage. This raises the possibility that there are several active mechanisms of cytosine demethylation operating at different stages in development.
MATERIAL AND METHODS Cell synchronization
We used a subclone of the rat hepatoma cell line (H4IIEC3). Cells were presynchronized in G1 by a 30 hour incubation in Coon’s modified Ham-F12 medium without isoleucine in the presence of 0.5% FCS. They were then synchronized as follows: The medium was replaced by isoleucine-containing medium supplemented with 5% FCS and 5 µg/ml aphidicolin and cells were cultured for 18 hours. Cells were then released from the S phase block in aphidicolin-free medium supplemented with 10-7 M dexamethasone. They were then collected at regular intervals by trypsinization and genomic DNA was purified using the Wizard Genomic DNA purification kit (Promega). For cytometry analysis, cells were fixed in ice-cooled 70% ethanol, washed with PBS and incubated at 37°C for 30 min in 500 µl of PBS containing RNAase (100 µg/ml) and propidium iodide (50 µg/ml). Analyses of at least 10,000 cells were performed with a Coulter Elite-ESP flow cytometer (Beckman-Coulter) using a 15 mW air cooled argon-ion laser tuned at 488 nm and fluorescence was measured through a 620 nm band-pass filter. Cell doublets were eliminated on the basis of DNA peak vs. DNA area signals and cell cycle quantified with the Multicycle software (Phoenix Flow Systems, San Diego, CA).
Methylation analysis
Hydrazine-piperidine-LM-PCR analysis was performed as described previously (39). Briefly, following chemical treatment, genomic DNA was denatured and a gene-specific primer was extended to create blunt-ends suitable for linker ligation allowing subsequent LM-PCR amplification (Supplementary Fig. 2).
We quantified the methylation level of individual cytosines using MethylQuant (22). Genomic DNA was treated with sodium bisulfite and the converted upper strand was PCR amplified as described. Real-time PCR quantification of the total amplified product and of the subpopulation corresponding to the specific methylation status of the cytosine of interest was performed by using, respectively, the non-discriminative (ND) and the discriminative (D) primer sets designed for the analysis of the U3 cytosine (22).
Hairpin-bisulfite PCR was adapted to the -2.5 Tat GRU from the protocol described previously (5). We ligated the two strands of the GRU using a hairpin linker (5’P-AAAGAGCGATGCGTTCGAGCATCGCT) that was compatible with the ends
resulting from cleavage at the -2,302 BsmA I site. Bisulfite conversion was carried out as described (39), except that the incubation was performed in a PCR machine with slow ramp temperatures: 3x (98°C for 1 sec, 50°C for 5 min); 3x (98°C for 1 sec, 50°C for 10 min); 3x (98°C for 1 sec, 50°C for 20 min); 3x (98°C for 1 sec, 50°C for 40 min). PCR amplification of the -2.5 Tat GRU was performed in TMAC-containing buffer (39) with the following primers: TTTGTTGTATAGGATGTTTTAGT and CCAAAATTTACCAATCTCTACTA. Amplified DNA was cloned in pGEM-T Easy vector (Promega).
DNA strand cleavage analysis
Rat fetal (e.d.15) hepatocytes were isolated and cultured as described (19) except that the non-adhering hematopoietic cells were removed 16 h after plating. Genomic DNA was analyzed by LM-PCR as described (24, 39). LM-PCR was performed to map the 5’-P ends of DNA molecules, which were cleaved on at least one strand during the demethylation process as follows: DNA was denatured and a gene-specific primer was extended to create blunt-ends allowing linker ligation (Supplementary Fig. 2).
ACKNOWLEDGMENTS
This work was supported in part by the CNRS and grants from the Association de Recherche sur le Cancer and the Ligue Nationale contre le Cancer. C. K. was supported by fellowships from CNRS and the Ligue Nationale contre le Cancer. We thank M. C. Gendron for the flow cytometry analysis, C. Brossas for technical support, M. Georges for the injection of fluorescent dCTP in fertilized mouse embryo, W. Bickmore, E. Heard, C. Darzacq and D. Higuet for helpful discussions and critical reading of the manuscript and A. Kropfinger for correction of the English language.
REFERENCES
1. Bird, A. (2002) Genes Dev 16, 6-21.
2. Meehan, R. R. (2003) Semin Cell Dev Biol 14, 53-65.
3. Jones, P. A. & Baylin, S. B. (2002) Nat Rev Genet 3, 415-28. 4. Laird, P. W. (2003) Nat Rev Cancer 3, 253-66.
5. Laird, C. D., Pleasant, N. D., Clark, A. D., Sneeden, J. L., Hassan, K. M., Manley, N. C., Vary, J. C., Jr., Morgan, T., Hansen, R. S. & Stoger, R. (2004) Proc Natl Acad Sci U S A 101, 204-9.
6. Chen, Z. X. & Riggs, A. D. (2005) Biochem Cell Biol. 83, 438-48. 7. Reik, W., Dean, W. & Walter, J. (2001) Science. 293, 1089-93. 8. Simonsson, S. & Gurdon, J. (2004) Nat Cell Biol. 6, 984-90.
9. Kress, C., Thomassin, H. & Grange, T. (2001) FEBS Lett 494, 135-40. 10. Bird, A. (2003) Nat Immunol 4, 208-9.
11. Rougier, N., Bourc'his, D., Gomes, D. M., Niveleau, A., Plachot, M., Paldi, A. & Viegas-Pequignot, E. (1998) Genes Dev 12, 2108-13.
12. Paroush, Z., Keshet, I., Yisraeli, J. & Cedar, H. (1990) Cell 63, 1229-1237.
13. Matsuo, K., Silke, J., Georgiev, O., Marti, P., Giovannini, N. & Rungger, D. (1998) Embo J 17, 1446-53.
14. Hsieh, C. L. (1999) Mol Cell Biol 19, 46-56.
15. Bruniquel, D. & Schwartz, R. H. (2003) Nat Immunol 4, 235-40.
16. Bhattacharya, S. K., Ramchandani, S., Cervoni, N. & Szyf, M. (1999) Nature 397, 579-83.
17. Wolffe, A. P., Jones, P. L. & Wade, P. A. (1999) Proc Natl Acad Sci U S A 96, 5894-6. 18. Ng, H. H., Zhang, Y., Hendrich, B., Johnson, C. A., Turner, B. M., Erdjument-Bromage,
H., Tempst, P., Reinberg, D. & Bird, A. (1999) Nat Genet 23, 58-61.
19. Thomassin, H., Flavin, M., Espinas, M. L. & Grange, T. (2001) Embo J 20, 1974-83. 20. Flavin, M., Cappabianca, L., Kress, C., Thomassin, H. & Grange, T. (2004) Mol. Cell.
Biol. 24, 7891-7901.
21. Abel, G. A., Wochnik, G. M., Ruegg, J., Rouyer, A., Holsboer, F. & Rein, T. (2002) Mol Endocrinol 16, 1352-66.
22. Thomassin, H., Kress, C. & Grange, T. (2004) Nucleic Acids Res. 32, e168.
23. Grange, T., Bertrand, E., Rigaud, G., Espinás, M. L., Fromont-Racine, M., Roux, J. & Pictet, R. (1997) Methods: A companion to Methods in Enzymology. 11, 151-163.
24. Cappabianca, L., Thomassin, H., Pictet, R. & Grange, T. (1999) in Chromatin protocols, ed. Becker, P. B. (Humana Press Inc., Totowa, NJ), Vol. 119, pp. 427-442.
25. Weiss, A., Keshet, I., Razin, A. & Cedar, H. (1996) Cell 86, 709-18.
26. Zhu, B., Zheng, Y., Hess, D., Angliker, H., Schwarz, S., Siegmann, M., Thiry, S. & Jost, J. P. (2000) Proc Natl Acad Sci U S A 97, 5135-9.
27. Zhu, B., Zheng, Y., Angliker, H., Schwarz, S., Thiry, S., Siegmann, M. & Jost, J. P. (2000) Nucleic Acids Res 28, 4157-65.
28. Hendrich, B., Hardeland, U., Ng, H. H., Jiricny, J. & Bird, A. (1999) Nature 401, 301-4. 29. Hardeland, U., Bentele, M., Jiricny, J. & Schar, P. (2003) Nucleic Acids Res 31,
2261-71.
30. Morgan, H. D., Dean, W., Coker, H. A., Reik, W. & Petersen-Mahrt, S. K. (2004) J Biol Chem. 279, 52353-60.
31. Zhu, B., Benjamin, D., Zheng, Y., Angliker, H., Thiry, S., Siegmann, M. & Jost, J. P. (2001) Proc Natl Acad Sci U S A 98, 5031-6.
32. Jost, J. P., Oakeley, E. J., Zhu, B., Benjamin, D., Thiry, S., Siegmann, M. & Jost, Y. C. (2001) Nucleic Acids Res 29, 4452-61.
33. Tini, M., Benecke, A., Um, S. J., Torchia, J., Evans, R. M. & Chambon, P. (2002) Mol Cell 9, 265-77.
34. Chen, D., Lucey, M. J., Phoenix, F., Lopez-Garcia, J., Hart, S. M., Losson, R., Buluwela, L., Coombes, R. C., Chambon, P., Schar, P. & Ali, S. (2003) J Biol Chem
278, 38586-92.
35. Millar, C. B., Guy, J., Sansom, O. J., Selfridge, J., MacDougall, E., Hendrich, B., Keightley, P. D., Bishop, S. M., Clarke, A. R. & Bird, A. (2002) Science 297, 403-5. 36. Gong, Z., Morales-Ruiz, T., Ariza, R. R., Roldan-Arjona, T., David, L. & Zhu, J. K.
(2002) Cell 111, 803-14.
37. Gehring, M., Huh, J. H., Hsieh, T. F., Penterman, J., Choi, Y., Harada, J. J., Goldberg, R. B. & Fischer, R. L. (2006) Cell 124, 495-506.
38. Choi, Y., Harada, J. J., Goldberg, R. B. & Fischer, R. L. (2004) Proc Natl Acad Sci U S A 101, 7481-6.
39. Thomassin, H., Oakeley, E. J. & Grange, T. (1999) Methods 19, 465-475. 40. Rigaud, G., Roux, J., Pictet, R. & Grange, T. (1991) Cell 67, 977-986. 41. Scharer, O. D. & Jiricny, J. (2001) Bioessays 23, 270-81.
LEGENDS TO FIGURES
Figure 1: Kinetics of glucocorticoid-induced DNA demethylation at the -2.5 Tat GRU in
hepatoma cells. (A) The four MeCpGs within the Tat GRU (–2425 to –2336) that are demethylated upon glucocorticoid treatment are numbered from 1 to 4 (upper strand: U1 to U4, lower strand: L1 to L4). (B) Demethylation kinetics of the three neighboring Cs of the upper strand. Rat hepatoma cells were grown with 10-7 M dexamethasone (+Dex) for the indicated time. The corresponding genomic DNA was treated with hydrazine and piperidine, and analyzed by LM-PCR (19, 40, Supplementary Fig. 2). Genomic DNA cleaved at A+G and C+T was analyzed simultaneously.
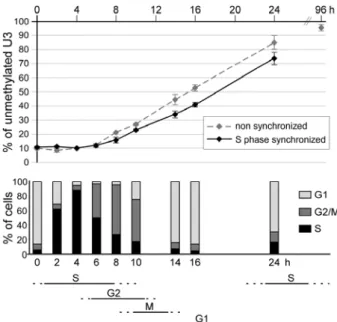
Figure 2: Demethylation of the -2.5 Tat GRU is not restricted to a particular phase of the cell
cycle. Hepatoma cells were synchronized in early S phase in two steps. They were first presynchronised in G1 by isoleucine and serum deprivation and then released from this block in the presence of aphidicolin. They were then released from the early S block in the presence of 10-7M dexamethasone for the indicated time (0h, arrested cells). The demethylation
kinetics in non-synchronized cells was analyzed in parallel. The upper panel shows the proportion of unmethylated U3 during glucocorticoid treatment as determined using the MethylQuant assay (22). The lower panel shows the proportion of cells in the various phases of the cell cycle in the synchronized culture (determined using propidium iodide staining and flow cytometry) and the deduced time frames of the phases of the cell cycle.
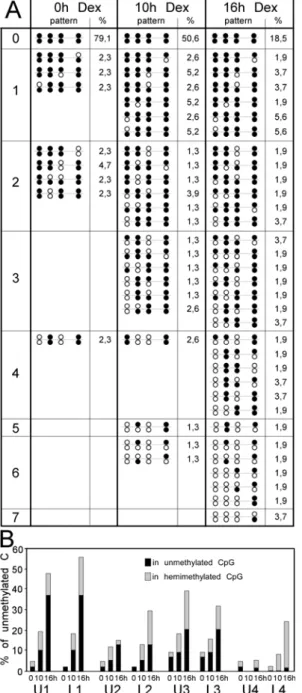
Figure 3: Distribution of the unmethylated cytosines during demethylation of the -2.5 Tat
GRU. Methylation patterns of individual double-stranded molecules were assessed using the hairpin-bisulfite PCR method (5). DNA from the synchronized cells described in Figure 2 was analyzed 0, 10 and 16 hours after release from the aphidicolin block in the presence of dexamethasone (Dex). (A) Frequencies of the various methylation patterns obtained during
demethylation of the -2.5 Tat GRU. The patterns are represented by a succession of circles symbolizing the methylation status of cytosines U1/L1, U2/L2, U3/L3, U4/L4, filled: methylated, empty: unmethylated. The patterns are organized in subgroups according to the number of unmethylated Cs as indicated on the left. The frequency of each pattern is indicated (%). As the total numbers of clones analyzed were 43, 77 and 54 for the dexamethasone treatments of 0, 10 and 16 hours respectively, the frequencies corresponding to one event are 2.3, 1.3 and 1.85%, respectively. (B) Time course of the demethylation of each individual cytosine. The percentages of unmethylated cytosines, belonging to either hemimethylated or fully demethylated CpGs as indicated, are plotted for the three analyzed times of dexamethasone induction.
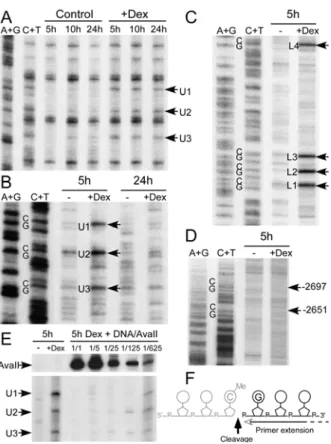
Figure 4. DNA is cleaved 3’ to the methylated cytosines during glucocorticoid-induced
demethylation. Hepatocytes isolated from e.d.15 fetuses were cultured for the indicated time (hours) without (control or -) or with (+Dex) 10-7 M dexamethasone. (A) Kinetics of glucocorticoid-induced DNA demethylation in hepatocytes analyzed by LM-PCR using genomic DNA treated with hydrazine-piperidine as described in Fig. 1 B. (B) Native genomic DNA was analyzed by LM-PCR to visualize strand breaks in the upper strand of the -2.5 Tat GRU. The arrows indicate the bands revealing cleavage at MeCpG. (C) Analysis of the lower strand as in B. (D) Analysis of the upper strand in an upstream region where there are two
Me
CpGs that are not demethylated. The arrows indicate the location of the corresponding Cs.
(E) Competitive PCR analysis of the abundance of the glucocorticoid-induced cleavage
products. A fixed amount of genomic DNA from fetal hepatocytes treated for 5 hours with dexamethasone was diluted with varying amounts of rat genomic DNA digested with AvaII that cleaves just upstream the -2.5 Tat GRU and analyzed by LM-PCR. The relative amount of the competing liver DNA corresponded to either the same amount (1/1) or serial 5-fold dilutions (1/5 to 1/625). The regions of the gel showing the bands corresponding to the AvaII cleavages and the dexamethasone-induced cleavages at the MeCpG are shown. (F) Representation of the location of the strand break detected relative to the CpG dinucleotide. Note that LM-PCR allows only analysis of the fragment downstream the break, and thus that the location and nature of the 3’-end of the upstream fragment (represented in gray) cannot be assessed.
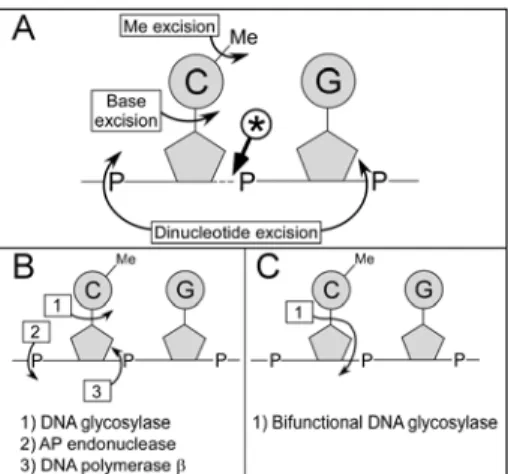
Figure 5. Scheme depicting the possible DNA demethylation pathways. (A) Location of the
cleavages expected for the published putative demethylation mechanisms. The curved arrows indicate the cleavages expected for the methyl excision pathway (16), the base excision pathway (26), and the dinucleotide excision pathway (25). The cleavage observed herein is indicated by the arrow labeled with an asterisk. (B) The short patch repair pathway involving a monofunctional DNA glycosylase that could generate the cleavage product observed (41).
(C) The action of a bifunctional DNA glycosylase/AP lyase that could generate the cleavage
product observed (41). The opening of the sugar ring that normally occurs has not been represented.
LEGENDS TO SUPPLEMENTARY FIGURES
Supplementary Figure 1: Estimation of the distributive or processive nature of CpG demethylation at the GRU.
To test whether the bias in favor of fully demethylated CpG seen in Fig. 3 B could be due either to a preferential demethylation of hemimethylated CpG or reflect heterogeneity within the cell population with at least two subpopulations undergoing demethylation at different rates, we compared the theoretical and observed frequencies of the concomitant occurrence of unmethylation at various pairs of Cs or combination of three Cs. If the demethylation events were independent, the frequency of concomitant occurrence should equal the product of the frequencies of the individual events, whereas it should be higher if the events were not independent. The hairpin bisulfite data obtained in Fig. 3 following 10 h and 16 h of glucocorticoid treatment were analyzed. (A) Expected and observed frequencies of molecules demethylated on at least two Cs. For each pair of Cs, the frequency expected for independent demethylation events (grey bars) is represented alongside the frequency observed for the corresponding event (black bars). Only CpGs #1 to 3 were analyzed because the frequencies of the unmethylated Cs at CpG #4 were too low to give rise to significant values. The frequencies obtained for two Cs belonging to the same CpG (1 to 3 as indicated) are shown on the leftmost part whereas the other part of the histogram shows the frequencies obtained for the various pairs of C belonging to distinct CpGs. They are arranged in three groups of four pairs, corresponding to each CpG couple (1+2, 2+3 and 1+3 as indicated). Within each group,
the two combinations of Cs belonging to the same strand ("same") and the two belonging to the opposite strand ("opposite") are displayed. The results reveal that there is a higher than expected demethylation of pairs of Cs regardless of the pair that is considered. (B) To test whether the bias could be due to a subpopulation of GRU undergoing demethylation at a higher rate, we analyzed expected and observed frequencies of molecules demethylated on at least three Cs following 10 hours of dexamethasone treatment. To avoid the contribution of a putative preferential demethylation of Cs belonging to the same CpG, only combinations of Cs belonging to distinct CpGs were analyzed. The striking discrepancy between observed and expected frequencies for concerted demethylation of all combinations of three Cs belonging to different CpGs indicates that demethylation occurred preferentially within a subpopulation of the GRU. This could be due, at least in part, to the population of cells that do not demethylate the GRU because they are refractory to glucocorticoid induction when undergoing M phase (21). (C, D) Results of a statistical analysis performed with the Fisher’s exact tests using contingency tables. Due to the high number of tests performed, the significance of the p-values determined by the Fisher’s exact tests was evaluated using the sequential Bonferroni technique (Rice, W. R. (1989) Evolution 43, 223-225). The Fisher’s exact tests were performed using either of two sets of data: in (C), all data, including the sequences that were fully methylated or unmethylated on one residue, and in (D) the sequences that were demethylated on at least two residues. The first set of data allows evaluation of the significance of concerted demethylation without discriminating if it results from demethylation occurring preferentially within a subpopulation of the regulatory sequence or from the preferred demethylation of a specific second residue once a first one has been demethylated. The second set of data allows testing of the preferred demethylation of a specific second residue depending on the first demethylation event without interference with a preferred demethylation occurring within a subpopulation. The results are ordered according to the p values obtained, indicated in the p(2 tail) column, and the results that are significant with a confidence interval of 95% are those which p value is inferior to that determined by the sequential Bonferroni technique, indicated in the Bonferroni column, and are indicated in the right column. The statistical analyses reveal that, when all demethylation events are considered (in C), 7 pairs of Cs show clear statistical significance (p<0.05), 3 of which corresponding to pairs of Cs facing each other within the same CpG (3 out of 4 possible pairs). The statistical significance is, however, largely due to the preferred demethylation within a subpopulation since it is not apparent anymore with the second set of data (in D), when the question tested is “Is there preferential demethylation at a second position when a
first one is demethylated?”. Thus, we conclude that a preferential demethylation of a MeC facing a demethylated C, if it exists at all, contributes only in a minor way to the demethylation mechanism.
Supplementary Figure 2: Outline of the LM-PCR procedure used in Fig. 1 and 4.
The LM-PCR was performed to map the 5’-P ends of DNA molecules which were cleaved on at least one strand either following chemical treatment specific for unmethylated cytosines (39) or during the demethylation process.
DNA denaturation and primer 1 extension. To one microgram of genomic DNA in 5 µl of
distilled water (dH2O), 5 µl of 50 mM Tris–HCl pH 8.9, 25 mM MgSO4, 200 mM NaCl,
100 mg/ml BSA (Buffer 1), 1 µl of primer 1 (0.3 pmol/ml), and 14 µl of dH2O were added.
The mixture was incubated 5 min at 95°C; then 30 min at 50°C. 1 µl of Buffer 1, 1.2 µl of 5 mM dNTP, 2.5 µl of dH2O, and 0.25 µl of Vent exo- DNA polymerase (2 u/µl) were added
and the mixture incubated for 10 min at 50°C and for 20 min at 76°C
Linker ligation. To the previous mixture 31.6 µl of dH2O, 2.2 µl of 1 M Tris–HCl, pH 7.5,
0.6 µl of 1 M MgCl2, 1.5 µl of 1 M DTT, 0.4 µl of 10 mg/ml BSA, 0.75 µl of 100 mM ATP,
3 µl of T4 DNA ligase (1 u/µl) and 5 µl of 20 pmol/µl annealed linker (GCGGTGACCCGGGAGATCTGAATTC and GAATTCAGATC in 250 mM Tris–HCl, pH 7.5, 5mM MgCl2 previously incubated for 5 min at 95°C and for 20 min at room temperature)
were added and the mixture was incubated overnight at 17°C. The DNA was then ethanol precipitated.
PCR amplification. The pellet was resuspended in 50 µl of dH2O, then 28.8 µl of dH2O,
10 µl of 650 mM Tris–HCl, pH 8.8, 100 mM 2-mercaptoethanol, 400 mM NaCl; 10 µl of 25 mM MgCl2, 8 µl of 5 mM dNTP, 2 µl of primer 2 (5 pmol/ml), 1 µl of 10 mg/ml BSA,
1 unit of Taq DNA polymerase were added. PCR amplification was performed as follows: 4 min at 94°C, then 40 s at 94°C, 2 min at 67°C, and 3 min at 76°C for 25 cycles, with a final 7-min incubation at 76°C.
Primer and product labelling. 1 µl of primer 3 (12 pmol/ml); 1 µl (20 µCi) of [γ-32P]ATP, 1 µl of 500 mM Tris–HCl, pH 7.5, 100 mM MgCl2, 50 mM DTT, 1 mM spermidine,
1 mM EDTA, pH 8 (Buffer 3), 6.5 µl of dH2O, and 0.5 µl of T4 polynucleotide kinase (5 u)
were mixed and incubated for 30 min at 37°C. Then 15 µl of the previous amplification reaction were mixed with 2.5 µl of dH2O, 0.25 µl of the primer labelling reaction, 0.5 µl of
buffer 3, 0.4 µl of 25 mM MgCl2, 1.5 µl of 5 mM dNTP, and 0.5 unit of Taq DNA
polymerase. Amplification was as follows: 2 min at 94°C, then 40 s at 94°C, 3 min at 70°C and 5 min at 76°C for 5 cycles. The amplified products were ethanol precipitated and loaded on a sequencing gel.
Nucleotide sequence of the primers used: -2500 GRU, lower strand: 1 AAGTCTCTTCTCAGTGTTC; 2 CAGTGTTCTCTATCACAGGGAGAGC; 3 TATCACAGGGAGAGCTGTCAGCCCCTG; -2500 GRU, upper strand: 1 GCCCAAGCTGACCTTGAAC; 2 CACCTCAGCTTCCCAAATGCTGGG; 3 AGCTTCCCAAATGCTGGGATTACAGGGCT.