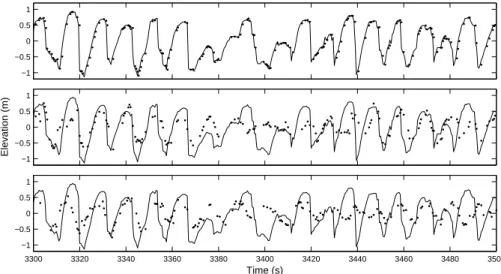
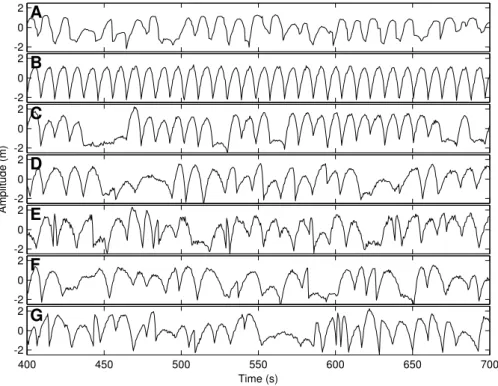
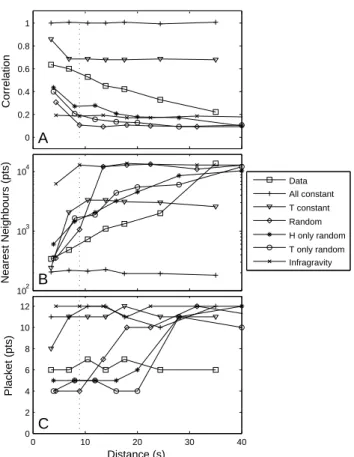
Detecting nonlinearity in run-up on a natural beach
Texte intégral
Figure

Documents relatifs
They provide some existence and non-existence results analysing separately what happens in the mass subcritical and supercritical case for both the leading term and the lower
A nother adv antage inherent to our desc rip tion is that the inv erse demand func tion ex p lic itly takes into c onsideration the p ossible substitution betw een c onsump tion
Comparison with measurements from dyke swarms in Iceland and Canada lend initial support to our predictions, and we conclude that dyke swarms are indeed expected to have a
In Section 6, exploiting the pseudo-conformal invariance and the family of stationary solutions, we construct a class of explicit blow-up solutions in the critical
We first introduce a definition of entropy solution by choosing a family of entropy pairs analogous to the Kruzhkov entropy pairs for scalar conservation laws; then we apply
List of identified metabolites as detected respectively by HR-MAS NMR analysis of whole cells, or from aqueous extracts by conventional solution NMR acquisition, for PSC
Pour les essais effectués dans les conditions drainées, les résultats montrent que l’essai effectué pour une contrainte effective de consolidation de 200 kPa, n’a pas
В разделе 5 рассматриваются алгоритмы решения постав- ленной задачи: вспомогательный алгоритм определения существования маршрутов из каж- дого узла множества
