HAL Id: hal-00317836
https://hal.archives-ouvertes.fr/hal-00317836
Submitted on 28 Jul 2005
HAL is a multi-disciplinary open access
archive for the deposit and dissemination of
sci-entific research documents, whether they are
pub-lished or not. The documents may come from
teaching and research institutions in France or
abroad, or from public or private research centers.
L’archive ouverte pluridisciplinaire HAL, est
destinée au dépôt et à la diffusion de documents
scientifiques de niveau recherche, publiés ou non,
émanant des établissements d’enseignement et de
recherche français ou étrangers, des laboratoires
publics ou privés.
Results of the Rio de Janeiro magnetic observations
1781?1788
J. M. Vaquero, R. M. Trigo
To cite this version:
J. M. Vaquero, R. M. Trigo. Results of the Rio de Janeiro magnetic observations 1781?1788. Annales
Geophysicae, European Geosciences Union, 2005, 23 (5), pp.1881-1887. �hal-00317836�
© European Geosciences Union 2005
Geophysicae
Results of the Rio de Janeiro magnetic observations 1781–1788
J. M. Vaquero1and R. M. Trigo2,3
1Departamento de F´ısica, Escuela Polit´ecnica, Univ. de Extremadura, Avda. de la Universidad s/n, 10071 C´aceres, Spain 2Centro de Geof´ısica da Universidade de Lisboa, Lisbon, Portugal
3Departamento de Eng. Civil da Universidade Lus´ofona, Lisbon, Portugal
Received: 2 February 2005 – Revised: 11 April 2005 – Accepted: 14 April 2005 – Published: 28 July 2005
Abstract. We have compiled a relatively extensive catalogue of geomagnetic declination measurements performed by the Portuguese Bento Sanches Dorta in Rio de Janeiro (Brazil) between 1781 and 1788. All the information was retrieved from printed documents compiled in the first three volumes of the Memories of the Portuguese Royal Academy of Sci-ences. During this period Sanches Dorta performed roughly 20 000 individual observations, however, only a fraction of this data is presently available. In this work, all available in-formation about these measurements is analysed. The annual change (variability and trend) and the daily cycle of geomag-netic declination at monthly scale are discussed.
Keywords. Geomagnetism and paleomagnetism, History of geophysics, Geomagnetic field declination
1 Introduction
At the end of the 18th century, the invention of the sus-pended magnet or torsion balance by Coulomb and Cassini, and Poggendorf’s variometer, based on the mirror-and-scale method, allowed the geomagnetic measurements to be per-formed more accurately. The study of the geomagnetic field was fostered in the early 19th century, after the additional impulse triggered by recent discoveries, in particular, the dis-covery of the electromagnetic interaction demonstrated by H. C. Oersted, Faraday and Amp`ere. Finally, in 1839 Gauss published his seminal work that allows for the separation of the magnetic fields into its internal and external sources through the use of spherical harmonical analysis (Gauss, 1839; Jackson et al., 2000). As a consequence, a consider-able number of geomagnetic observatories were set in many countries, mostly European, partially owing to the influence of Alexander von Humboldt (Malin and Barraclough, 1991). The greatest difficulty in studying long-term changes in the magnetic field of our planet arises from the lack of
Correspondence to: J. M. Vaquero
(jvaquero@unex.es)
reliable long time series. Since the early European voy-ages around the globe (16th century), the Earth’s magnetic field was being constantly monitored (Jackson et al., 2000; Jonkers et al., 2003). However, these observations corre-sponded mostly to on board measurements, i.e. relentlessly moving platforms (Jonkers et al., 2003). Long time series of direct observations provide useful information, which is intermediate between the actual magnetic observatories and archaeomagnetic and paleomagnetic data. Long-term time series of geomagnetic measurements are available from Paris (Alexandrescu et al., 1996), London (Malin and Bullard, 1981), Rome (Cafarella et al., 1992) and Edinburgh (Barr-aclough, 1995).
Bento Sanches Dorta was a royal astronomer for the Por-tuguese kingdom, who performed frequent meteorological and astronomical observations (Carvalho, 1985), for a pe-riod that spanned between 1781 and 1788, in Rio de Janeiro (Brazil, a Portuguese colony at the time). He performed an enormous amount of geomagnetic declination observa-tions (≈20 000) during this 8-year period, with an average rate of more than 7 observations per day. Unfortunately, his manuscripts with the individual observations have not been located and the available sources of his data are solely the papers published in the Memorias da Academia Real das Sci-encias de Lisboa (Sanches Dorta 1797, 1799a, 1799b, 1812a, 1812b, 1812c). As a member of the Portuguese Academy of Sciences he was particularly careful with his observations (both astronomical and meteorological), a fact that has en-abled the authors to use some of his data on a solar eclipse for reconstruction of solar activity (Vaquero et al., 2005).
Within this context the main objective of this work is to present the geomagnetic declination data, instrument and methods employed by Bento Sanches Dorta in Rio de Janeiro between 1781 and 1788. Moreover, a preliminary analysis of the data is presented with the aim of characterizing the ob-served trend of geomagnetic declination and detecting peri-odicities by means of wavelet analysis.
1882 J. M. Vaquero and R. M. Trigo: The Rio de Janeiro magnetic observations 1781–1788
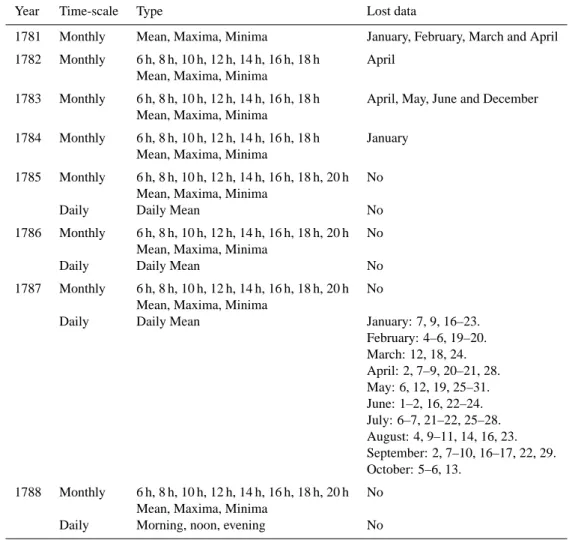
Table 1. Temporal availability of the Sanches Dorta geomagnetic data, on a year by year basis, between 1781 and 1788.
Year Time-scale Type Lost data
1781 Monthly Mean, Maxima, Minima January, February, March and April 1782 Monthly 6 h, 8 h, 10 h, 12 h, 14 h, 16 h, 18 h April
Mean, Maxima, Minima
1783 Monthly 6 h, 8 h, 10 h, 12 h, 14 h, 16 h, 18 h April, May, June and December Mean, Maxima, Minima
1784 Monthly 6 h, 8 h, 10 h, 12 h, 14 h, 16 h, 18 h January Mean, Maxima, Minima
1785 Monthly 6 h, 8 h, 10 h, 12 h, 14 h, 16 h, 18 h, 20 h No Mean, Maxima, Minima
Daily Daily Mean No
1786 Monthly 6 h, 8 h, 10 h, 12 h, 14 h, 16 h, 18 h, 20 h No Mean, Maxima, Minima
Daily Daily Mean No
1787 Monthly 6 h, 8 h, 10 h, 12 h, 14 h, 16 h, 18 h, 20 h No Mean, Maxima, Minima
Daily Daily Mean January: 7, 9, 16–23.
February: 4–6, 19–20. March: 12, 18, 24. April: 2, 7–9, 20–21, 28. May: 6, 12, 19, 25–31. June: 1–2, 16, 22–24. July: 6–7, 21–22, 25–28. August: 4, 9–11, 14, 16, 23. September: 2, 7–10, 16–17, 22, 29. October: 5–6, 13. 1788 Monthly 6 h, 8 h, 10 h, 12 h, 14 h, 16 h, 18 h, 20 h No Mean, Maxima, Minima
Daily Morning, noon, evening No
2 Instrument and method
The simplest method for measuring declination and inclina-tion is based on the fact that a freely suspended magnetized needle becomes oriented in the direction of the ambient geo-magnetic field. Sanches Dorta used a fairly simple compass to perform his observations of declination. Fortunately, in his papers for the Academia de Sciencias he describes his in-strument with a considerable number of details. In one of his descriptions Dorta states: “The magnetic needle I use to observe horizontal variations has a rectangular shape 6 inches long, 2 lines wide and 1/2 line thick, with an agate collar and the total weight of 3 oitavas and 30 gr˜aos [sic], and was constructed in England by G. Adams” (Sanches Dorta, 1812a, 77). Oitavas and gr˜aos are rare ancient units used mostly in Brazil at the time, where 1 oitava=3.586 g and 1 gr˜ao=0.04981 g; therefore, the total weight of the compass was about 12 g. Despite the simplicity of measurements per-formed by Sanches Dorta we should stress that he was using an instrument produced by G. Adams, one of the best preci-sion instrument craftsman at that time.
Concerning the measuring methodology we know that Sanches Dorta performed his observations with great regu-larity at fixed hours, namely at 6 h, 8 h, 10 h, 12 h, 14 h, 16 h, 18 h for the entire period and, since 1785, also at 20 h. In or-der to be sure concerning the orientation of the geographical north, he states that “I drew the meridian line here in the very same room where I perform my declination measurements with the compass” (Sanches Dorta, 1797, 346). Naturally, we are unable to compute the average error associated with declination measurements by Sanches Dorta. Alexandrescu et al. (1996) indicated, that in using the La Hire compass (be-fore 1777) reading to a precision better than 10 arc min could hardly be expected and it is assumed that measurement to a precision of 5 arc min was possible using the le Monnier compass (after 1777). Nevertheless, taking into account the experience and dedication of Sanches Dorta we believe that his precision should be on the order of 10 arc min.
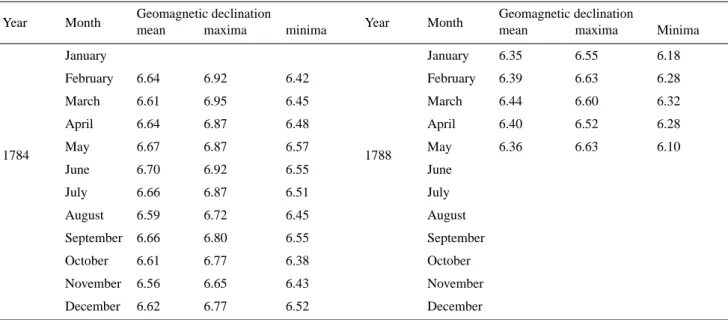
Table 2. Monthly average values (mean, maxima and minima) of geomagnetic declination in Rio de Janeiro between May 1781 and May
1788. All values in degrees.
Year Month Geomagnetic declination Year Month Geomagnetic declination
mean maxima minima mean maxima Minima
1781 January 1785 January 6.56 6.68 6.33 February February 6.57 6.68 6.45 March March 6.60 6.70 6.47 April April 6.55 6.63 6.35 May 6.72 6.75 6.70 May 6.58 6.73 6.42 June 7.01 7.46 6.72 June 6.54 6.65 6.33 July 6.91 7.17 6.70 July 6.57 6.72 6.43 August 6.67 6.81 6.52 August 6.55 6.67 6.44 September 6.50 6.65 6.25 September 6.57 6.75 6.43 October 6.51 6.81 6.16 October 6.57 6.70 6.42 November 6.51 6.73 6.30 November 6.58 6.75 6.47 December 6.67 7.42 6.33 December 6.58 6.77 6.35 1782 January 6.64 7.00 6.32 1786 January 6.55 6.70 6.33 February 6.80 7.14 6.38 February 6.53 6.83 6.32 March 6.88 7.27 6.22 March 6.46 6.65 6.25 April April 6.46 6.60 6.32 May 6.52 6.76 6.23 May 6.47 6.65 6.28 June 6.61 6.83 6.38 June 6.50 6.62 6.25 July 6.57 6.85 6.32 July 6.52 6.60 6.33 August 6.61 6.84 6.40 August 6.48 6.63 6.25 September 6.61 6.82 6.39 September 6.39 6.77 6.15 October 6.65 6.88 6.48 October 6.51 6.68 6.35 November 6.66 6.90 6.43 November 6.46 6.62 6.30 December 6.68 6.91 6.33 December 6.44 6.53 6.33 1783 January 6.68 6.90 6.38 1787 January 6.44 6.55 6.32 February 6.64 6.94 6.43 February 6.44 6.55 6.27 March 6.60 6.78 6.39 March 6.49 6.73 6.18 April April 6.43 6.55 6.32 May May 6.38 6.48 6.27 June June 6.38 6.47 6.28 July 6.61 6.80 6.31 July 6.40 6.63 6.32 August 6.60 6.79 6.32 August 6.34 6.45 6.23 September 6.66 6.88 6.33 September 6.35 6.55 6.25 October 6.66 7.10 6.45 October 6.37 6.60 6.20 November 6.62 6.77 6.43 November 6.37 6.58 6.27 December December 6.37 6.60 6.30
1884 J. M. Vaquero and R. M. Trigo: The Rio de Janeiro magnetic observations 1781–1788
Table 2. Continued.
Year Month Geomagnetic declination Year Month Geomagnetic declination
mean maxima minima mean maxima Minima
1784 January 1788 January 6.35 6.55 6.18 February 6.64 6.92 6.42 February 6.39 6.63 6.28 March 6.61 6.95 6.45 March 6.44 6.60 6.32 April 6.64 6.87 6.48 April 6.40 6.52 6.28 May 6.67 6.87 6.57 May 6.36 6.63 6.10 June 6.70 6.92 6.55 June July 6.66 6.87 6.51 July August 6.59 6.72 6.45 August September 6.66 6.80 6.55 September October 6.61 6.77 6.38 October November 6.56 6.65 6.43 November December 6.62 6.77 6.52 December 3 Data
Despite the large quantity of individual observations per-formed by Sanches Dorta only a relatively small subset of aggregated data has remained to the present time. Table 1 shows the details on the availability of data measured by Sanches Dorta, and registered in his articles to the Memorias da Academia Real das Sciencias de Lisboa (Sanches Dorta 1797, 1799a, 1799b, 1812a, 1812b, 1812c). Table 2 shows the monthly values for the mean, maxima and minima geo-magnetic declination between 1781 and 1788.
The most poorly covered epoch corresponds to the initial year of 1781, where only the mean, maximum and minimum values are available and moreover, the first 4 months of data are missing. Between 1782 and 1784 there are monthly aver-aged values of mean, maximum, minimum and also monthly averaged 7-hourly measurements. The only missing data cor-responds to the months of April, May, June and December 1783. Afterwards, the number of records between 1785 and May 1788 increases considerably, due to the availability of one daily measurement (daily average) for the years 1785– 1787 and, additionally, three daily values (morning, noon and evening) for the 5 months of 1788. A few gaps appear for the year of 1787. In June 1788 Sanches Dorta moved to the city of S˜ao Paulo where he did not perform more geomagnetic measurements, most probably due to the lack of an appro-priate compass. In fact, he maintained his meteorological readings.
Figure 1 shows the variability of Sanches Dorta’s geomag-netic declination for Rio de Janeiro. At the monthly scale it is possible to observe large oscillations during 1781 which casts a suspicion on the quality of data for this year. The other striking feature corresponds to the large “jump” in
val-ues during the year of 1786 (Fig. 1a). However, it is at the daily scale that the full scale of this jump is more notorious and can be pinpointed to 28 September 1786 (Fig. 1b). Nat-urally, such large changes did not pass unnoticed to a trained observer, such as Sanches Dorta. In fact, on this occasion, he has written “suddenly, there has been an excessive change since the 28th of September until today. What could be the cause for these changes?” (Sanches Dorta, 1812a, 78).
4 Correction, annual trend and daily evolution
We have adjusted two linear regression lines to both branches of daily data, thus obtaining two regression lines with sim-ilar downward slopes. In fact, these slopes are so simsim-ilar that we believe there might be a systematic error after 28 September 1786. The cause of this systematic error is un-known. Nevertheless, we believe that this systematic error can be partially offset by performing a simple linear correc-tion to the data after the identified breaking point (simply by removing the constant value of 539 arc s). Results obtained after removing the constant can be visualised in Figs. 1c and 1d. A linear fit of the daily data indicates a variation of
−0.074±0.001 deg/year, where we have used the standard error of the coefficient of linear fit as an estimation of the annual variation error.
At the latitude of Rio de Janeiro, the typical peak-to-peak amplitude of the regular daily variation of geomagnetic dec-lination is on the order of 4 min of arc (Ud´ıas and Mezcua, 1997). Naturally, this is just an average value that can change considerably, and is influenced by the lunar, annual and solar cycles.
J. M. Vaquero and R. M. Trigo: The Rio de Janeiro magnetic observations 1781–1788 1885
14
6,0 6,2 6,4 6,6 6,8 7,0 7,2 7,4 7,6 1780 1781 1782 1783 1784 1785 1786 1787 1788 1789 Date Geomagnetic Declination (º) mean maxima minima 6,2 6,3 6,4 6,5 6,6 6,7 6,8 1784 1785 1786 1787 1788 1789 Date Geomagnetic Declination (º)(a) (b)
6,0 6,2 6,4 6,6 6,8 7,0 7,2 7,4 7,6 1780 1781 1782 1783 1784 1785 1786 1787 1788 1789 Date Geomagnetic Declination (º) mean maxima minima 6,1 6,2 6,3 6,4 6,5 6,6 6,7 6,8 1784,5 1785 1785,5 1786 1786,5 1787 1787,5 1788 1788,5 1789 Date Geomagnetic Declination (º)(c) (d)
Figure 1. Original measurements of geomagnetic declination performed by Sanches Dorta at
the (a) monthly and (b) daily scales and after the correction at (c) monthly and (d) daily
scales.
Fig. 1. Original measurements of geomagnetic declination performed by Sanches Dorta at the (a) monthly and (b) daily scales and after the
correction at (c) monthly and (d) daily scales.
15
Figure 2. Monthly average deviations of hourly data (see text for details). Deviations
computed. Data at 20h between 1783 and 1785 is missing (black stripe). Data for December
1783 and January 1784 was interpolated. All units in minutes of arc.
Fig. 2. Monthly average deviations of hourly data (see text for details). Data at 20 h between 1783 and 1785 is missing (black stripe). Data
for December 1783 and January 1784 was interpolated. All units in minutes of arc.
Without the original daily data from Sanches Dorta we had to restrict our analysis of the daily cycle variability solely to monthly averages recorded for even hours of the day (6 h, 8 h, 10 h, 12 h, 14 h, 16 h, 18 h and 20 h). For each individual month between July 1783 and May 1788 (i.e. 59 months)
we have computed a monthly grand average, by averaging the available 7 (or 8) hourly average measurements. Then, we computed the deviation of each hourly average value from that grand average, obtaining a long time series of 454 anomalous (or deviation) values. Data for December 1783
1886 J. M. Vaquero and R. M. Trigo: The Rio de Janeiro magnetic observations 1781–1788
16
(a) (b)
Figure 3. (a) The wavelet power spectrum of the deviations of geomagnetic declination at 14
hours between February 1784 and May 1788. The contour levels are chosen so that 75%,
50%, 25%, and 5% of the wavelet power is above each level, respectively. The cross-hatched
region is the cone of influence, where zero padding has reduced the variance. Black contour is
the 5% significance level, using a red-noise background spectrum. (b) The global wavelet
power spectrum (black line). The dashed line is the significance for the global wavelet
spectrum, assuming the same significance level and background spectrum as in (b).
Fig. 3. (a) The wavelet power spectrum of the deviations of geomagnetic declination at 14 h between February 1784 and May 1788. The
contour levels are chosen so that 75%, 50%, 25%, and 5% of the wavelet power is above each level, respectively. The cross-hatched region is the cone of influence, where zero padding has reduced the variance. Black contour is the 5% significance level, using a red-noise background spectrum. (b) The global wavelet power spectrum (black line). The dashed line is the significance for the global wavelet spectrum, assuming the same significance level and background spectrum as in (b).
and January 1784 were missing and were interpolated. We should stress that this new data set has no decadal trend and, therefore, the averaged daily cycle can be visualized ex-plicitly (Fig. 2). In particular, it is possible to see that the maximum declination deviation is usually observed around 14 h, while the minimum ought to occur close to the early morning observation of 6 h. These results are in good agree-ment with the deviations expected for the average daily cycle at these latitudes (Ud´ıas and Mezcua, 1997). If one concen-trates on the mid-afternoon hours, an annual cycle does seem to be present. Therefore, we applied a wavelet analysis (us-ing a morlet mother wavelet) to the 14-h monthly deviation data (Fig. 3). We have restricted this particular analysis to the period that spans between February 1784 and May 1788, in order to avoid spurious results due to the interpolation pro-cess. The most important result corresponds to the existence of an annual cycle throughout the entire period. This annual cycle is statistically significant at the 5% level, after the ap-plication of a red-noise background spectrum (Torrence and Compo, 1998). Other apparent cycles, namely a semiannual periodicity are not statistically significant.
5 Conclusions
Since the 16th century, the Earth’s magnetic field has been constantly monitored by European navigators crossing the Oceans (Jackson et al., 2000; Jonkers et al., 2003). How-ever, despite the large number of declination and inclination measurements obtained by ships, the non-stationary nature of
these observations hampers the possibility of deriving long time series characteristic of a particular site. A comprehen-sive survey of historical geomagnetic measurements around the globe reveals that systematic observations over land-masses started overwhelmingly well into the 19th century. Therefore, any prolonged period with observations prior to this date might be relevant to validate models of historical global geomagnetic activity for the 18th century (Jackson et al., 2000; Jonkers et al., 2003), thus the added value of as-sessing a new 8-year-long period of observations at Rio de Janeiro (Brazil). During this period, that spanned between 1781–1788, the Portuguese scientist Bento Sanches Dorta performed roughly 20 000 individual observations. Despite the unavailability of his original data set we were able to lo-cate documents with an important subset of these observa-tions.
After identifying an obvious bias error in September 1786 we removed it and the corrected geomagnetic dec-lination time series presents a more consistent aspect. The long-term trend observed for the entire period is
−0.074±0.001 deg/year. The Global Geomagnetic Model from the British Geological Survey (Barraclough, 1974, 1982) provides a value of −0.094 deg/year while the more recent model gufm1 (Jackson et al., 2000) predicts a trend of
−0.08 deg/year, a value considerably closer to the observed trend. The use of monthly averaged hourly data for the en-tire 8-year-long period reveals a nice daily cycle with devia-tion magnitude compatible with those described in literature (±4 arc min) for that latitude.
Many time series in Earth sciences are not stationary, with potential significant changes in time of major periodicities (Torrence and Compo, 1998). Therefore, the application of standard power spectrum techniques (such as the Fast Fourier Transform) might not be the most indicated method. The application of a wavelet analysis allows for a robust assess-ment of any statistically significant periodicity, either for the entire time series or for smaller sections. The only ro-bust frequency that is consistently present is the annual one. Therefore, other frequencies usually described in literature, namely the solar, the semi-annual and lunar were not dis-cernible. The lunar frequency would be impossible to detect with monthly average data, however, the original daily data recorded by Sanches Dorta could be used for such a purpose. On the contrary, the semi-annual cycle is partially present in Fig. 3, however, it does not reach the required significance level. The solar cycle is impossible to detect with only 8 years of data.
Finally, we would like to stress that the entire data set will be available shortly at an appropriate site and can be obtained directly from the authors upon request.
Acknowledgements. J. M. Vaquero thanks to the Junta de Ex-tremadura the grant MOV04A047 to carry out a visit to the Cen-tro de Geof´ısica (University of Lisbon). All the historical material used in this work was consulted at the Biblioteca da Academia das Ciˆencias de Lisboa, at the Biblioteca Nacional de Lisboa and at the Museu de F´ısica da Universidade de Coimbra.
Topical Editor T. Pulkkinen thanks two referees for their help in evaluating this paper.
References
Alexandrescu, M., Courtillot, V., and Le Mou¨el, J.-L.: Geomagnetic field direction in Paris since the mid-sixteenth century, Physics of the Earth and Planetary Interiors, 98, 321–360, 1996.
Barraclough, D. R.: Spherical Harmonic Analysis of the Geomag-netic Field for Eight Epochs between 1600 and 1910, Geophys. J. R. Astr. Soc., 36, 497–513, 1974.
Barraclough, D. R.: Historical observations of the geomagnetic field, Phil. Trans. R. Soc. Lond. A 306, 71–78, 1982.
Barraclough, D. R.: Observations of the Earth’s magnetic field in Edinburgh, from 1670 to the present day, Trans. R. Soc. Edin-burgh Earth Sci., 85, 239–252, 1995.
Cafarella, L., De Santis, A., and Meloni, A.: Secular variation in Italy from historical geomagnetic field measurement, Physics of the Earth and Planetary Interiors, 73, 206–221, 1992.
Carvalho, R.: A astronomia em Portugal no s´eculo XVIII, Lisboa, 1985.
Gauss, C. F.: Allgemeine Theorie des Erdmagnetismus, in: Resul-tate aus den Beobachtungen des magnetischen Verein im Jahre 1838, 1–52, Leipzig, G¨ottingen Magn. Ver., Germany, 1839. Jackson, A., Jonkers, A. R. T., and Walker, M. R.: Four centuries
of geomagnetic secular variation from historical records, Phil. Trans. R. Soc. Lond. A, 358, 957–990, 2000.
Jonkers, A. R. T., Jackson, A., and Murray, A.: Four centuries of ge-omagnetic data from historical records, Reviews of Geophysics, 41(2), 1006, doi:10.1029/ 2002RG000115, 2003.
Malin, S. R. C. and Barraclough, D. R.: Humboldt and the Earth’s magnetic field, Q. J. R. Astr. Soc., 32, 279–293, 1991.
Malin, S. R. C. and Bullard, E.: The direction of the Earth’s mag-netic field at London, 1570–1975, Philos. Trans. R. Soc. London, 299, 357–422, 1981.
Sanches Dorta, B.: Observac¸˜oes meteorologicas feitas na Ciudade do Rio de Janeiro, Memorias da Academia Real das Sciencias de Lisboa, 1, 345–378, 1797.
Sanches Dorta, B.: Observac¸˜oes astronomicas, e meteorologicas feitas na Ciudade do Rio de Janeiro no anno de 1784, Memorias da Academia Real das Sciencias de Lisboa, 2, 346–368, 1799a. Sanches Dorta, B.: Observac¸˜oes astronomicas, e meteorologicas
feitas na Ciudade do Rio de Janeiro no anno de 1785, Memorias da Academia Real das Sciencias de Lisboa, 2, 369–401, 1799b. Sanches Dorta, B.: Observac¸˜oes astronomicas, e meteorologicas
feitas na Ciudade do Rio de Janeiro no anno de 1786, Memorias da Academia Real das Sciencias de Lisboa, 3, 68–107, 1812a. Sanches Dorta, B.: Observac¸˜oes astronomicas, e meteorologicas
feitas na Ciudade do Rio de Janeiro no anno de 1787, Memorias da Academia Real das Sciencias de Lisboa, 3, 108–153, 1812b. Sanches Dorta, B.: Taboas, e Diario Meteorologico pertenecentes,
ao Anno de 1788, Memorias da Academia Real das Sciencias de Lisboa, 3, 154–1167, 1812c.
Torrence, C. and Compo, G. P.: A Practical Guide to Wavelet Anal-ysis, Bulletin of the American Meteorological Society, 79, 1, 61– 78, 1998.
Ud´ıas, A. and Mezcua, J.: Fundamentos de Geof´ısica, Madrid, 1997.
Vaquero, J. M., Trigo, R. M., and Gallego, M. C.: A “lost” sunspot observation in 1785, Astron. Nachr., 326, 112–114, 2005.