HAL Id: hal-00297728
https://hal.archives-ouvertes.fr/hal-00297728
Submitted on 4 Jun 2004HAL is a multi-disciplinary open access
archive for the deposit and dissemination of sci-entific research documents, whether they are pub-lished or not. The documents may come from teaching and research institutions in France or abroad, or from public or private research centers.
L’archive ouverte pluridisciplinaire HAL, est destinée au dépôt et à la diffusion de documents scientifiques de niveau recherche, publiés ou non, émanant des établissements d’enseignement et de recherche français ou étrangers, des laboratoires publics ou privés.
Natural isotopic composition of nitrogen in suspended
particulate matter in the Bay of Bengal
S. Kumar, R. Ramesh, N. B. Bhosle, S. Sardesai, M. S. Sheshshayee
To cite this version:
S. Kumar, R. Ramesh, N. B. Bhosle, S. Sardesai, M. S. Sheshshayee. Natural isotopic composition of nitrogen in suspended particulate matter in the Bay of Bengal. Biogeosciences Discussions, European Geosciences Union, 2004, 1 (1), pp.87-105. �hal-00297728�
BGD
1, 87–105, 2004 Natural isotopic composition of nitrogen S. Kumar et al. Title Page Abstract Introduction Conclusions References Tables Figures J I J I Back Close Full Screen / EscPrint Version Interactive Discussion © EGU 2004 Biogeosciences Discussions, 1, 87–105, 2004 www.biogeosciences.net/bgd/1/87/ SRef-ID: 1810-6285/bgd/2004-1-87 © European Geosciences Union 2004
Biogeosciences Discussions
Biogeosciences Discussions is the access reviewed discussion forum of Biogeosciences
Natural isotopic composition of nitrogen
in suspended particulate matter in the
Bay of Bengal
S. Kumar1, R. Ramesh1, N. B. Bhosle2, S. Sardesai2, and M. S. Sheshshayee3
1
Physical Research Laboratory, Ahmedabad-380 009, India
2
National Institute of Oceanography, Goa-403 004, India
3
University of Agricultural Sciences, GKVK Campus, Bangalore-560 065, India Received: 26 April 2004 – Accepted: 28 May 2004 – Published: 4 June 2004 Correspondence to: Sanjeev Kumar ([email protected])
BGD
1, 87–105, 2004 Natural isotopic composition of nitrogen S. Kumar et al. Title Page Abstract Introduction Conclusions References Tables Figures J I J I Back Close Full Screen / EscPrint Version Interactive Discussion
© EGU 2004
Abstract
We present the first measurement of nitrogen isotopic composition (δ15N) in sus-pended particulate matter (SPM) of the surface Bay of Bengal (BOB) at 24 different locations during pre- (April–May 2003) and post- (September–October 2002) monsoon seasons. The δ15N of particulate organic nitrogen (PON) in surface suspended
mat-5
ter of coastal as well as northern open BOB shows signatures of a two end-member mixing between continental inputs and marine sources. Dilution by the organic and de-trital continental material brought in by rivers leads to consistently lower δ15N, evident from the relationship between surface salinity and δ15N. δ15N of surface PON of open ocean locations during both seasons, and also at coastal locations during pre-monsoon
10
suggest the nitrate from deeper waters as a predominant source of nutrient for plank-tons. The depth profiles of δ15N of SPM during pre-monsoon season at nine different locations are also presented. These indicate an increase in δ15N by a maximum of 2.8‰ between euphotic depth and 300 m, which is lower than that observed in the eastern Indian Ocean, indicating the role of higher sinking rates of particles ballasted
15
by aggregates of organic and mineral matter in BOB.
1. Introduction
Particulate organic matter (POM) is known to play an important role in marine nitrogen and carbon cycles (Saino and Hattori, 1980). The study of the nitrogen isotope ratio 15
N/14N (δ15N, expressed as deviation in per mil from that of atmospheric N2) of POM
20
provides an insight into the availability and utilization of nutrients and the transforma-tion processes it undergoes during its transportatransforma-tion to greater depths. Several such studies have been done in different parts of the world ocean (Wada and Hattori, 1976; Saino and Hattori, 1980; Altabet, 1996). Similar studies in the ocean sediments have been used for the reconstruction of past changes in surface ocean nutrient utilization
25
BGD
1, 87–105, 2004 Natural isotopic composition of nitrogen S. Kumar et al. Title Page Abstract Introduction Conclusions References Tables Figures J I J I Back Close Full Screen / EscPrint Version Interactive Discussion
© EGU 2004
The δ15N of the marine particulate organic nitrogen (PON) has a strong dependence on the δ15N of source material (atmospheric N2, NO−3 and NH+4). δ15N of marine PON shows a wide variation (Saino and Hattori, 1980; Altabet, 1988; Rau et al., 1998), due to the changes in δ15N of source, caused by fractionation of isotopes during various biogeochemical/biological processes involved during its formation. These processes
5
are N2fixation, denitrification, nitrification, and nitrate assimilation. Denitrification leads to15N enrichment of the remaining nitrate while nitrification causes enrichment of15N in the ammonium pool (Mariotti et al., 1984). Enrichment of up to 20‰ in the remaining pool has been found due to denitrification (Miyake and Wada, 1971; Cline and Ka-plan, 1975), nitrification (Miyake and Wada, 1971) and nitrate assimilation (Wada et
10
al., 1971). During the uptake of dissolved nitrogen in eutrophic waters, phytoplankton prefers 14N over 15N (Wada and Hattorri, 1978). Fixation of atmospheric nitrogen is known to lower the δ15N of PON (−2 to 0‰, Minagawa and Wada, 1986) because of the depleted source (atmospheric N2, 0‰). Therefore, the areas with lower δ15N may involve N2 fixation. Furthermore, the δ15N of PON in marine organic matter also
de-15
pends on phytoplankton species (composition), physiology and the rate and phase of growth of planktons (Montoya and McCarthy, 1995).
This study reports the first detailed observations of δ15N of suspended PON in the Bay of Bengal (BOB), the eastern counterpart of Arabian Sea in the northern Indian Ocean, where data on δ15N of suspended matter is scarce. We examine the
ob-20
served variation in15N and PON content in two different seasons i.e. between post-(September–October 2002) and pre- (April–May 2003) monsoon periods. The verti-cal profiles of δ15N in suspended matter at different locations, and the depth related changes during the pre-monsoon season have also been discussed.
BGD
1, 87–105, 2004 Natural isotopic composition of nitrogen S. Kumar et al. Title Page Abstract Introduction Conclusions References Tables Figures J I J I Back Close Full Screen / EscPrint Version Interactive Discussion
© EGU 2004
2. Material and methods
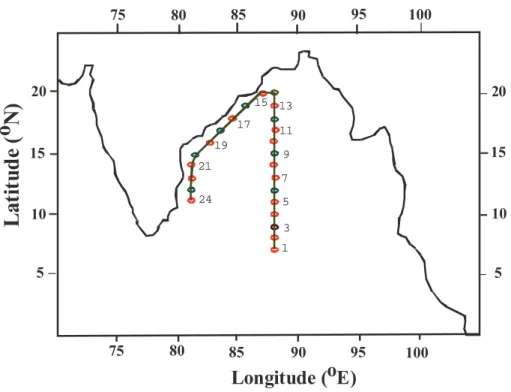
Sampling was performed along the cruise track shown in Fig. 1, onboard ORV Sagar Kanya (SK-182 and SK-191), as a part of Bay of Bengal process study (BOBPS). Surface sea water samples were collected using a clean plastic bucket and thirty litre Go Flo bottles attached to a CTD rosette were used to collect sea water samples from
5
various depths (up to 500 m). Immediately after collection, four to six litres of sea water were filtered through a precombusted (400◦C for 4 h) Whatman GF/F glass fibre filter (47 mm diameter, 0.7 µm pore size). After the filtration the samples were dried at 60◦C and stored at room temperature for isotopic analysis in the shore laboratory.
Measurements of nitrogen isotope ratio and PON were carried out using a Carlo Erba
10
elemental analyser interfaced via ConfloII to a Finnigan Delta Plus mass spectrome-ter. Due to the small amount of nitrogen gas recovered from the samples (typically
<1 µM N), for precise analysis, the method of Owens and Rees (1989) with a
modifica-tion in oxygen injecmodifica-tion time was used. Integramodifica-tion of ion beam areas (m/z 28+29+30) after the calibration against standard material (IAEA-NO-3, KNO3) provided the
mea-15
surement of PON. The advantage of this technique lies in the simultaneous measure-ment of isotope ratio and PON in the same sample. PON was measured to a precision of less than 10%, while that for δ15N was 0.3‰. δ15N measurement of the standard (IAEA-NO-3, KNO3, δ15N=4.7‰) yielded a value of 4.9±0.3‰ (n=19).
3. Study area: hydrography and nutrients
20
BOB is a semi-enclosed tropical basin in the northern Indian Ocean. It experiences seasonal changes in circulation and climatic conditions due to monsoons. BOB re-ceives excess precipitation and large quantities of freshwater influx (1.6*1012m3yr−1 compared to 0.3*1012m3yr−1 of Arabian Sea; Subramanian, 1993) from the major rivers draining the Indian subcontinent. This riverine freshwater input results in
con-25
BGD
1, 87–105, 2004 Natural isotopic composition of nitrogen S. Kumar et al. Title Page Abstract Introduction Conclusions References Tables Figures J I J I Back Close Full Screen / EscPrint Version Interactive Discussion
© EGU 2004
inducing stratification of the upper 100 m of the water column (Prasanna Kumar et al., 2002). The surface salinity of the open ocean stations during post-monsoon decreased from south to north (34 psu at 7◦N to 32 psu at 16◦N) and dropped by 3 psu at 17◦N. The coastal stations showed similar distribution pattern of salinity but the drop was more pronounced from 16◦N to 17◦N (34 psu to 21 psu). During pre-monsoon the
5
overall variation in salinity was between 32 to 34 psu. Sea surface temperature (SST) during post-monsoon along open BOB varied marginally from 28.2 to 29◦C from south to north, while along coastal transect it did not show any trend and the average was around 30◦C. During pre-monsoon SST varied from 29 to 31.4◦C in the open ocean and showed a decrease of ∼2◦C from 14◦N to 15◦N. For the coastal locations, it varied
10
from 29.1◦C to 30.4◦C. The riverine inputs are a major potential source of nutrients such as nitrate, phosphate and silica to the Bay. Also, one of the major suppliers of the nutrients to the surface Bay is mixing due to cyclones, frequent in the BOB during post monsoon season. The formation of localized intense blooms and also the intensifica-tion of bloom generated by anticyclonic gyre are known due to injecintensifica-tion of nutrients by
15
cyclonic activity (Vinaychandran and Mathew, 2003). During the pre-monsoon period there is a poleward East India Coastal Current (EICC) active at north of 10◦N which brings cooler, more saline water with nutrients to the surface (Shetye et al., 1993). Up-welling has also been observed along the western boundary of basin in a 40 km wide band due to local longshore wind stress (Shetye et al., 1991).The measured nitrate
20
concentrations in the surface Bay is presented in Fig. 2; in general, the surface nitrate during post monsoon was very low (mostly below detection limit, <0.1 µM) and for pre-monsoon it was mostly around 0.2 µM. However, it increased sharply between 40 and 60 m (maximum ∼15 µM and average 7 µM during pre-monsoon).
4. Results
25
Stations studied are divided into two transects: one along the 88◦E longitude (Stn. 1– Stn. 13), defined here as open ocean stations (transect) and the other parallel to the
BGD
1, 87–105, 2004 Natural isotopic composition of nitrogen S. Kumar et al. Title Page Abstract Introduction Conclusions References Tables Figures J I J I Back Close Full Screen / EscPrint Version Interactive Discussion
© EGU 2004
Indian coast (Stn. 14 to Stn. 24) as the coastal stations (transect). 4.1. Surface suspended matter
Overall, it has been observed that the average surface PON concentration during post-monsoon season (1.4 µM N) is nearly twice that of pre-post-monsoon (0.7 µM N). During the post-monsoon the difference in average coastal (1.3 µM N) and open ocean (1.4 µM N)
5
surface PON is insignificant. The same is true for the pre-monsoon season, where it averages 0.7 µM N for coastal and 0.6 µM N for open ocean locations. During the whole period of study, the maximum surface PON of 2.5 µM N has been observed at Stn. 15, which is the nearest to the coast with the shallowest water column depth of 620 m. The δ15N of surface PON for both pre- and post-monsoon seasons ranges from
10
2 to 7.6‰ and falls in the general range of known oceanic PON δ15N. The overall δ15N of surface PON averages around 4.1‰ for post-monsoon and 3.8‰ for pre-monsoon season, which agree within analytical error. There is a significant difference of 1.5 between average δ15N of open ocean (4.8‰) and coastal (3.3‰) stations during post-monsoon. However, no such difference has been observed for the samples collected
15
during pre-monsoon where it averages around 4‰ for both open and coastal stations. There is no significant latitudinal variation in δ15N during both the seasons. There exists a positive linear correlation between PON and δ15N (Fig. 3). This relationship is more significant during post-monsoon (R2=0.42, n=24) than pre-monsoon (R2=0.21, n=22). For post-monsoon season the coastal stations show less variability and data
20
points lie in the lower regime i.e. low PON- low δ15N zone. On the other hand, the open ocean stations show a bimodal distribution, one with low PON-low δ15N which averages around 3.0‰ and other with high PON-high δ15N with an average of 5.8‰. During pre-monsoon no clear cut distinction exists between δ15N of PON in coastal and open ocean transects.
BGD
1, 87–105, 2004 Natural isotopic composition of nitrogen S. Kumar et al. Title Page Abstract Introduction Conclusions References Tables Figures J I J I Back Close Full Screen / EscPrint Version Interactive Discussion
© EGU 2004
4.2. Depth profile of suspended matter
Figure 4 presents the vertical profile of δ15N and PON for pre-monsoon season at different locations upto 300 m or more except Stn. 3, where it is only up to 100 m. Average δ15N of PON in the euphotic zone (∼60 m) varies between 1.9 to 4.9‰ for different stations with an average of 4.2‰. Below the euphotic zone, δ15N increases
5
with depth and reaches an average value of 5.9‰ at 300 m. For the open ocean stations the average euphotic zone δ15N shows a decreasing trend from south to north with a maximum of 4.5‰ for southernmost station (Stn. 23) and minimum of 2.9‰ for northern station (Stn. 12). δ15N also shows subsurface minimum between 10 to 60 m varying with location. PON, in general, decreases with depth showing subsurface
10
maxima within the euphotic zone. Euphotic zone average of PON is 0.7 µM N which decreases to 0.3 µM N at 300 m.
5. Discussion
In oceanic environments, PON is mainly derived form phytoplankton, micro-zooplankton, bacteria and detritus. The nitrogen isotopic signature of PON in
sus-15
pended matter depends on the isotopic fractionation associated with its formation, and in turn upon the isotopic composition of inorganic form of dissolved nitrogenous sources (such as NO−3, 3–7‰; NH+4, 6–8‰; and atmospheric N2, 0‰; Miyake and Wada, 1967) available for the utilization by phytoplankton. The variation in δ15N of PON reveals the utilization of different nitrogen sources by planktons as these sources
20
have distinct isotopic compositions. Our δ15N data precludes the possibility of N2 fixa-tion in BOB. Cyanobacteria “Trichodesmium”, a well known N2 fixer exhibits low δ15N values around −2 to 0‰ (Minagawa and Wada, 1986). All our δ15N data are above the required value for an area dominated by N2fixers.
BGD
1, 87–105, 2004 Natural isotopic composition of nitrogen S. Kumar et al. Title Page Abstract Introduction Conclusions References Tables Figures J I J I Back Close Full Screen / EscPrint Version Interactive Discussion
© EGU 2004
5.1. Surface suspended matter
For the purpose of discussion, stations in BOB may be classified into two based on the surface salinity of the stations. The first includes the stations with salinity less than 32 psu (the six coastal stations and three open ocean stations during post monsoon; Fig. 5) and second includes the stations with surface salinity more than 32 psu (all the
5
rest). The former are influenced by the riverine discharge whereas the latter are not. The salinity and δ15N of suspended PON (Fig. 5) for the two seasons indicate that when salinity is low (<32 psu), as in the case of six coastal locations and three open ocean stations, due to riverine discharge during post-monsoon, the δ15N is consistently on lower side (2–3‰) (except one location each in coastal and open ocean which have
10
δ15N values of 4.9 and 4.6‰, respectively). The rivers draining the BOB bring lot of terrestrial organic as well as detrital material (Unger et al., 2003). The consistent low
δ15N suggests that isotopic signature of PON at these locations have been influenced by terrestrial inputs. Terrestrial particulate matter, brought by major rivers, might have diluted the overall δ15N signal of PON, although there exists no literature regarding the
15
δ15N of such particulate matter. But, the naturally occurring land derived materials are known to have low δ15N (mean of 2.5‰ for terrestrial organic matter, Sweeney et al., 1978; and 1.5‰ for terrestrial detrital component, Mariotti et al., 1984).
The stations which are not influenced by riverine discharge show a wide isotopic vari-ability (2–7.6‰). However, high average δ15N of surface suspended matter (5.3‰ for
20
open ocean stations during post-monsoon and 4‰ for both open and coastal stations during pre-monsoon) have been observed for these stations. Since these locations are unaffected by the terrestrial influence the variability observed may be attributed to the two possible reasons: first, uptake of regenerated ammonium (Wada and Hattori, 1976); and second, supply of nitrate from deeper waters due to the presence of
shal-25
low nitracline, which is between 50–100 m (Prasanna Kumar et al., 2002). In the former case, regenerated ammonium produced by excretion of zooplankton and heterotrophs in the surface layer has been considered as a source. In most oceanic regions,
ammo-BGD
1, 87–105, 2004 Natural isotopic composition of nitrogen S. Kumar et al. Title Page Abstract Introduction Conclusions References Tables Figures J I J I Back Close Full Screen / EscPrint Version Interactive Discussion
© EGU 2004
nium is the preferred substrate and normally does not accumulate in the surface layer (Mino et al., 2002). Soon after regeneration of ammonium, it is rapidly taken up by the algae; there is little time for isotopic fractionation and the δ15N of NH+4 is imprinted in PON without much modification. Unfortunately, δ15N of ammonium in the BOB has not been measured to directly assess the role of ammonium on δ15N of PON. Values
5
in the range of 6–8‰ have been reported for ammonium in other oceans (Miyake and Wada, 1967). However, indirect estimation of degree of contribution of ammonium in
δ15N of PON may be obtained from new production measurement (Dugdale and Go-ering, 1967) in the region. If the new production is less, there could be a prominent effect of the regenerated ammonium on the δ15N of PON. But in BOB, in general, high
10
new production has been observed by us during both post- (4 mmol N m−2d−1) and pre- (6.6 mmol N m−2d−1) monsoon during the two cruises. Therefore, regenerated ammonium is likely to have played a limited role in observed δ15N of PON. However, significant ammonium contributions cannot be ruled out for three locations in the open ocean during post-monsoon and at one location during pre-monsoon, where values
15
higher than 6‰ have been observed.
The nitrate from deeper water is a known source of nutrients in the Indian Ocean for planktons (Vinaychandran and Mathew, 2003); however, its possible imprint on δ15N of PON and related fractionation mechanism could only be estimated if the nitrate δ15N is known. But, as in the case of ammonium, nitrate δ15N has also not been measured in
20
the Bay. δ15N values of 3–7‰ have been reported for nitrate in deeper waters lacking significant column denitrification as in BOB (Miyake and Wada, 1967; Cline and Ka-plan, 1975). The average value reported here for δ15N of PON in open ocean during both post- and pre-monsoon seasons (5.3 and 4%) are found to be of similar magni-tude. However, the observed variability can be explained in two different ways: first,
25
the rapid uptake of the nitrate without fractionation (with changing source isotopic com-position) and second, the fractionation of nitrate during uptake by the phytoplankton. In the first scenario, the consumption of nitrate has to be fast enough for little or no isotopic fractionation and the original δ15N of nitrate would be reflected in the δ15N of
BGD
1, 87–105, 2004 Natural isotopic composition of nitrogen S. Kumar et al. Title Page Abstract Introduction Conclusions References Tables Figures J I J I Back Close Full Screen / EscPrint Version Interactive Discussion
© EGU 2004
PON (Altabet and McCarthy, 1985; Wada and Hattori, 1991). In this case, complete consumption of nitrate from the surface would be expected. The open ocean stations during post monsoon shows virtually absence of nitrate (below the level of detection; Fig. 2) from the surface in most open ocean stations during post-monsoon, implying its complete consumption. δ15N of PON at these locations shows a general increase in
5
δ15N of from south to north, indicating the existence of deeper nitrate with higher δ15N at southern locations.
The δ15N of pre-monsoon locations vary from 2.7 to 7‰ with relatively higher surface nitrate concentration (0.2 to 1.1 µM). The availability of nitrate pool in the surface water suggests the luxury of phytoplankton to discriminate and hence the fractionation during
10
uptake of nitrate by the planktons during pre-monsoon. The exact mechanism by which these nutrients reach the surface in the open Bay during pre-monsoon is a subject of speculation. However, nitrate for coastal locations during pre-monsoon might have been supplied by the EICC acting north of about 10◦N. The EICC is best developed during March–April and decays only by June (Shetye et al., 1993).
15
Overall, the δ15N values of PON in the surface waters observed in the Bay may be explained in terms of a two end-member mixing: first, the terrestrial particulate matter with low δ15N which has mostly influenced the six coastal locations and three open ocean locations during post-monsoon, and the other, marine phytoplankton, which has mainly inherited the higher δ15N of nitrate from deeper waters.
20
5.2. Depth profile of δ15N suspended matter
The depth related distribution of δ15N in suspended matter is in agreement with the general pattern observed in the world ocean i.e. it increases with depth (Saino and Hattori, 1980). At most locations there is an increase in δ15N below 60 m. This in-crease is 0.21 to 2.8‰ between 60 and 300 m. High δ15N below euphotic depth has
25
been observed mainly due to two reasons: (1) degradation of suspended matter itself causing the preferential release of14N leaving the remaining PON enriched in15N. (2) The PON below euphotic depth is produced due to fragmentation of sinking particles
BGD
1, 87–105, 2004 Natural isotopic composition of nitrogen S. Kumar et al. Title Page Abstract Introduction Conclusions References Tables Figures J I J I Back Close Full Screen / EscPrint Version Interactive Discussion
© EGU 2004
(Bacon et al., 1985). These sinking particles are enriched in δ15N by 3–4‰ relative to suspended particle in euphotic zone because these particles are formed as a by-product of zooplankton feeding, causing an increase in δ15N with each trophic step (DeNiro and Epstein, 1981). There is no data regarding δ15N of sinking particles for BOB for 300 or 500 m depths. However, the sediment traps placed at around 2000 m
5
show the δ15N variation in the range of 2.2–6.2‰ (Schafer and Ittekkot, 1995). But
δ15N of deeper PON (∼2000 m) is known to be less (Saino and Hattori, 1987) and starts decreasing below 500 m. Based on this argument the δ15N of sinking particles around 300 m during present study should be more than 6‰. Saino and Hattori (1980) have found the δ15N is high as ∼12‰ at 300 m depth in the far eastern Indian Ocean.
10
However our data suggest the average value of ∼6‰ for BOB at the same depth. This may be due to the high sinking rate of particles in the BOB allowing it lesser time for degradation. Here, the particle removal to the deep sea occurs in the form of large aggregates formed by the interaction of organic and mineral matter introduced from external sources like rivers and wind. This increases the density and consequently
15
the settling rate in water column (Ittekkot, 1991). Minima in the δ15N of PON within the surface layer as reported by Saino and Hattori (1980), have been observed during present study too, possibly due to the isotopic fractionation during nitrate uptake in light limited conditions.
6. Conclusions
20
First systematic measurements of δ15N of surface PON in BOB shows it to be a two end-member mixing between continental input and marine phytoplankton. δ15N values in surface PON of open ocean locations during both pre- and post-monsoon seasons and coastal location during pre-monsoon season is primarily supported by nutrients of marine origin. However, during post-monsoon coastal locations as well as northern
25
open ocean stations appear to be influenced by the continental run off as is evident by the salinity and δ15N dilution at these locations. The depth dependent increase in
BGD
1, 87–105, 2004 Natural isotopic composition of nitrogen S. Kumar et al. Title Page Abstract Introduction Conclusions References Tables Figures J I J I Back Close Full Screen / EscPrint Version Interactive Discussion
© EGU 2004
δ15N of suspended PON appears to be a general feature. This increase to a maximum of 2.8‰ is lower than that observed for the eastern Indian Ocean (Saino and Hattori, 1980) possibly due to the high settling rates of sinking particles in BOB due to formation of organic and mineral aggregates.
Acknowledgements. We thank M. Madhupratap (deceased), co-ordinator, BOBPS and
5
S. Prasanna Kumar, Chief Scientist, SK-182 and SK-191, for the opportunity to participate in the cruises. We also thank the Department of Ocean Development for providing the ship time to carry out this work, funded by ISRO-GBP, Department of Space, Government of India.
References
Altabet, M. A. and McCarthy, J. J.: Temporal and spatial variations in the natural abundance of
10 15
N in PON from warm core ring, Deep Sea Res., Part A, 32, 755–772, 1985.
Altabet, M. A.: Variations in nitrogen isotopic composition between sinking and suspended particles: Implications for nitrogen cycling and particle transformation in the open ocean, Deep Sea Res., Part A, 35, 535–554, 1988.
Altabet, M. A. and Francois, R.: The use of nitrogen isotopic ratio for reconstruction of past
15
changes in the surface ocean nutrient utilization, Carbon Cycling in the Glacial Ocean: Con-straints on the Ocean’s Role in Global Change, edited by Zahn, R., Kaminski, M. A., Labeyrie, L., and Pederson, T. F., Springer-Verlag, New York, 281–306, 1994.
Altabet, M. A.: Nitrogen and carbon isotopic tracers of the source and transformation of parti-cles in the deep sea, Particle Flux in the Ocean, edited by Ittekkot, V., Schafer, P., Honjo, S.,
20
and Depetris, P. J., John Wiley, New York, 155–184, 1996.
Bacon M. P., Huh, C. A., Fleer, A. P., and Deuser, W. G.: Seasonality in the flux of natural radionuclides and plutonium in the deep Sargasso Sea, Journal of Marine Research, 44, 185–201, 1985.
Cline, J. D. and Kaplan, I. R.: Isotopic fractionation of dissolved nitrate during denitrification in
25
the eastern tropical North Pacific Ocean, Mar. Chem., 3, 271–299, 1975.
DeNiro, M. J. and Epstein, S.: Influence of diet on the distribution of nitrogen isotopes in ani-mals, Geochimica et Cosmochimica Acta, 45, 341–351, 1981.
BGD
1, 87–105, 2004 Natural isotopic composition of nitrogen S. Kumar et al. Title Page Abstract Introduction Conclusions References Tables Figures J I J I Back Close Full Screen / EscPrint Version Interactive Discussion
© EGU 2004
Dugdale, R. C. and Goering, J. J.: Uptake of new and regenerated forms of nitrogen in primary productivity, Limnol. Oceanogr., 12, 196–206, 1967.
Farrell, J. W., Pederson, T. F., Calvert, S. E., and Nielsen, B.: Glacial-interglacial changes in nutrient utilization in equatorial Pacific Ocean, Nature, 377, 514–517, 1995.
Ittekkot, V.: Particle flux studies in the Indian Ocean, Eos, 72, 527–530, 1991.
5
Mariotti, A., Lancelot, C., and Billen, G.: Natural isotopic composition of nitrogen as a tracer of origin for suspended organic matter in the Scheldt estuary, Geochim. Cosmochim. Acta, 48, Oxford, 549–555, 1984.
Minagawa, M. and Wada, E.: Nitrogen isotope ratios of red tide organisms in the East Chine Sea: A characterization of biological nitrogen fixation, Mar. Chem., 19, 245–259, 1986.
10
Mino, Y., Saino, T., Suzuki, K., and Maranon, E.: Isotopic composition of suspended particu-late nitrogen (δ15Nsus) in surface waters of the Atlantic Ocean from 50
◦
N to 50◦S, Global Biogeochemical Cycles, 16, 4, 1059, 2002.
Miyake, Y. and Wada, E.: The abundance ratio of 15N/14N in marine environments, Rec. Oceanogr. Works Jpn. 9, 37–53, 1967.
15
Miyake, Y. and Wada, E.: The isotope effect on the nitrogen in biochemical, oxidation-reduction reactions, Rec. Oceanogr. Works Jpn., 11, 1–6, 1971.
Montoya, J. P. and McCarthy, J. J.: Isotopic fractionation during nitrate uptake by phytoplankton grown in continuous culture, J. Plankton Res., 17 439–464, 1995.
Owens, N. J. P. and Rees, A. P.: Determination of nitrogen-15 at sub-microgram levels of
20
nitrogen using automated continuous-flow isotope ratio mass spectrometer, Analyst, 114, 1655–1657, 1989.
Prasanna Kumar, S., Muraleedharan, P. M., Prasad, T. G., Gauns, M., Ramaiah, N., De Souza, S. N., Sardesai, S., and Madhupratap, M.: Why the Bay of Bengal less productive during summer monsoon compared to the Arabian Sea?, Geophys. Res. Lett., 29, 1029, 2002.
25
Rau, G. H., Low, C., Pennington, J. T., Buck, K. R., and Chavez, F. P.: Suspended particulate nitrogen δ15N versus nitrate utilization: Observations in Montery Bay, CA, Deep Sea Res., Part II, 45, 1603–1616, 1998.
Saino, T. and Hattori, A.: 15N natural abundance in oceanic suspended particulate matter, Nature, 283, 752–754, 1980.
30
Saino, T. and Hattori, A.: Geographical variation of the water column distribution of suspended particulate nitrogen and its15N natural abundance in the Pacific and its marginal seas, Deep Sea Research, 34, 807–827, 1987.
BGD
1, 87–105, 2004 Natural isotopic composition of nitrogen S. Kumar et al. Title Page Abstract Introduction Conclusions References Tables Figures J I J I Back Close Full Screen / EscPrint Version Interactive Discussion
© EGU 2004
Schafer, P. and Ittekkot, V.: Isotopic biogeochemistry of nitrogen in the northern Indian Ocean, Mitt. Geol.-Palaont. Inst. Univ. Hamburg, 78, 67–93, 1995.
Shetye, S. R., Shenoi, S. S. C., Gouveia, A. D., Michael, G. S., Sundar, D., and Nampoothiri, G.: Wind-driven coastal upwelling along the western boundary of the Bay of Bengal during the southwest monsoon, Cont. Shelf Res., 11, 1397–1408, 1991.
5
Shetye, S. R., Gouveia, A. D., Shenoi, S. S. C., Sundar, D., Michael, G. S., and Nampoothiri, G.: The western boundary current of the seasonal subtropical gyre in the Bay of Bengal, J. Geophys. Res., 98, 945–954, 1993.
Subramanian, V.: Sediment load of Indian Rivers, Current Science, 64, 928–930, 1993. Sweeney, R. E., Liu, K. K., and Kaplan, I. R.: Oceanic nitrogen isotopes and their use in
10
determining the source of sedimentary nitrogen, in: Stable isotopes in the earth sciences, edited by Robinson, B. W., DSIR 220 New Zealand dept. Scientific and industrial, Wellington, 9–26, 1978.
Unger, D., Ittekkot, V., Schafer, P., Tiemann, J., and Reschke, S.: Seasonality and interan-nual variability of particle fluxes to the deep Bay of Bengal: influence of riverine input and
15
oceanographic processes, Deep Sea Res. II 50, 897–923, 2003.
Vinaychandran, P. N. and Mathew, S.: Phytoplankton bloom in the Bay of Bengal during the northeast monsoon and its intensification by cyclones, Geophys. Res. Lett., 30, (11), 1572, doi:10.1029/2002GL016717, 2003.
Wada, E., Miyazaki, T., and Hattori, A.: 15N abundance in nitrogenous compounds in the sea,
20
Proc. 1971 Fall Meet. Oceanogr. Soc. Japan, 227, 1971.
Wada, E. and Hattori, A.: Natural abundance of15N in particulate organic matter in the North Pacific Ocean, Geochim. Cosmochim. Acta, 40, 249–251, 1976.
Wada, E. and Hattori, A.: Nitrogen isotope effects in the assimilation of inorganic nitrogenous compounds by marine diatoms, Geomicrobiol. J., 1, 85–101, 1978.
25
Wada, E. and Hattori, A.: Nitrogen in the sea: Forms, Abundances, and rate processes, CRC Press, Boca Raton, Fla, 208, 1991.
BGD
1, 87–105, 2004 Natural isotopic composition of nitrogen S. Kumar et al. Title Page Abstract Introduction Conclusions References Tables Figures J I J I Back Close Full Screen / EscPrint Version Interactive Discussion © EGU 2004 1 24 13 9 5 17 21 75 80 85 90 95 100 100 95 90 85 80 75 5 20 15 10 5 10 15 20 3 7 11 19 15
Longitude (oE)
La
ti
tu
d
e (
o
N)
BGD
1, 87–105, 2004 Natural isotopic composition of nitrogen S. Kumar et al. Title Page Abstract Introduction Conclusions References Tables Figures J I J I Back Close Full Screen / EscPrint Version Interactive Discussion
© EGU 2004
Fig. 2. The surface nitrate concentrations at different stations during post- (dark bars) and
BGD
1, 87–105, 2004 Natural isotopic composition of nitrogen S. Kumar et al. Title Page Abstract Introduction Conclusions References Tables Figures J I J I Back Close Full Screen / EscPrint Version Interactive Discussion
© EGU 2004
Fig. 3. The relationship between δ15N and PON during post- (filled circles and squares rep-resent open ocean and coastal stations) and pre-monsoon (open circle and squares reprep-resent open ocean and coastal stations).
BGD
1, 87–105, 2004 Natural isotopic composition of nitrogen S. Kumar et al. Title Page Abstract Introduction Conclusions References Tables Figures J I J I Back Close Full Screen / EscPrint Version Interactive Discussion
© EGU 2004
Fig. 4. The depth profiles of δ15N and PON for pre-monsoon season at different locations. The filled and unfilled circles indicate δ15N and PON, respectively.
BGD
1, 87–105, 2004 Natural isotopic composition of nitrogen S. Kumar et al. Title Page Abstract Introduction Conclusions References Tables Figures J I J I Back Close Full Screen / EscPrint Version Interactive Discussion
© EGU 2004
Fig. 5. The relationship between salinity and δ15N for pre- and post-monsoon seasons. The annotations are same as Fig. 2.