HAL Id: hal-00317622
https://hal.archives-ouvertes.fr/hal-00317622
Submitted on 30 Mar 2005
HAL is a multi-disciplinary open access
archive for the deposit and dissemination of
sci-entific research documents, whether they are
pub-lished or not. The documents may come from
teaching and research institutions in France or
abroad, or from public or private research centers.
L’archive ouverte pluridisciplinaire HAL, est
destinée au dépôt et à la diffusion de documents
scientifiques de niveau recherche, publiés ou non,
émanant des établissements d’enseignement et de
recherche français ou étrangers, des laboratoires
publics ou privés.
events using data from Wind perigee passes
K. Sigsbee, J. A. Slavin, R. P. Lepping, A. Szabo, M. Øieroset, M. L. Kaiser,
M. J. Reiner, H. J. Singer
To cite this version:
K. Sigsbee, J. A. Slavin, R. P. Lepping, A. Szabo, M. Øieroset, et al.. Statistical and superposed epoch
study of dipolarization events using data from Wind perigee passes. Annales Geophysicae, European
Geosciences Union, 2005, 23 (3), pp.831-851. �hal-00317622�
SRef-ID: 1432-0576/ag/2005-23-831 © European Geosciences Union 2005
Annales
Geophysicae
Statistical and superposed epoch study of dipolarization events
using data from Wind perigee passes
K. Sigsbee1, J. A. Slavin2, R. P. Lepping2, A. Szabo2, M. Øieroset3, M. L. Kaiser2, M. J. Reiner4, and H. J. Singer5 1Department of Physics and Astronomy, University of Iowa, Iowa City, Iowa, 52242 USA
2Laboratory for Extraterrestrial Physics, NASA Goddard Space Flight Center, Greenbelt, Maryland 20771, USA 3Space Sciences Laboratory, University of California, Berkeley, California, USA
4The Catholic University of America, Washington, D.C., 20064, USA 5NOAA Space Environment Center, Boulder, Colorado, 80305 USA
Received: 5 August 2004 – Revised: 23 November 2004 – Accepted: 15 December 2004 – Published: 30 March 2005
Abstract. From 1995 to 2000, the Wind spacecraft spent over 500 h in the magnetotail, much of it within ∼2×10⁴km of the predicted location of the neutral sheet. Wind passed through the near magnetotail at distances of −15 RE<X GSM<−6 RE on 35 occasions. Another 10 passes took place at distances of −30 RE<XGSM<−15 RE. We identi-fied 65 dipolarization events in the Wind magnetic field data set between Y GSM∼−16 and +16 RE based upon our re-quirements that the magnetic field inclination had to change by more than 15◦, the maximum inclination angle had to be greater than 20◦, and the inclination angle had to increase by a factor of at least 1.5. Most of the dipolarization events occurred in the pre-midnight region of the magnetotail and were accompanied by earthward flows with speeds greater than 100 km/s. The properties of the dipolarization events did not depend upon the Y GSM position. However, they did vary with the distance to the neutral sheet. Isolated dipolar-ization events, defined as occurring more than 20 min apart, were characterized by a decrease in BxGSM and BT OT AL, and an increase in Bz GSM and the magnetic field inclina-tion. Dipolarizations that occurred as part of a series of small dipolarizations spaced less than 20 min apart were charac-terized by a transient increase in BzGSM and the magnetic field inclination, but no significant change in Bx GSM and
BT OT AL. The events consisting of a series of small dipolar-izations occurred predominantly near midnight. We interpret these results in terms of two different modes of magnetotail convection: 1) a classical substorm pattern featuring storage of magnetic energy in the tail lobes which is explosively re-leased at onset, and 2) a directly driven process.
Keywords. Magnetospheric physics (Storms and sub-storms; Magnetotail; Magnetospheric configuration and dynamics)
Correspondence to: K. Sigsbee
1 Introduction
Substorms result from a complex set of interactions between the ionosphere, the magnetosphere, and the solar wind that usually involve the storage of energy and magnetic flux in the tail lobes and its explosive release at the onset of the sub-storm expansion phase. The signatures observed by satellites in various regions of the night-side magnetosphere during a typical substorm include bursts of high-speed earthward and tailward plasma flow, magnetic field dipolarizations, low-frequency fluctuations of the electric and magnetic fields, the ejection of plasmoids, and energetic particle injections at geosynchronous orbit (e.g. Slavin et al., 2002; Nagai, 1982). Recent theories have suggested that the observations of dipo-larizations and earthward flows in the magnetotail may be re-lated to the formation of the substorm current wedge and the generation of the Pi2 pulsations observed by geosynchronous satellites and ground magnetometer stations (Shiokawa et al., 1998; Kepko and Kivelson, 1999, 2001). In this paper, we will use data from passes of the Wind spacecraft through the magnetotail to study the extent of the region where magnetic field dipolarizations are observed. We will also examine the properties of dipolarization events as a function of location and compare the characteristics of isolated dipolarizations and dipolarizations that occurred as part of a series of small, closely spaced dipolarizations.
Investigations of the effects of earthward flow bursts in the magnetotail during substorms by Hesse and Birn (1991) and Shiokawa et al. (1997, 1998) have suggested that the braking of high-speed earthward flows launched by reconnection at a near-Earth neutral line may be responsible for the generation of the substorm current systems and the Pi2 pulsations ob-served by satellites at geosynchronous orbit and by ground magnetometer stations at substorm onset. According to this picture of substorms, the high-speed flows launched by mag-netic reconnection at the near-Earth neutral line (NENL) carry large amounts of magnetic flux earthward, which even-tually starts to pile up in the near magnetotail region where the flows “brake” as they compress the inner magnetosphere.
This pile-up of magnetic flux is observed by spacecraft in the magnetotail as a magnetic field dipolarization. During dipo-larization, the magnetotail magnetic field undergoes a change from a tail-like magnetic field configuration to a more dipo-lar magnetic field configuration. As defined by Shiokawa et al. (1997, 1998), the braking point of high-speed earth-ward flows is the boundary between the plasma sheet and dipolar magnetic field regions at the inner edge of the neutral sheet. The deceleration of earthward flows in the magnetotail generates field-aligned currents through the pressure gradi-ents and the divergence of the dawnward inertial current. In a simulation performed by Birn et al. (1999) the flows were stopped over a distance of several RE and it was found that the contribution of the inertial current, which results from the coupling of the perpendicular fluid flow to the magnetic field, is almost an order of magnitude smaller than the cur-rents caused by pressure gradients. The curcur-rents generated by the pressure gradients respond to distortions of the mag-netic field and persist even after the flows cease. According to Shiokawa et al. (1998), Pi2 pulsations are also produced as the flows are decelerated, pressure gradients are created, and currents are generated.
Many studies have attempted to characterize magnetic field dipolarizations from geosynchronous orbit out to ra-dial distances near 30 RE. Data from the GOES family of geosynchronous spacecraft have shown that the magnetic field configuration at geosynchronous orbit becomes more tail-like before substorm onset (Nagai, 1982, 1991). This change is thought to be caused by an intensification and/or an inward motion of the cross-tail current associated with the storage of energy in the magnetotail during the substorm growth phase (Kokubun and McPherron, 1981). At the on-set of the substorm expansion phase, the dipolarization at geosynchronous orbit begins in a narrow region centered on 23:30 LT (Nagai, 1991). As shown by Nagai (1982), the increase in the H component of the magnetic field (paral-lel to the Earth’s dipole axis and positive northward) associ-ated with dipolarization begins simultaneously with the sub-storm onset recorded by ground magnetometer data in the pre-midnight region. However, at local times more than 1 h away from the initial dipolarization onset, the magnetic field at geosynchronous orbit can still continue to become more tail-like until the dipolarization expands westward and east-ward. According to Nagai (1991), it takes 11 min for the dipolarization to expand eastward to 03:00 MLT, and 15 min for it to expand westward to 20:00 MLT.
A detailed study of magnetic field dipolarization events at larger radial distances was performed by Lopez et al. (1988) using magnetic field data from the AMPTE/CCE spacecraft, which had an apogee of 8.8 RE. In this study, 103 dipolar-ization events were identified from March to August 1985 when a ≥15◦ change in magnetic field inclination to the equatorial plane marked the transition from a tail-like field configuration to a more dipolar configuration. No dipolar-ization events were observed by AMPTE/CCE for geocen-tric radii ≤6.4 RE, suggesting that geosynchronous space-craft may sometimes be located too far earthward to observe
dipolarization events. Lopez et al. (1988) found that the number of dipolarization events observed by AMTPE/CCE increased with increasing radial distance from Earth and that the total magnetic field decreased during most of the AMTPE/CCE dipolarization events. The dipolarization events studied by Lopez et al. (1988) were distributed from 19.9 to 4.7 MLT, with a peak near midnight, which roughly corresponds to the region in which substorm activity and the substorm current wedge are thought to be initiated. Lopez et al. (1988) found the occurrence frequency of dipolariza-tion events was 4 times greater for Kp≥4+ than it was for
Kp≤3− and that the central meridian of the substorm cur-rent wedge shifts from pre-midnight to post-midnight as the intensity of geomagnetic activity increases.
More recently, Baumjohann et al. (1999) performed a su-perposed epoch study of dipolarization events using Geo-tail data from 11≤R≤31 RE and 0≤Y GSM≤10 RE. They found 66 dipolarizations in the Geotail data from 1995 to 1997 for which data from mid-latitude ground stations were also available to aid in the determination of the substorm on-set times. All of the events studied were from the central plasma sheet and were accompanied by high-speed earth-ward flows. Baumjohann et al. (1999) examined the aver-age properties of the magnetic field during dipolarization in 5 RE bins of radial distance and found that, on average, the magnetic field inclination to the equatorial plane increased by a factor of 2–3 during dipolarization. They also found that dipolarization occurs first between −16<X<−11 RE and then moves tailward at a rate of 35 km/s. According to Baumjohann et al. (1999), the tailward propagating dipolar-ization front typically reaches the vicinity of the near-Earth neutral line about 45 min after the onset of the substorm ex-pansion phase. Because magnetic reconnection cannot oper-ate in a dipolar magnetic field geometry, they concluded this marks the start of the substorm recovery phase.
2 Study objectives
Over the period from 1995 to 2000, the Wind spacecraft spent over 500 h in the region of the Earth’s magnetotail with Geocentric Solar Magnetospheric (GSM) coordinates of
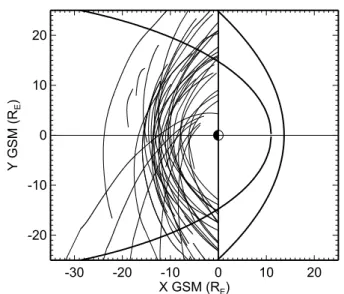
−18<X<−6 RE and −16<Y <16 RE. Figure 1 illustrates the Wind trajectories in the X−Y GSM plane for X<0 RE and −6 RE<Z<6 RE from 1995 to 2000. Throughout this paper, GSM coordinates will be used to describe the posi-tions of the Wind and GOES spacecraft, and for the mag-netic field and plasma parameters measured in space. The passes made by Wind through the magnetotail from 1995 to 2000 are unique in that they consisted largely of west to east traversals of the near-tail beyond geosynchronous orbit at low latitudes. These passes are well-suited to studying the east-west extent of the substorm current wedge and the asso-ciated bursty bulk flows in the plasma sheet (e.g. Slavin et al., 1997).
The first objective of our study of the Wind magnetotail passes was to measure the statistical east-west extent of the
substorm current wedge by examining the locations of mag-netic field dipolarization events using data from the Wind Magnetic Field Investigation (MFI) (Lepping et al., 1995). The second objective was to determine how the properties of the magnetic field dipolarization events vary as a function of local time and distance to the neutral sheet. The third objec-tive was to compare the properties of isolated dipolarization events to the properties of dipolarizations that occurred as part of a multiple dipolarization series. The characteristics of the dipolarization events that we examined included the change in the inclination of the magnetic field to the equato-rial plane and the change in the total magnetic field. We also used the Wind 3-DP plasma measurements (Lin et al., 1995) to investigate the relationship between high-speed earthward flow bursts and magnetic field dipolarization events. The fourth objective of our study was to examine the timing be-tween local observations of dipolarization events by Wind and substorm onset signatures. To accomplish this goal, we examined the intensity of auroral kilometric radiation (AKR) observed by the Wind WAVES instrument (Bougeret et al., 1995), and looked for dipolarizations in the GOES geosyn-chronous spacecraft magnetic field data. Magnetic field data from the CANOPUS network of ground magnetometers were also used when available.
3 Event selection
In the first round of dipolarization event selection, entire Wind passes through the magnetotail were scanned for dipo-larization event candidates with increases in the Bz compo-nent of the magnetic field and increases in the inclination angle of the magnetic field with respect to the X−Y plane. No limits on the Y position of the spacecraft were imposed during the initial selection, so that we could examine the full azimuthal extent of the substorm current wedge; however, only portions of the Wind orbit with X<−6.0 RE were con-sidered. The candidate events found by visually searching for increases in Bzand the magnetic field inclination were then screened to eliminate events where the change in magnetic field inclination was less than 15◦. This selection condition was used to study dipolarizations in the AMPTE/CCE data set (Lopez et al., 1988). We used additional selection con-ditions based upon the results of a superposed epoch study of dipolarizations observed by Geotail (Baumjohann et al., 1999). Based upon the average magnetic field inclinations found by Baumjohann et al. (1999) for dipolarizations at distances between −11<X<−16 REand −16<X<−21RE, we required that the maximum inclination angle had to be greater than 20◦and the ratio of the maximum to initial in-clination had to be greater than 1.5.
Because magnetic field dipolarization events and the flow bursts that accompany them are generally short-lived, sudden events, we also attempted to place conditions upon the rate of change of the magnetic field inclination during our dipolar-ization events. The durations of the earthward flow bursts and dipolarization events observed by Geotail at radial distances
-30 -20 -10 0 10 20 X GSM (RE) -20 -10 0 10 20 Y GSM(R E )
Fig. 1. Orbital trajectories of the Wind spacecraft in the X−Y plane for 1995 to 2000. The trajectory is shown only when X<0 REand
−6 RE<Z<6 RE.
Table 1. Dipolarization event selection conditions.
Change in magnetic field inclination >15◦
(Based upon Lopez et al., 1988)
Maximum inclination angle >20◦
(From the results of Baumjohann et al., 1999)
Ratio of maximum inclination to initial >1.5
inclination (From the result of Baumjohann et al., 1999)
Rate of change of the magnetic field >1.5◦/min
inclination (this paper)
of 10 to 13 RE were on the order of 5–10 min (e.g. Sigsbee et al., 2002; Fairfield et al., 1998; Nagai et al., 2000). A minimum rate of change in the magnetic field inclination of 1.5◦/min was initially chosen to aid in selecting Wind dipo-larization events, since it would produce the required mini-mum 15◦change in inclination over a 10-min time period. The condition on the minimum rate of change in the mag-netic field turned out to be redundant, as nearly all of the events which satisfied the first three conditions also satisfied this one. The selection conditions applied to the Wind dipo-larization event candidates in our study are summarized in Table 1. We identified 65 dipolarization events in the Wind magnetic field data set based upon these conditions. As we did not use any conditions based upon observations of global substorm activity to select the Wind dipolarization events, some of these dipolarization events may be pseudobreakups rather than full substorms. Wind also may not have been in the central plasma sheet during some of the events se-lected in this manner. To help clarify the difference between substorms and pseudobreakups, we categorized the dipolar-ization events as either isolated dipolardipolar-izations or part of a
series of closely spaced dipolarizations. Isolated events were defined as dipolarizations observed at least 20 min before or after other dipolarizations. Dipolarization events were con-sidered to be part of a series of multiple dipolarizations if they occurred less than 20 min apart.
4 Substorm onset indicators
One of the difficulties in studying substorms is choosing a measure of global substorm activity. Auroral kilometric ra-diation (AKR) is widely accepted as one indicator of auroral activity and substorms (e.g. Slavin et al., 2002). We decided to examine AKR observations from the Wind WAVES instru-ment during the Wind dipolarization events, since this is the one substorm indicator that was guaranteed to be available during all of the dipolarization events. AKR emissions cover a broad frequency range, so it is useful to examine a few se-lect frequency bands or to integrate the power observed over the AKR frequency range when studying substorms. Be-cause the frequencies at which AKR emissions first intensify were found to be highly variable during our dipolarization events, we chose to integrate AKR power over a broad fre-quency range.
Previous studies have integrated power in the AKR fre-quency range to construct a new index for geomagnetic ac-tivity. Murata et al. (1997) integrated Geotail Plasma Wave Instrument data from 50 kHz to 800 kHz to create an AKR index. The integrated AKR power index was normalized to a radial distance of 25 RE from Earth. Murata et al. (1997) found that their AKR index was proportional to Kp for Kp<4, and that there was a linear relation between the AKR index and Dst for 50<Dst<0 nT. Kurth et al. (1998), used integrated plasma wave data from Polar to create an AKR index. Their AKR index was normalized to a radial distance of 9 RE, which is the apogee of the Polar space-craft. Kurth et al. (1998) found a reasonable correlation be-tween the AKR index and CANOPUS CU-CL index. They concluded that the integrated AKR power is a good proxy for the AE index. To construct an AKR index using Wind, we integrated Wind WAVES RAD1 data between 50 kHz to 800 kHz. We normalized our AKR index to a radial distance of 14 RE, the average radial distance of the Wind dipolariza-tion events.
Coverage by high-latitude ground magnetometer stations and geosynchronous spacecraft was limited during most of the Wind dipolarization events, due to local time constraints on the relevance of these observations to substorms. How-ever, magnetic field data from the GOES 8 and 9 geosyn-chronous satellites in the night side magnetosphere were available during some of the Wind dipolarization events. In the case studies presented in this paper, data from the GOES geosynchronous satellites were used to examine the timing between the observations of dipolarizations and flow bursts at Wind with the start of the dipolarization at geosynchronous orbit. The properties of the dipolarizations, such as the
Bz increase and the increase in magnetic field inclination,
observed by Wind and by GOES 8 or 9, were also com-pared. Data from the CANOPUS ground magnetometer sta-tions in Canada were also available during the case studies. The CANOPUS ground magnetometer data were used to pro-vide an indication of closure of the substorm current wedge through the ionosphere.
5 Case studies
In this section, we will examine Wind data from four dif-ferent magnetotail passes when magnetic field data from the GOES 8 and 9 geosynchronous spacecraft and CANOPUS ground magnetometer stations were available. These case studies illustrate examples of isolated dipolarizations and multiple dipolarization series events using the criteria de-scribed in Sect. 3. Comparison of the Wind magnetic field and plasma observations during these events with observa-tions from GOES and the CANOPUS ground staobserva-tions will allow us to explore the relation between the magnetic field dipolarizations in the mid-tail and at geosynchronous orbit with the development of the substorm current wedge. 5.1 13 January 1996, 02:30–04:30 UT
Figure 2 shows AKR observed by Wind WAVES, the X (northward) component of the magnetic field measured at Fort Churchill in the CANOPUS ground magnetometer net-work, the GOES 8 magnetic field, the Wind magnetic field data, and Wind plasma data from 02:30 to 04:30 UT on 13 January 1996. Strong AKR emissions were observed by Wind throughout the time period shown in Fig. 2. At 02:51:00 UT, Wind observed a sudden intensification of the AKR emissions and the frequency range of the emissions extended to lower frequencies. The AKR data imply that intense auroral activity was already in progress more than 10 min before activity was observed by GOES 8, and 40 min before the dipolarization was observed by Wind. Starting at 02:00 UT, the magnetic field inclination angle at GOES 8 steadily decreased from an initial value of 55◦to a value of 30◦ at 03:00 UT. The decrease of the magnetic field incli-nation observed by GOES 8 indicates stretching of the near magnetotail during the growth phase (Nagai, 1982). Shortly after 03:00 UT, the Bzcomponent of the magnetic field and inclination angle at GOES 8 began to increase. GOES 8 was located near 22:02 LT at (−5.3, 3.6, −1.7) RE when the dipolarization was observed at 03:02:25 UT. The dipo-larization at GOES 8 is marked by a dotted line in Fig. 2. The magnetic field inclination at GOES 8 reached a peak value of approximately 70◦ at 03:43:30 UT. The GOES 9 spacecraft was located on the dusk flank near 18:00 LT at
(0.13, 6.56, 0.90) RE, where it observed low-frequency fluc-tuations of the magnetic field, but did not see a clear dipolar-ization signature.
An isolated dipolarization event was observed by the Wind spacecraft starting at 03:30:43 UT and is marked by the solid black line in Fig. 2. Prior to the start of the magnetic
field dipolarization, Wind was located near 21:42 LT at
(−10.4, 7.2, 0.8) RE, in a quiet, tail-like region of the mag-netic field, as indicated by the large, steady value of Bx and the small value of Bz. These magnetic field signatures are similar to the growth phase signatures observed by GOES 8 prior to the start of the dipolarization at geosynchronous or-bit. The magnetic field inclination to the equatorial plane at Wind was less than 5◦before the start of the magnetic field dipolarization. At the start of the magnetic field dipolariza-tion, Wind observed a decrease in Bxand the total magnetic field, while Bzbegan to increase. At 03:50:52 UT the mag-netic field inclination to the equatorial plane at Wind reached a maximum value close to 30◦. Large amplitude fluctuations of the magnetic field were also observed after the start of the magnetic field dipolarization, similar to fluctuations of the magnetic field observed during dipolarizations by Geo-tail (Sigsbee et al., 2002; Nagai et al., 2000). Although Wind was located close to the equatorial plane during this event, the 3-DP plasma data indicate that the spacecraft was situ-ated outside of a thinned plasma sheet before the dipolariza-tion. A sudden increase in the plasma beta was recorded just after 03:40 UT, indicating that the plasma sheet had finally expanded over the spacecraft. The increase in the plasma beta was due to a slight decrease in the magnetic pressure and a sudden increase in the ion pressure by about a factor of 100. The total pressure at Wind’s location in the mag-netotail was dominated by the contribution of the magnetic pressure, so that the total pressure decreased only slightly during this dipolarization. The maximum earthward flow of 315 km/s was observed by Wind at 03:45:34 UT, shortly af-ter the plasma sheet expanded over the spacecraft, and near the time of the maximum magnetic field inclination to the equatorial plane. Although the earthward flows had a com-ponent parallel to the magnetic field, the comcom-ponent of the flows perpendicular to the magnetic field dominated during the largest earthward flow bursts.
The observations from Wind, at geosynchronous orbit, and on the ground, on 13 January 1996, show that even when an isolated dipolarization is observed in the near magnetotail, the timing of the local magnetotail reconfiguration relative to other onset signatures can be complicated. This could be due to the difference in the locations of the Wind and GOES spacecraft, and the manner in which the dipolariza-tion spreads in local time and distance down the magnetotail. Comparison of the Wind and GOES 8 dipolarizations ap-pear to indicate that the activity started close to midnight and then spread in local time. Similar conclusions were reached in the studies performed by Lopez et al. (1988) and Nagai (1991). However, it is not entirely clear how this expan-sion progressed. According to Nagai (1991), if the substorm onset occurs at midnight, a geosynchronous spacecraft near 22:00 MLT should see the dipolarization start less than 5 min after the onset. The dipolarization reached GOES 8 about 20 min after the AKR intensification and about 30 min be-fore the dipolarization was observed by Wind. GOES 8 was located 20 min in local time closer to midnight than Wind, which could account for the observation of the dipolarization
100 1000 WindW A VES Freq.(kHz) 100 1000 0 50 dB 7200 7400 7600 7800 8000 8200 FortChurchill BX(nT) 0 20 40 60 80 100 GOES8 MagneticField(nT) BX BZ BTOTAL 0 20 40 60 80 100 GOES8Incl. Angle(degrees) 0 20 40 60 80 Wind MagneticField(nT) BX BZ BTOTAL 0 10 20 30 40 WindIncl. Angle(degrees) 0.001 0.010 0.100 1.000 Wind PlasmaBeta 21.3 -9.7 8.3 0230 21.5 -10.1 7.7 0300 21.7 -10.5 7.1 0330 22.0 -10.9 6.4 0400 22.2 -11.3 5.7 0430 -200 -100 0 100 200 300 400 WindVXGSM (km/s) VX LT X Y hhmm 1996 Jan 13
Wind ( ) GOES 8 ( ) January 13, 1996
21.5 LT-23.6 LT 0.001 0.010 0.100 1.000 10.000 Pressure(nPa) Pmag Pion $ VX T
Fig. 2. Wind, CANOPUS and GOES 8 data from 02:30 to 04:30 UT on 13 January 1996. From top to bottom, Fig. 2 shows the Wind WAVES RAD1 receiver data, the X (northward) component of the magnetic field measured at Fort Churchill, the total magnetic field (black) measured by GOES 8, the Bx(red) and Bz(green)
compo-nents of the magnetic field measured by GOES 8, the magnetic field inclination at GOES 8, the total magnetic field (black) measured by Wind, the Bx(red) and Bz(green) components of the magnetic
field measured by Wind, the magnetic field inclination at Wind, the Wind plasma beta (black), the Wind ion (red) and magnetic (green) pressures, and the X component of the flow velocity at Wind. The component of Vx perpendicular to the magnetic field is shown in
red and the total Vxis shown in black. An isolated dipolarization
event was observed by the Wind spacecraft starting at 03:30:43 and is marked by the solid black line. The start of the dipolarization ob-served by GOES 8 is marked by a dotted line. GOES 8 was located between 21.5 LT to 23.6 LT for the time period shown in the figure.
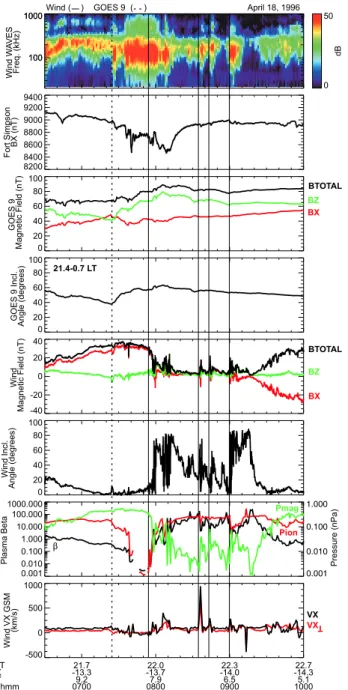
100 1000 WindW A VES Freq.(kHz) 100 1000 0 50 dB 8200 8400 8600 8800 9000 9200 9400 FortSimpson BX(nT) 0 20 40 60 80 100 GOES9 MagneticField(nT) BX BZ BTOTAL 0 20 40 60 80 100 GOES9Incl. Angle(degrees) -40 -20 0 20 40 Wind MagneticField(nT) BX BZ BTOTAL 0 20 40 60 80 100 WindIncl. Angle(degrees) 0.001 0.010 0.100 1.000 10.000 100.000 1000.000 Wind PlasmaBeta 21.7 -13.3 9.2 0700 22.0 -13.7 7.9 0800 22.3 -14.0 6.5 0900 22.7 -14.3 5.1 1000 -500 0 500 1000 WindVXGSM (km/s) LT X Y hhmm 1996 Apr 18
Wind ( ) GOES 9 ( ) April 18, 1996
21.4-0.7 LT VX VX T 0.001 0.010 0.100 1.000 Pressure(nPa) Pmag Pion $
Fig. 3. Wind, CANOPUS and GOES 9 data from 06:30 to 10:00 UT on 18 April 1996. Figure 3 is the same format as Fig. 2, except that the X component of the magnetic field from Fort Simpson is shown in the second panel and data from the GOES 9 geosynchronous satellite are shown. GOES 9 was located between 21.4 LT to 0.7 LT for the time period shown in the figure.
at GOES 8 before dipolarization started at Wind. However, this is not consistent with the Nagai (1991) study, which showed that it only takes about 30 min for a dipolarization at geosynchronous orbit to expand duskward from midnight to 18:00 MLT and about 15 min to expand dawnward to 04:00 MLT. Although the propagation and expansion of the dipolarization may change with radial distance, the differ-ence between Wind and GOES 8 in local time seems to be
too small to account for the 30-min delay in the start of dipo-larization at Wind. It is interesting to note that the magnetic field inclination reached its peak values at both Wind and GOES 8 around 03:40–03:50 UT, even though the dipolar-ization at GOES 8 started 30 min earlier than the dipolariza-tion at Wind. A negative bay developed at Fort Churchill in the CANOPUS ground magnetometer network a few min-utes after the dipolarization occurred at Wind. There was a slight intensification in emissions at the lower end of the AKR frequency range associated with the dipolarization at Wind. These signatures indicate that the dipolarization at Wind represented a local intensification in the current sys-tem, rather than a new substorm onset.
5.2 18 April 1996, 06:30–10:00 UT
Figure 3 shows AKR observed by Wind WAVES, the X (northward) component of the magnetic field measured at Fort Simpson in the CANOPUS ground magnetometer net-work, the magnetic field measured at GOES 9, the magnetic field measured by Wind, and Wind plasma data for the dipo-larization events that occurred between 06:30 and 10:00 UT on 18 April 1996. This was a very active day, with a to-tal of six dipolarizations observed by Wind from 05:00 to 11:00 UT which met the selection criteria in Table 1. Some of the dipolarizations observed by Wind on 18 April 1996 were separated by at least 20 min from preceding or suc-ceeding dipolarizations and were classified as isolated events (dipolarizations at 05:24 UT, 07:54 UT, and 10:31 UT), while others were classified as part of a multiple dipolarization se-ries (dipolarizations at 08:34 UT, 08:43 UT, and 08:59 UT). During the large flow bursts associated with the 07:54 UT and 08:34 UT dipolarizations, the component of Vx perpen-dicular to the magnetic field (red trace in the last panel of Fig. 3) was quite large, although there was also a parallel component to these flow bursts. The earthward flow ve-locities were quite small (<300 km/s) during the last three dipolarization events, even though plasma beta values greater than 1 indicated that Wind was located in the plasma sheet. However, the inclination angles still increased by more than a factor of 2 during these dipolarizations, and the maximum inclination angles reached were between 50◦and 90◦. A pos-sible explanation is that Wind was not located in the center of the flow channel, but was close enough to observe the magnetic field perturbations associated with the earthward transport of magnetic flux by the flows. This may be the most likely explanation since other studies (e.g. Angelopou-los et al., 1996, 1997a,b; Nakamura et al., 2004) have argued that flow bursts tend to occur in very localized regions of the magnetotail.
The time period from 07:00 to 10:00 UT on 18 April 1996 has also been examined in detail by Slavin et al. (1997), who compared the timing of the dipolarizations observed by Wind, Geotail, and GOES 9. The Wind WAVES instrument observed an intensification in AKR emissions from 07:33 UT to 08:10 UT. A negative bay was observed at Fort Simpson in the CANOPUS ground network simultaneously with the
AKR intensification. GOES 9 was located near 22:16 LT at
(−5.9, 2.7, 0.8) REwhen it observed a magnetic field dipo-larization at 07:24:30 UT, just before the start of the AKR intensification. The magnetic field inclination at GOES 9 in-creased from an initial value of 37.9◦to a maximum value of 63.3◦at 08:06:30 UT. At 07:54:07 UT, Wind was located near 21:55 LT at (−13.7, 7.7, 1.2) REwhen an isolated dipo-larization was observed. A few minutes earlier at 07:52 UT, a series of dipolarizations and earthward flow bursts were ob-served by Geotail near midnight and X=−12.5 RE (Slavin et al., 1997). The complicated timing between the dipolar-izations observed by Wind, Geotail, and GOES 9 was inter-preted by Slavin et al. as evidence for spatially localized, but temporally overlapping flow bursts in the near magnetotail. They suggested that the combined effects of the magnetic flux transported by these overlapping flow bursts caused the dipolarization observed by GOES 9 at geosynchronous orbit. Although the data presented by Slavin et al. (1997) showed that this substorm was a complex event with multiple ac-tive regions in the near magnetotail, the properties of the 07:54:07 UT dipolarization observed by Wind were similar to the other isolated dipolarizations studied. Before the start of this dipolarization, Wind was located in a region of tail-like magnetic field, as evidenced by the large Bxcomponent and the small By and Bz components of the magnetic field. The magnetic field inclination at Wind was only 3.6◦before the dipolarization started. A decrease in the Wind plasma beta before the start of this dipolarization indicated thinning of the plasma sheet. The decrease in the plasma beta during the growth phase was caused mainly by a gradual increase in the magnetic pressure from about 0.1 nPa at 06:30 UT to about 0.5 nPa, just before the start of the dipolarization. A sudden decrease in the ion pressure from about 0.1 nPa at 07:40 UT to about 0.001 nPa at 07:50 UT also contributed to the decrease in the plasma beta just before the start of the dipolarization. At the start of the dipolarization, fluctuations of the magnetic field were observed, along with a decrease in
Bxand the total magnetic field, and an increase in Bzand the magnetic field inclination. The sudden increase in the plasma beta at the start of the dipolarization, indicating expansion of the plasma sheet back over the spacecraft, resulted from a decrease in the magnetic pressure and sudden increase in the ion pressure. At 08:08:01 UT, the magnetic field inclination angle at Wind reached a maximum value of 82.5◦. Earth-ward flows greater than 400 km/s were observed by Wind at 08:06 UT, just before the maximum magnetic field inclina-tion was reached.
Although the dipolarization started about 30 min earlier at GOES 9 than at Wind, the maximum inclination angle was reached at GOES 9 only about 1.5 min before the maximum inclination angle was reached at Wind. In both this dipolar-ization and the 13 January 1996 case study, the maximum inclination angle was reached at geosynchronous orbit only 1–2 min after the maximum earthward flow was observed by Wind, even though the magnetic field inclination at geosyn-chronous orbit began to increase much earlier than it did at Wind. The delay between the start of dipolarization at GOES
and Wind during these events could be explained by the grad-ual formation of a region of high pressure and dipolarized magnetic field near geosynchronous orbit due to the effects of overlapping flow bursts in the magnetotail on the inner magnetosphere.
The 07:54 UT dipolarization observed by Wind was fol-lowed by a series of three smaller, closely spaced dipolar-izations at 08:34 UT, 08:43 UT, and 08:59 UT. These three dipolarizations were interpreted as occurring during the sub-storm recovery phase by Slavin et al. (1997). In our study of dipolarizations, we labeled these three dipolarizations as part of a multiple dipolarization series, since they were spaced less than 20 min apart. These dipolarizations were not ob-served by the GOES 8 or GOES 9 spacecraft; however, they were associated with brief intensifications in AKR emissions and fluctuations in the magnetic field at Wind. These three dipolarizations were different from the isolated dipolariza-tions on 18 April 1996, as they did not show a typical growth phase period characterized by a thinned plasma sheet before the dipolarization. Wind remained in the plasma sheet for the entire time period between 08:30 and 09:30 UT, as indicated by the plasma beta. Between 08:30 and 09:30 UT, the ion pressure and total pressure remained nearly constant around 0.2 nPa. However, slight decreases in the ion pressure and total pressure occurred during the 08:59 UT dipolarization. Fluctuations in the plasma beta from 08:30 to 09:30 UT were caused by fluctuations of the magnetic pressure between val-ues of 0.001 to 0.1 nPa. Bx and the total magnetic field were small (∼ a few nT) before the start of the 08:34 UT, 08:43 UT, and 08:59 UT dipolarizations. The change in mag-netic field inclination was due mainly to the increase in Bz, and not due to a decrease in Bx or the total magnetic field. This is fairly typical behavior for the dipolarizations that oc-curred as part of a multiple dipolarization series in our study, which will also be described during the discussion of the 26 July 1997 dipolarization events in Sect. 5.4, and in the results of the superposed epoch study described in Sect. 6.3. 5.3 10 May 1996, 03:30–05:30 UT
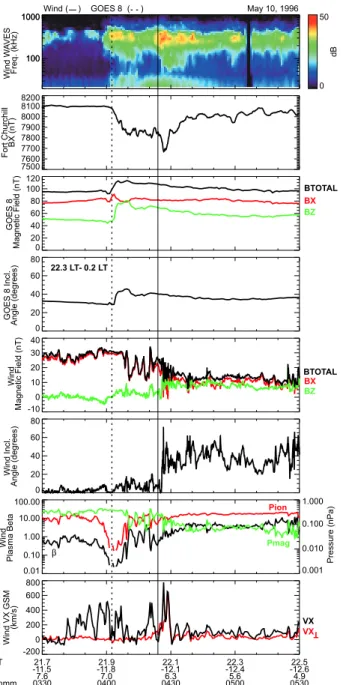
Another example of an isolated dipolarization event at Wind occurred on 10 May 1996 at 04:25:04 UT. Wind was located near 22:03 LT at (−12.1, 6.5, 2.0) REduring this dipolariza-tion. Figure 4 shows AKR observed by Wind WAVES, the
X(northward) component of the magnetic field measured at Fort Churchill in the CANOPUS ground magnetometer net-work, the GOES 8 magnetic field data, the Wind magnetic field data, and the plasma data from Wind for this dipolar-ization event. The GOES 8 geosynchronous satellite was lo-cated near 22:47 LT at (−6.1, 1.5, 2.0) REwhen it observed a magnetic field dipolarization. The dipolarization observed by GOES 8 occurred at 04:02:30 UT, more than 20 min be-fore the dipolarization was observed by Wind. The dipo-larization observed by GOES 8 at 04:02:30 UT featured a very steep increase in Bzand the magnetic field inclination compared to the other examples of dipolarizations at geosyn-chronous orbit shown here. Only a small perturbation in Bx
100 1000 WindW A VES Freq.(kHz) 100 1000 0 50 dB 7500 7600 7700 7800 7900 8000 8100 8200 FortChurchill BX(nT) 0 20 40 60 80 100 120 GOES8 MagneticField(nT) BX BZ BTOTAL 0 20 40 60 80 GOES8Incl. Angle(degrees) -10 0 10 20 30 40 Wind MagneticField(nT) BX BZ BTOTAL 0 20 40 60 80 WindIncl. Angle(degrees) 0.01 0.10 1.00 10.00 100.00 Wind PlasmaBeta 21.7 -11.5 7.6 0330 21.9 -11.8 7.0 0400 22.1 -12.1 6.3 0430 22.3 -12.4 5.6 0500 22.5 -12.6 4.9 0530 -200 0 200 400 600 800 WindVXGSM (km/s) LT X Y hhmm 1996 May 10
Wind ( ) GOES 8 ( ) May 10, 1996
22.3 LT- 0.2 LT VX VX T $ Pmag Pion 0.001 0.010 0.100 1.000 Pressure(nPa)
Fig. 4. Wind, CANOPUS and GOES 8 data from 03:30 to 05:30 UT on 10 May 1996. Figure 4 is the same format as Fig. 2. GOES 8 was located between 22.3 LT to 0.2 LT for the time period shown in the figure.
was observed by GOES 8, so the increase in the magnetic field inclination was due mainly to the increase in Bz. The to-tal magnetic field at GOES 8 also increased during this dipo-larization. Increases in the magnetic field strength have also been reported in detailed studies of dipolarizations at geosyn-chronous orbit (e.g. Nagai, 1982). The magnetic field incli-nation at GOES 8 started at 28.6◦and then quickly increased to a maximum value of 45.7◦at 04:09:30 UT. After the max-imum inclination was reached, the magnetic field inclina-tion gradually decreased until about 05:00 UT. The obser-vation of the dipolarization by GOES 8 was well correlated
with an increase in the intensity of AKR emissions just be-fore 04:00 UT, and with the development of a negative bay at Fort Churchill. Another AKR intensification occurred at 04:20 UT, just before the start of the dipolarization at Wind. Bursts of earthward flow greater than 200 km/s were served by Wind from 03:30 UT to 04:10 UT. The flows ob-served from 03:30 to 04:10 UT were parallel to the magnetic field. These flows could represent the parallel flow in the plasma sheet boundary layer at the lobe-plasma sheet inter-face. The survey of high-speed bulk flows and field-aligned beams conducted by Raj et al. (2002) showed that bulk flows are generally perpendicular to the magnetic field close to the neutral sheet but can have a large field-aligned component away from the neutral sheet. After a short period when Vx decreased dramatically, more earthward flow bursts were ob-served starting around 04:20 UT. The maximum earthward flow observed during this event was 776 km/s at 04:26:38 UT, just after the start of the Wind magnetic field dipolarization at 04:25:04 UT. As the dipolarization progressed, the contri-bution of flows perpendicular to the magnetic field increased. This dipolarization featured a decrease in Bx and
BT OT AL, and a very steep increase in Bzand the magnetic field inclination. The magnetic field inclination at Wind in-creased from an initial value of 0.2◦to a maximum value of 71.4◦in 1.5 min. This implies that the magnetic field inclina-tion changed at a rate of 47.5◦/min. The maximum inclina-tion was observed almost simultaneously with the maximum earthward flow during this dipolarization. The magnetic field fluctuated rapidly, and the maximum inclination of 71.4◦was reached only briefly. However, the average magnetic field inclination for the period from 04:25:04 UT to 05:10:00 UT was 38◦, a significant increase over the initial value of 0.2◦. Before the 10 May 1996 dipolarization, the magnetic pres-sure and total prespres-sure remained fairly constant. The de-crease in the plasma beta around 04:00 UT was due to a sud-den drop in the ion pressure before dipolarization, similar to the decrease in the ion pressure before the 13 January 1996 dipolarization. During the 10 May 1996 dipolarization, the ion pressure increased, and the total pressure and magnetic pressure gradually decreased.
In most of the isolated dipolarizations, including the 10 May 1996 dipolarization, the total magnetic field ob-served by Wind decreased during the process of dipolariza-tion. It is interesting to note that during the 10 May 1996, 04:02:30 UT dipolarization at GOES 8, and the 18 April 1996, 07:23:30 UT dipolarization at GOES 9, the total mag-netic field at geosynchronous orbit increased during the dipo-larization. Nagai (1982) attributed increases in the total mag-netic field at geosynchronous orbit after dipolarization to the enhancement of the H component of the magnetic field (par-allel to the Earth’s dipole axis and positive northward). At Wind’s radial distance, the Bx component of the magnetic field often dominates before an isolated dipolarization, and can be nearly a factor of 10 larger than Bzwhen the magne-totail is highly stretched. During the 10 May 1996, event, the three components of the magnetic field measured by GOES 8 at geosynchronous orbit were within a factor of 2 of one
another before the dipolarization. If the magnetotail is not highly stretched at geosynchronous orbit, one might expect to see a pile-up of magnetic flux during dipolarization, which would account for the increase in Bz, but no major decrease in Bx. This would also result in an increase in the total mag-netic field at geosynchronous orbit.
5.4 26 July 1997, 03:15–08:30 UT
The period from 03:30 UT to 08:30 UT on 26 July 1997 is an example of a period with many pseudobreakups and dipolar-izations, but nothing that looks like a classical, well-defined substorm (Fillingim et al., 2000, 2001). The activity during this time period was interpreted as consisting of a series of quiet-time pseudobreakups by Fillingim et al. (2000, 2001), due to the lack of significant poleward auroral expansion. However, the phenomena that occurred in the magnetotail were similar to those that occured during substorms. Wind observed ten dipolarizations that met the selection criteria in Table 1 on 26 July 1997 from 03:30 to 08:30 UT. The ini-tial inclination angles were greater than 20◦ in eight of the dipolarizations observed by Wind, and maximum inclination angles greater than 70◦were observed during five of the dipo-larizations on 26 July 1997.
AKR observed by Wind WAVES, the X (northward) com-ponent of the magnetic field measured at Fort Churchill, the magnetic field data from GOES 8, and the Wind magnetic field and plasma data for 26 July 1997, 03:30 to 07:30 UT are shown in Fig. 5. The dipolarizations observed by Wind were spaced quite close together (less than 20 min apart), so this time period includes many examples of dipolariza-tions labeled as part of a multiple dipolarization series in our study. The characteristics of many of the dipolarizations ob-served by Wind during this time period are considerably dif-ferent from the properties of the isolated (spaced more than 20 min apart) dipolarization events. The definitions of iso-lated events and multiple dipolarization series events used in our study were chosen specifically to separate the type of dipolarization observed on 26 July 1997 and similar pe-riods from the other events, and not to identify individual substorms. Some of the events labeled as isolated dipolar-izations may in fact represent intensifications of an existing substorm, rather than the start of a new substorm.
Most of the isolated dipolarizations observed by Wind fea-tured an increase in Bz, decreases in Bx and BT OT AL, and an increase in the magnetic field inclination. The decrease in BT OT AL appeared to be caused by the decrease in Bx during most isolated events, which often began with a pe-riod of quiet, tail-like magnetic field just before the magnetic field dipolarization. The magnetic field often increased grad-ually as the density decreased just before an isolated event, indicating a thinning of the plasma sheet. Decreases in the plasma beta before the isolated events also indicated plasma sheet thinning, which is a well-known characteristic of the substorm growth phase in the magnetotail. Growth phase signatures were absent before many of the multiple dipolar-ization series events, such as those observed on 26 July 1997.
100 1000 WindW A VES Freq.(kHz) 100 1000 0 50 dB 7850 7900 7950 8000 8050 8100 8150 FortChurchill BX(nT) 0 20 40 60 80 100 120 GOES8 MagneticField(nT) BX BZ BTOTAL 0 20 40 60 80 GOES8Incl. Angle(degrees) -40 -20 0 20 40 Wind MagneticField(nT) BX BZ BTOTAL 0 20 40 60 80 100 WindIncl. Angle(degrees) 0.1 1.0 10.0 100.0 Wind PlasmaBeta 21.8 -9.1 6.0 0400 22.4 -10.0 4.5 0500 23.0 -10.7 2.9 0600 23.6 -11.2 1.3 0700 -200 0 200 400 600 WindVXGSM (km/s) LT X Y hhmm 1997 Jul 26 Wind ( ) July 26, 1997 22.6 LT-2.6 LT VX VX T Pmag Pion $ 0.01 0.10 1.00 Pressure(nPa)
Fig. 5. Wind, CANOPUS and GOES 8 data from 03:30 to 07:30 UT on 26 July 1997. Figure 6 is the same format as Fig. 2. GOES 8 was located between 22.6 LT to 2.6 LT for the time period shown in the figure.
The plasma and magnetic field data for 26 July 1997, indi-cated that Wind was loindi-cated in the plasma sheet for the en-tire interval when the dipolarizations were observed. The to-tal pressure, magnetic pressure, and ion pressure remained fairly constant throughout the entire time interval shown, but small, transient fluctuations in these quantities occurred during some of the dipolarizations. During the other time periods considered, the ion pressure usually increased dur-ing dipolarization, as a result of plasma sheet expansion. However, on 26 July 1997, transient decreases in the ion pressure occurred during the dipolarizations at 04:53:07 UT, 05:44:19 UT, and 05:57:46 UT.
It is interesting to note that from 04:00 UT to 05:20 UT, the average value of Bx remained fairly steady, although large amplitude fluctuations of the magnetic field were observed during the dipolarization events. The Bz component of the magnetic field started at about 5 nT at 03:30 UT, and then be-gan to gradually increase from 04:00 UT to 05:20 UT. Four perturbations in Bzthat resulted in brief increases in the incli-nation angle during this period were considered to be distinct dipolarization events (marked by vertical lines at 04:08 UT, 04:30 UT, 04:39 UT, and 04:53 UT in Fig. 5). Three of these dipolarizations were associated with large bursts of earth-ward flow. Although the magnetic field inclination and Bz briefly increased and then decreased during each of these four dipolarizations, the inclination remained higher than its initial value after each dipolarization. It is not clear if these individual dipolarizations collectively were responsi-ble for the gradual increase in Bz observed from 04:00 UT to 05:20 UT, or if the Bzincrease was caused by something else and the dipolarizations were merely transient perturba-tions without any lasting effect.
After 05:20 UT, Bz decreased suddenly, dropping to the same value as before the 04:08 to 04:53 UT dipolarizations. The magnitude of Bx also increased slightly, but the plasma beta remained relatively steady and did not indicate signifi-cant thinning of the plasma sheet. Several minutes later, a se-ries of three dipolarizations was observed by Wind (marked by vertical lines at 05:29 UT, 05:43 UT, and 05:57 UT in Fig. 5). Each of these dipolarizations increased in dura-tion and intensity. The third dipolarizadura-tion had the largest change in magnetic field inclination of the three, was associ-ated with the largest flows, the largest AKR intensification, and had the longest duration. This series of dipolarizations was associated with a larger decrease in Bxthan the 04:00 to 05:20 UT dipolarizations, and each dipolarization appeared to contribute to the step-wise decrease in the magnitude of
Bxbetween 05:30 UT and 06:20 UT. Although the increase in the magnitude of Bx between 05:20–05:29 UT indicated that there may have been some storage of energy in the mag-netotail during this time, the decreases in Bxand the behavior of the plasma beta after the 05:29 UT dipolarization are not consistent with the storage of additional energy in the mag-netotail before the 05:43 UT and 05:57 UT dipolarizations. After the third dipolarization, Bz began to decrease again until about 06:30 UT, when a final series of two dipolariza-tions was observed (marked by vertical lines at 06:30 UT and 06:40 UT). There was also a slight increase in the magnitude of Bxbefore the 06:30 UT dipolarization, which could be in-terpreted as a short growth phase, but the plasma beta and the pressures do not indicate a thinning of the plasma sheet. The behavior of Bz during these two dipolarizations was similar to the behavior of Bz during the 04:00 to 05:20 UT dipolar-izations. However, Bxbegan to steadily decrease during the 06:30 UT dipolarizations.
Bursts of earthward flow were observed during most of the dipolarizations observed by Wind on 26 July 1997. Although the flow bursts each lasted only a few minutes, flows greater than 400 km/s were observed during some of the
dipolariza-tion events. These flow velocities are comparable to the flow velocities observed during isolated dipolarization events by Wind. In many of the flow bursts, the component of Vx par-allel to the magnetic field was quite large. Detailed analysis of the Wind particle distributions for 26 July 1997 showed that when |Bx| was small, the flows were mainly perpen-dicular to the magnetic field, but when |Bx|was larger, the flows were more field-aligned (Raj et al., 2002). Even when the flows observed on 26 July 1997 had a significant field-aligned component, Raj et al. (2002) found that the flows still appeared to be convective in nature and were not consis-tent with field-aligned beams. All of the dipolarization events and flow bursts on 26 July 1997 were associated with brief intensifications of AKR and Pi2 pulsations at Fort Churchill. Some of the dipolarizations were also associated with the de-velopment of negative bays at Fort Churchill.
Although GOES 8 and GOES 9 were well-positioned to observe the geomagnetic activity on 26 July 1997, only very small perturbations of the magnetic field at geosynchronous orbit were observed. Neither GOES 8 nor GOES 9 ob-served dipolarization signatures during the activity obob-served by Wind on 26 July 1997. At geosynchronous orbit, Pi2 pul-sations are observed less often during time periods with low
Kp index values than for periods with high Kp, due to the geometry of the inner magnetosphere (Singer et al., 1983). According to Singer et al. (1983), when Kp is high, the inner boundary of the plasma sheet may be inside geosyn-chronous orbit, but when Kp is low, the inner boundary of the plasma sheet and the Pi2 source region are located far-ther from Earth. The Kp index was low on 26 July 1997, so the inner boundary of the plasma sheet may have been located too far tailward of geosynchronous orbit for dipo-larizations to be observed by GOES 8 or 9. Although no activity was observed at geosynchronous orbit, the dipolar-izations observed by Wind on 26 July 1997 seem to be asso-ciated with most of the substorm expansion phase character-istics described in both the flow-braking/NENL and current disruption substorm models, so it is not clear why the mag-netosphere does not follow the classical pattern of substorm development.
With the exceptions of the dipolarizations at 05:29 UT and 06:30 UT, the dipolarizations observed during the time pe-riod shown in Fig. 5 did not appear to be associated with typical growth phase signatures. A possible explanation is that solar wind conditions on 26 July 1997 caused the mag-netosphere to enter into a pattern of directly driven activ-ity where energy was continuously released in the magne-totail instead of stored in the tail lobes during a growth phase and then explosively released at the onset of the substorm expansion phase. However, the time period on 26 July 1997, shown in Fig. 5, does not fit the profile for a steady magnetospheric convection event. Solar wind data from Geotail at (21.8, −13.9, −2.9) RE and IMP-8 at
(27.2, −25.7, −2.4) RE both indicated that |By| was often larger than Bz and that the IMF Bz was small (∼2 nT), and mainly northward, although it did fluctuate considerably during this time period. Steady magnetospheric convection
Wind Magnetotail Coverage -18 -17 -16 -15 -14 -13 -12 -11 -10 -9 -8 -7 -6 X GSM (RE) 0 25 50 75 100 125 Hours -15 -12 -9 -6 -3 0 3 6 9 12 15 Y GSM (RE) 0 25 50 75 100 125 Hours -6 -5 -4 -3 -2 -1 0 1 2 3 4 5 6 Z GSM (RE) 0 25 50 75 100 125 Hours -6 -5 -4 -3 -2 -1 0 1 2 3 4 5 6 Distance to Neutral Sheet (RE)
0 25 50 75 100 125 Hours
Fig. 6. The top 3 panels show histograms of the total amount of time in hours that the Wind spacecraft spent in different bins of the X, Y , and Z GSM position of the spacecraft. The bottom panel shows the amount of time Wind spent at different distances from the neutral sheet as determined by Fairfield (1980).
events generally have several hours of southward IMF Bz (e.g. Sergeev et al., 1996). When the propagation time de-lay is taken into account, it appears that brief, southward fluctuations in the IMF Bz may have been associated with some of the dipolarization events observed by Wind on 26 July 1997. Due to the large distances of Geotail and IMP-8 in the Y direction and the rapid fluctuations in the IMF, it is difficult to determine with absolute certainty that these magnetic field fluctuations were associated with the dipolar-izations observed by Wind. However, comparison with sim-ilar magnetotail activity observed by Geotail on 1 October 1996 when the IMF Bz was small and fluctuating, suggests that the solar wind conditions were responsible for the con-tinuous pattern of activity in the magnetotail on 26 July 1997 (Sigsbee et al., 2004).
6 Statistical results
6.1 Spatial distribution of dipolarization events
Figure 6 shows the total amount of time in hours that Wind spent in different regions of the magnetotail using GSM coordinates and the distance to the model neutral sheet
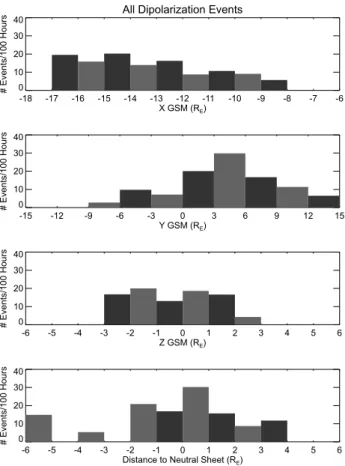
de-All Dipolarization Events
-18 -17 -16 -15 -14 -13 -12 -11 -10 -9 -8 -7 -6 X GSM (RE) 0 10 20 30 40 #Events/100Hours -15 -12 -9 -6 -3 0 3 6 9 12 15 Y GSM (RE) 0 10 20 30 40 #Events/100Hours -6 -5 -4 -3 -2 -1 0 1 2 3 4 5 6 Z GSM (RE) 0 10 20 30 40 #Events/100Hours -6 -5 -4 -3 -2 -1 0 1 2 3 4 5 6 Distance to Neutral Sheet (RE)
0 10 20 30 40 #Events/100Hours
Fig. 7. Histograms of the number of dipolarization events per 100 h observed by Wind in the same position bins shown in Fig. 6.
termined by Fairfield (1980). The Wind spacecraft spent the most time in the magnetotail between −6<X<−14 RE. The passes through the magnetotail were fairly evenly dis-tributed across the tail in the Y direction, but Wind spent slightly more time in the post-midnight region (Y <0) than it did in the pre-midnight region. Wind was generally lo-cated between −2<Z<3 RE, but there was a much broader distribution of positions relative to the Fairfield (1980) neu-tral sheet, as shown in Figure 6. Seasonal effects caused by the Earth’s dipole tilt were taken into account when calculat-ing the neutral sheet model and the position of Wind relative to the neutral sheet.
Figure 7 shows a histogram of the number of dipolariza-tion events per 100 h observed by Wind in the posidipolariza-tion bins from Fig. 6. Dipolarization events were observed by Wind between −8<X<−17 RE. More dipolarization events were observed further away from Earth, in agreement with results from AMPTE/CCE (Lopez et al., 1988). Although Wind spent more time in the post-midnight region of the magne-totail, the distribution of dipolarization events was peaked in the pre-midnight region (Y >0), confirming the results of the Lopez et al. (1988) dipolarization study. The dipo-larization events were all observed between −3<Z<3 RE, and most occurred within a few RE of the Fairfield (1980) neutral sheet.
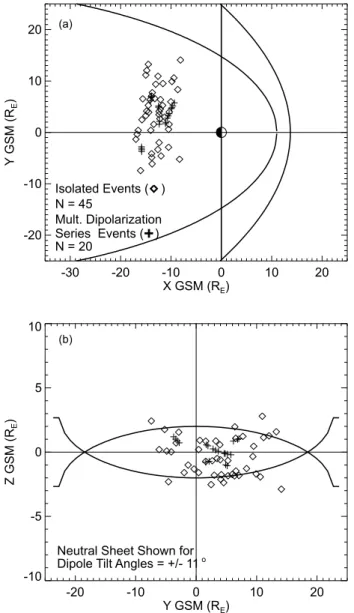
-30 -20 -10 0 10 20 X GSM (RE) -20 -10 0 10 20 Y GSM(R E ) Isolated Events ( ) N = 45 Mult. Dipolarization Series Events ( ) N = 20 -20 -10 0 10 20 Y GSM (RE) -10 -5 0 5 10 ZGSM(R E )
Neutral Sheet Shown for Dipole Tilt Angles = +/- 11o
(b) (a)
Fig. 8. The spatial distribution of the 45 isolated dipolarization events and 20 multiple dipolarization series events observed by Wind in (a) the X−Y and (b) the Y −Z GSM planes. Isolated dipo-larization events were defined as dipodipo-larization events occurring at least 20 min after the last dipolarization event and at least 20 min be-fore the next dipolarization event. Dipolarization events that were spaced less than 20 min apart were considered to be part of a multi-ple dipolarization series. The two curves plotted in the Y −Z plane represent the Fairfield (1980) neutral sheet for dipole tilt angles of
±11◦.
Figure 8 shows the spatial distribution of the 65 dipolarization events observed by Wind in the X−Y and
Y −Z GSM planes. Figure 8a illustrates that most of the dipolarization events observed by Wind occurred in the pre-midnight region. The distribution of the dipolarization events in the X−Y GSM plane is similar to the spatial distribution of high-speed (>250 km/s) bulk flow events reported in a sur-vey of 17 Wind perigee passes between 1995 and 1997 (Raj et al., 2002). As described in Sect. 3, isolated dipolariza-tion events were defined as dipolarizadipolariza-tion events occurring
at least 20 min after the last dipolarization event and at least 20 min before the next dipolarization event. Although this may not correspond to the usual definition of an isolated sub-storm, making this distinction seemed to be appropriate for the activity observed by Wind in the magnetotail. We found that the distribution of the events that occurred as part of a multiple dipolarization series was more localized in the pre-midnight region than the distribution of the isolated dipo-larization events, with most multiple dipodipo-larization series events occurring close to midnight. As many of the multi-ple dipolarization series events occurred during quiet times, this appears to be consistent with the findings of Lopez et al. (1988), that the center of the substorm current wedge shifts from the pmidnight region towards the post-midnight re-gion with increasing geomagnetic activity. It is also consis-tent with studies showing that pseudobreakups are more lim-ited in spatial extent than substorms (Nakamura et al., 1994). In Fig. 8b, the two curves plotted in the Y −Z plane repre-sent the Fairfield (1980) neutral sheet for dipole tilt angles of
±11◦. As shown in Fig. 8b, most of the dipolarization events occurred close to the neutral sheet, in agreement with earlier studies (Lopez et al., 1988; Baumjohann et al., 1999). 6.2 Observations of earthward flows
We did not require the presence of high-speed earthward flows in the selection of dipolarization events, but Wind 3-DP plasma data (Lin et al., 1995) showed that 78% of the events had more than 5 min of earthward flow greater than 100 km/s. Maximum earthward flow velocities greater than 300 km/s were observed in 57% of the events. When only isolated dipolarization events were considered, this percentage in-creased to 60%. Although earthward flow was not a selec-tion condiselec-tion in our initial search for dipolarizaselec-tion events, it would appear that most dipolarization events are accompa-nied by earthward flow. This is in agreement with other stud-ies of magnetic field dipolarization events, such as Baumjo-hann et al. (1999) and Shiokawa et al. (1998). Figure 9 shows when the maximum earthward flow velocity was observed relative to the start of the magnetic field dipolarization for the isolated events. As shown by Fig. 9, the maximum earth-ward flow velocity was observed within 10 to 12 min after the start of the dipolarization during most of the isolated events. The maximum earthward flow occurred before the start of the dipolarization in only one isolated event.
The second panel in Fig. 9 shows the number of events in 2 min bins of the difference between the time of the maxi-mum inclination angle and the start time of the dipolariza-tion for differences from −10 to +30 min. The second panel shows that the maximum magnetic field inclination is typi-cally reached within 18 min after the start of dipolarization. The third panel in Fig. 9 shows the number of events in 2 min bins of the difference between the time of the maximum in-clination angle and the time of the maximum earthward flow velocity Vx for differences from -10 to +30 min. In two of the events, the maximum inclination angle was reached more than 10 min before the maximum Vx was observed, so they
fall outside the limits of the plot. The third panel shows peaks in the distribution between 0 and 4 min, indicating that in most cases, the maximum inclination angle was reached almost simultaneously with the observation of the maximum earthward flow velocity or just a few minutes later. In 28% of the events shown in the third panel, the maximum inclination angle was reached before the maximum Vxwas observed.
A number of explanations exist for the cases where the maximum inclination was reached before the peak flow: 1) Wind was located on tail-like field lines and did not observe the flows until the plasma sheet expanded over the space-craft; 2) the flows were weak (∼100 km/s) and fluctuating; 3) the magnetic field was fluctuating rapidly, so the maximum magnetic field inclination was not sustained for very long. Substorm observations by Geotail also featured variable flow directions and magnetic field fluctuations during the flows (Nagai et al., 2000). Explanations (2) and (3) probably can account for many of the cases in which the maximum inclina-tion was reached before the peak flow. However, there is an-other possible explanation why large flows were not observed during some events. The presence of large fluxes of high-energy ions that exceed the operating limits of typical parti-cle instruments has been observed in the magnetotail during substorms (see Fairfield et al., 1998; Nagai et al., 2000). The effects of particles penetrating the detector were taken into account when the Wind 3-DP data were analyzed, but it is possible that quantities such as the velocity and density were underestimated due to these particles. For more details on the plasma flows and particle distributions observed by Wind in the magnetotail, consult the comprehensive study conducted by Raj et al. (2002).
In 72% of the events shown in Fig. 9 the maximum incli-nation angle was reached after the maximum flow velocity was observed. Figure 9 supports the flow-braking picture described by Shiokawa et al. (1997, 1998) reasonably well, since in most cases the peak flow was observed before the dipolarization reached its maximum inclination angle. This is also consistent with observations from Geotail at X GSM
>−20 RE, in which plasma flows were observed to start be-fore the increase in Bz associated with magnetotail dipolar-ization (Nagai et al., 2000). Figure 9 also shows that the dipolarization observed by a single spacecraft in the magne-totail is generally a rapid process, occurring on time scales less than the duration of the auroral disturbances associated with a typical substorm, which can last for more than 1 h, as shown by global auroral images (e.g. Mende et al., 2003, and references therein).
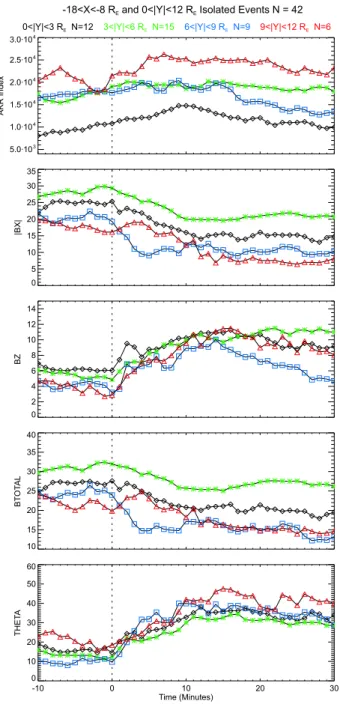
6.3 Superposed epoch study of dipolarizations and AKR To perform a superposed epoch study of the Wind mag-netic field dipolarization events, we divided the magnetotail between −18<X<−8 RE into bins 3 RE wide in Y . We assumed that the substorm expands symmetrically around midnight, and grouped events in the pre-midnight and post-midnight regions at the same |Y | together. We started by examining 42 isolated dipolarization events (>20 min apart)
-10 -6 -2 2 6 10 14 18 22 26 30
(t Max. Vx) - (t Dipolarization) in minutes
0 2 4 6 8 10 Numberof IsolatedEvents N = 45 (a) -10 -6 -2 2 6 10 14 18 22 26 30
(t Max. Incl. Angle) - (t Dipolarization) in minutes 0 2 4 6 8 10 Numberof IsolatedEvents N = 45 (b) -10 -6 -2 2 6 10 14 18 22 26 30
(t Max. Incl. Angle) - (t Max. Vx) in minutes
0 2 4 6 8 10 Numberof IsolatedEvents N = 43 (c)
Fig. 9. (a) A histogram of the number of isolated events in 2 min bins of the difference between the time when the maximum earth-ward flow velocity was observed and the start of the magnetic field dipolarization. (b) The number of events in 2 min bins of the dif-ference between the time when the maximum inclination angle was observed and the start time of the dipolarization. (c) The number of events in 2 min bins of the difference between the time when the maximum inclination angle was observed and the time when the maximum earthward flow velocity was observed.
between 0<|Y |<12 RE. We attempted to use the integrated AKR power index as an indicator of global substorm onset times for a superposed epoch study of the azimuthal expan-sion of the substorm current wedge, but the timing of the Wind dipolarization events relative to the AKR intensifica-tions was not well-defined. We found that it was difficult to identify onset times correctly using the AKR index even for isolated dipolarization events because the highly variable frequency and bandwidth of AKR made it difficult to chose a suitable intensity threshold. We therefore chose the zero-epoch time to be the start of the Bzincrease, to examine how the AKR varied relative to the magnetic field dipolarization and to see how the properties of the dipolarization changed with the Y position. Figure 10 shows the results of the su-perposed epoch study for the isolated events. We used 1 min
-18<X<-8 R and 0<|Y|<12 R Isolated Events N = 42E E 5.0·103 1.0·104 1.5·104 2.0·104 2.5·104 3.0·104 AKRIndex 0 5 10 15 20 25 30 35 |BX| 0 2 4 6 8 10 12 14 BZ 10 15 20 25 30 35 40 BT OT AL -10 0 10 20 30 Time (Minutes) 0 10 20 30 40 50 60 THET A
0<|Y|<3 R N=12E 3<|Y|<6 R N=15E 6<|Y|<9 R N=9E 9<|Y|<12 R N=6E
Fig. 10. Results of the superposed epoch study showing the de-pendence of dipolarization properties on the Y GSM position for
the isolated events. We used 1 min averages of the magnetic
field in the regions 0<|Y |<3 RE, 3<|Y |<6 RE, 6<|Y |<9 RE, and 9<|Y |<12 RE. The absolute value of Bx is plotted in Fig. 10 to
prevent Bxfrom averaging to zero. The AKR index was obtained
by integrating the Wind WAVES data as described in Sect. 3.
averages of the magnetic field in the regions 0<|Y |<3 RE, 3<|Y |<6 RE, 6<|Y |<9 RE, and 9<|Y |<12 RE. Only 3 events were observed from 12<|Y |<15 RE, so we did not include this region in the superposed epoch study. The abso-lute value of Bxis plotted in Fig. 10 to prevent Bxfrom aver-aging to zero, since some of the events started in the northern tail lobe (positive Bx) while others started in the southern tail lobe (negative Bx). The data are plotted starting 10 min
be-fore the dipolarization and ending 30 min afterward. The traces for the different |Y | regions in Fig. 10 do not ap-pear to be ordered in any particular sequence. This suggests that the properties of the isolated magnetic field dipolariza-tions are fairly uniform across the width of the magnetotail. The lack of systematic organization in the |Y | direction also implies that the local regions of activity in the magnetotail could vary significantly for different events. During the 18 April 1996 and 26 July 1997 case study events, several dipo-larizations were observed at nearly the same local time and radial distance, but the characteristics of the dipolarizations were highly variable. The lack of systematic organization in the |Y | direction could also be an indication that the state of the magnetotail prior to dipolarization is more important than local time in determining how dipolarization proceeds in the mid-tail. However, it is still possible to identify some general characteristics of the isolated dipolarizations in this region of the magnetotail from Fig. 10. The isolated dipolar-ization events were characterized by an increase in Bz, an in-crease in the magnetic field inclination angle, and dein-creases in |Bx|and BT OT ALstarting approximately at the same time as the Bz increase. The change in magnetic field inclina-tion to the equatorial plane appeared to be closely correlated with the Bzincrease, while the decrease in the total magnetic field was more strongly correlated with the decrease in |Bx|. The decrease in BT OT AL, shown in Fig. 10, agrees with the results from AMPTE/CCE, which showed that the total mag-netic field decreases after most dipolarizations (Lopez et al., 1988).
As shown in Fig. 10, there does not appear to be any cor-relation between the AKR index and the increase in the mag-netic field inclination during dipolarization for the isolated dipolarizations. It is possible that in some cases the AKR emissions did not reach Wind due to the shielding effects of the plasmasphere. However, studies of AKR propagation show that these emissions can be observed near the equa-torial plane in the night-side magnetosphere, provided that the spacecraft is not close to the plasmapause and a broad frequency range is considered (Gurnett, 1974; Green et al., 1977; Gallagher et al., 1979). As the average radial distance of the Wind dipolarization events was 14 REand we used the frequency range 50 kHz to 800 kHz, the influence of AKR propagation effects on our results was probably not signifi-cant.
To be certain that grouping events by |Y | did not lead us to an erroneous conclusion about the dependence of the dipolar-ization properties on position in the Y direction, we repeated the analysis using 3 RE bins of Y between −9<Y <12 RE. The results of the superposed epoch analysis using bins of Y were nearly identical to the results using |Y |. The traces for different Y regions also did not appear to be ordered in any particular sequence, and there was not a clear correlation be-tween the start of dipolarization and the behavior of the AKR index. This result was quite surprising, as studies of dipolar-izations at geosynchronous orbit (e.g. Nagai, 1991) suggest that we should have found a clear time delay for dipolariza-tions observed far away from midnight. Nagai (1991) found