HAL Id: hal-00305610
https://hal.archives-ouvertes.fr/hal-00305610
Submitted on 17 Jan 2007HAL is a multi-disciplinary open access archive for the deposit and dissemination of sci-entific research documents, whether they are pub-lished or not. The documents may come from teaching and research institutions in France or abroad, or from public or private research centers.
L’archive ouverte pluridisciplinaire HAL, est destinée au dépôt et à la diffusion de documents scientifiques de niveau recherche, publiés ou non, émanant des établissements d’enseignement et de recherche français ou étrangers, des laboratoires publics ou privés.
D. L. Gasca-Tucker, M. C. Acreman, C. T. Agnew, J. R. Thompson
To cite this version:
D. L. Gasca-Tucker, M. C. Acreman, C. T. Agnew, J. R. Thompson. Estimating evaporation from a wet grassland. Hydrology and Earth System Sciences Discussions, European Geosciences Union, 2007, 11 (1), pp.270-282. �hal-00305610�
© Author(s) 2007. This work is licensed under a Creative Commons License.
Estimating evaporation from a wet grassland
D.L. Gasca-Tucker
1, M.C. Acreman
2, C.T. Agnew
3and J.R. Thompson
1 1Wetland Research Unit, Department of Geography, UCL, London, UK / Atkins Water, Eynsham, UK2Centre for Ecology and Hydrology, Wallingford, UK
3School of Environment and Development, University of Manchester, UK Email for corresponding author: man@ceh.ac.uk
Abstract
Wet grasslands are being restored across the UK and Europe to reinstate their high biodiversity following over 50 years of drainage and conversion to arable agriculture. The water balance of many wet grasslands is dominated by precipitation and evaporation and it is essential to quantify evaporation rates to understand the hydrological functioning of wetlands and the implications for water resources in catchments where wetlands are being restored. This paper considers data from direct measurements of evaporation from the Pevensey Levels wet grassland using the eddy correlation method. Equations are derived to predict actual evaporation using meteorological data on the site or from standard meteorological station observations. It was found that evaporation could be estimated reliably from meteorological variables, such as wind speed, temperature and humidity and by water availability. It was also found that when water availability is high, evaporation is high and may exceed reference evaporation values, raising questions over the deployment of the two-step Penman-Monteith model unless reliable crop coefficients and relative evaporation figures can be determined.
Keywords: evaporation, wet grassland, wetland, water balance, crop coefficient, relative evaporation, meteorological data, Penman-Monteith,
eddy correlation, Pevensey Levels
Introduction
Wet grasslands are an important type of wetland in the UK, supporting significant biodiversity including IUCN Red List birds, such as hen harriers, merlin and black-tailed godwit, and plants, e.g. downy-fruited sedge, tuberous thistle and creeping marshwort (Benstead et al., 1997). They also provide rich pastureland for cattle, hay meadows and washland flood storage areas that reduce downstream flood risk (Merrit, 1994). However, the view of wetlands as wastelands has led to extensive conversion for intensive arable cultivation. Thus, many wet grasslands have been lost due to water abstraction, drainage or the separation of rivers from their floodplains by embankments (Maltby, 1986). For example, English Nature (1997) reported that since 1930, 64% of wet grassland in the Thames valley, 48% in Romney Marsh and 37% in the Norfolk and Suffolk Broads have been lost. The UK Biodiversity Action Plan includes the restoration of wet grasslands and the Department for the Environment, Food and Rural Affairs offers subsidies to farmers to implement environmentally
friendly farming practices through schemes such as Countryside Stewardship and the Wildlife Enhancement Scheme (Acreman and José, 2000). In addition, restoration is being undertaken by wildlife conservation organisations, including the Royal Society for the Protection of Birds and local Wildlife Trusts, who are buying degraded wet grassland areas. Restoration most frequently entails increasing inundation and surface moisture through the maintenance of high water levels within the natural and semi-artificial ditch networks which characterise wet grasslands. The feasibility of restoration often depends on the balance between precipitation and evaporation. Furthermore, restoration may increase evaporation which may then affect water resources in the catchment. Good estimates of evaporation are therefore essential for planning and sustainable management of wet grasslands. However, evaporation data from wetlands are rare, due to the requirement of high quality instrumentation (Souch et al., 1996) and the lack of suitable meteorological observations. This paper reports the analysis of evaporation data from the
Pevensey Levels wet grassland in East Sussex, UK, and its relationship to meteorological data from weather stations. The results provide an operational method for estimating evaporation from these wetlands. The term evaporation, in this context, includes all water vapour flux to the atmosphere from the land, including open water, transpiration from leaves and evaporation from bare soil.
Estimating evaporation
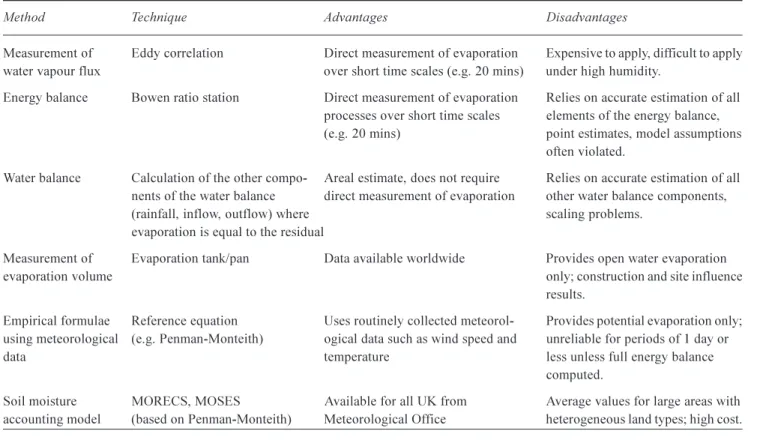
In the UK, six methods of varying complexity are commonly used to obtain estimates of evaporation for wetlands. These are summarised in Table 1. Specific equipment has been designed for calculating evaporation, such as the Hydra (Shuttleworth et al., 1988), which is based on the eddy correlation method. Acreman et al. (2003) used the Hydra to determine evaporation from a wet grassland on Tadham Moor in south-west UK, which reached around 3.5 mm day1 in summer. Gardner (1991) recorded evaporation rates of up to 5.5 mm day1 from Yarnton Mead, Oxford, also using a Hydra. Gavin and Agnew (2003) deployed a Bowen ratio station on the North Kent Marshes, UK, and determined an evaporation rate of 2.6 mm day1. However, such specialised instruments are normally too expensive and time-consuming for operational use by government and NGO conservation agencies and remain largely research tools.
The water balance method has been applied to many wetlands worldwide, but has been criticised (Acreman, 2005) as the residual term in a water balance may be significantly affected by inaccurate estimation of the other components, such as groundwater flow and the different time-scales over which hydrological variables change. The evaporation tank, or pan, has been a standard item at meteorological stations worldwide for the past century (WMO, 1966). It provides an estimate of open-water evaporation, unlike wetlands which although partly flooded are dominated by vegetation. Tanks and pans are therefore considered unrepresentative of natural wetland conditions and are prone to overestimation (Van Keulen and Wolf, 1986).
The most widely used method for estimating evaporation in hydrological studies is to apply a formula, such as the Penman (1948) equation or derivatives, to meteorological data (net radiation, temperature, wind speed and humidity in the boundary layer) collected from a weather station on the wetland itself or a nearby non-wetland site. However, the wider applicability of this method is limited due to the lack of a dense national monitoring network. The Penman formula assumes that the evaporating surface is short grass of uniform height, completely shading the ground, actively growing and adequately supplied with water, to compute reference potential evaporation (PEtref). Its application
Table 1. Methods of estimating evaporation
Method Technique Advantages Disadvantages
Measurement of Eddy correlation Direct measurement of evaporation Expensive to apply, difficult to apply
water vapour flux over short time scales (e.g. 20 mins) under high humidity.
Energy balance Bowen ratio station Direct measurement of evaporation Relies on accurate estimation of all processes over short time scales elements of the energy balance,
(e.g. 20 mins) point estimates, model assumptions
often violated.
Water balance Calculation of the other compo- Areal estimate, does not require Relies on accurate estimation of all nents of the water balance direct measurement of evaporation other water balance components,
(rainfall, inflow, outflow) where scaling problems.
evaporation is equal to the residual
Measurement of Evaporation tank/pan Data available worldwide Provides open water evaporation
evaporation volume only; construction and site influence
results.
Empirical formulae Reference equation Uses routinely collected meteorol- Provides potential evaporation only; using meteorological (e.g. Penman-Monteith) ogical data such as wind speed and unreliable for periods of 1 day or
data temperature less unless full energy balance
computed.
Soil moisture MORECS, MOSES Available for all UK from Average values for large areas with
therefore becomes questionable for different heterogeneous vegetation or when the vegetation experiences water stress, since the rate of actual evaporation will be less if soil water supply is restricted (Wallace, 1991).
In recent years, the Penman-Monteith method (Monteith, 1965) has superseded that of Penman, giving more consistent PEtref evaporation estimates and has been shown to perform better than other reference methods when compared with lysimeter data (Chiew et al., 1995). However, the equation requires values of the canopy physiology (including stomatal characteristics, their size, distribution and the proportion of each day during which they are open) and aerodynamic turbulence (Dolman, 1992), which are not widely available. This information can be taken from the literature, such as Cain (1998) who suggests that aerodynamic resistance (ra) is related to crop height and a fixed canopy resistance (rc) of 70 sm1. In wet grasslands, which are actively grazed, grass height is close to 0.12 m and Lansley (1998) found a value of rc = 70 sm1 to be appropriate for the Pevensey Levels.
Several coefficient-based evaporation models have been proposed, but none specifically for wetlands. The Ministry of Agriculture, Fisheries and Food (1967) suggests a model based on evaporation determined by the Penman method, combined with an index of wetness relative to soil field capacity. As the soil dries out, actual evaporation (AEt) is reduced relative to PEtref. A similar approach is employed by the Food and Agriculture Organisation of the United Nations (FAO) in its CROPWAT model (Smith, 1992), although PEtref can be obtained from the Makkink, Blaney-Criddle, Penman or Pan evaporation methods (Doorenboos and Pruitt, 1977).
Operating authorities in the UK have tended to employ regional estimates such as those provided by the Meteorological Office Rainfall and Evaporation Calculation System (MORECS), now replaced by the Meteorological Office Surface Exchange Scheme (MOSES1). In MORECS, the Penman-Monteith equation is applied to net radiation, temperature, vapour pressure and wind speed data from meteorological stations across the UK. Objective interpolation is employed to obtain 40 × 40 km grid square values of PEtcrop by employing appropriate values of rs and ra under conditions of adequate water supply. AEt can then be calculated based on PEtcrop using a soil moisture extraction model by progressively reducing the actual rate of water loss from the potential value to zero, as the available moisture decreases from field saturation to zero (Hough et al., 1997). The major draw-back of this approach is that
most squares include a heterogeneous set of land cover types including wetlands, arable land, forest and urban areas.
Crop coefficients and relative
evaporation
Crop coefficients and relative evaporation indices have emerged as the main means of addressing indirect measurement of evaporation. The word crop is used because the primary application has been to estimate water needs of different crop types, such as rice, by irrigation engineers. In this paper, a crop type can be wet grassland vegetation.
In the two-step model proposed by FAO (Smith, 1992), crop potential evaporation (PEtcrop) is firstly calculated from a reference evaporation rate (PEtref), where
PEtcrop = PEtref x kc (1)
and kc is a coefficient specific to crop or vegetation type (see Doorenbos and Pruitt, 1977). Secondly, actual evaporation (AEt) is calculated from PEtcrop according to soil moisture characteristics (Smith, 1992). Throughout this paper the term relative evaporation (RE) is employed to distinguish the latter coefficients, based on hydrological parameters, to those based on crop type, where
AEt = RE x PEtcrop (2)
Coefficients for numerous crop types, crop development stages and soil moisture scenarios have been developed. As an example, WMO (1966) suggested multiplying evaporation data by a crop coefficient of between 0.67 and 0.81 to estimate potential wetland evaporation. However, in reality observed crop coefficients are more erratic than the smooth curves generally suggested (Agnew, 1991) and the need for these further levels of empiricism is a clear indication of the limitations of the fundamental approach of beginning with PEt and trying to correct it to obtain actual evaporation (Wallace, 1991). Few crop coefficients have been proposed for wet grassland environments.
Most wetland studies have focused on relative evaporation (RE) since meteorological data have been collected from the wetland site rather than from a site with idealised standard conditions. For example, Acreman et al. (2003) compared direct measurement of evaporation (AEt) by eddy correlation on the Tadham Moor wet grassland with the potential (PEt) from the Penman equation applied to meteorological data from an Automatic Weather Station (AWS) on the site. In this case, AEt was 10% higher, implying an RE of 1.1. Agnew and Gavin (2000) calculated
1http://www.metoffice.com/research/nwp/publications/nwp_gazette/
RE of 1.15 for wet grasslands in north Kent, England, using an AWS and a Bowen ratio station, while Brereton et al. (1996) suggest a much higher value of 1.5 for mid-latitudes. The applicability of existing MAFF, CROPWAT and MORECS crop-based evaporation models in wetland environments is limited by the fact that although these account for the effects of water stress on AEt, they preclude the effects of soil saturation, a common feature of wetland hydrology. Studies by Priestley and Taylor (1972) and Crundwell (1987) have suggested that where the soil surface is saturated, or open water areas are associated with some aquatic vegetation cover, AEt may proceed at a rate greater than that estimated on the basis of the reference evaporation. These findings are not consistent with traditional models, where the AEt is defined as that which is equal to or smaller than reference evapotranspiration (Doorenboos and Pruitt, 1984). Priestley and Taylor (1972) suggested that AEt = 1.26 PEt in wetland environments, although Crundwell (1987) has identified the species-dependence of this factor, reporting factors as high as 2.5 and 3.1 for Typha latifolia and Potomogeton nodosus respectively. The fact that these coefficients are in excess of unity are based on the theoretical premise that the rate of evaporation from a vegetated body of water will proceed at a rate which will include both direct evaporation from the water and transpiration from the vegetation. Transpiration from the vegetation will be close or equal to the maximum reference rate possible at the given energy input, since water availability will not be limiting.
Evaporation from the open water area will be superimposed upon the potential rate, making AEt greater than that predicted on the basis of PEt alone. In these situations some measure of open water evaporation may be required for the accurate calculation of AEt.
The Pevensey Levels wetland
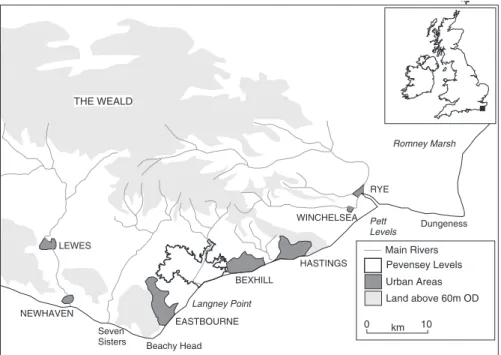
The Pevensey Levels are a characteristic lowland wet grassland lying between Eastbourne and Bexhill-on-Sea, in East Sussex, UK (Fig. 1). The wetland is the result of progressive reclamation of salt marshes and mudflats since the Middle Ages. It is used mainly for grazing, although at least 20% of the area is presently in arable cultivation. The wetland is also highly important in nature conservation terms, illustrated by its Site of Special Scientific (SSSI) status and the designation of two areas as National Nature Reserves (NNRs). The Pevensey Levels are also a candidate Ramsar site under the International Convention on Wetlands. The primary tool for management of the wetland for both agriculture and conservation stakeholders is the control of ditch water levels, through sluices and pumps. In terms of evaporation, ditch water level records are of interest since they provide an historical measure of water availability over the wetland. The ideal water level regimes for agriculture and conservation are different (Fig. 2): high ditch water levels promoting surface flooding are required to attract wading birds, whilst agricultural objectives rely on low water
THE WEALD RYE HASTINGS WINCHELSEA BEXHILL EASTBOURNE LEWES NEWHAVEN Land above 60m OD 0 km 10 Pevensey Levels Urban Areas Main Rivers Dungeness Langney Point Romney Marsh Pett Levels Beachy Head Seven Sisters
Fig. 1. Location map showing the the Pevensey Levels wetland, including the wetland boundary, defined by the 5-m contour, major channels and the area of the wetland on which the work in this paper focuses. The black dot indicates the location of the study area (Reproduced from Jennings and Smythe, 1990).
levels for drainage to limit surface flooding which reduces soil productivity.
On the Pevensey Levels, pumping stations have been instrumental in reducing the areal extent of surface flooding on an annual basis and creating hydrological conditions suitable for agriculture, but with a consequent reduction in the conservation value of the wetland. In recent years this has prompted attempts to restore the wetland by introducing a Wildlife Enhancement Scheme (WES). The WES provides financial incentives for higher target ditch water levels (Fig. 2), without openly advocating surface flooding which is considered unmanageable by the farming community.
Estimation of evaporation on the
Pevensey Levels
Interest in evaporation on the Pevensey Levels stems from it being the main process of water loss from the wetland and this may be increased by wetland restoration. Water balance calculations conducted by Douglas (1993), Loat (1995) and Gasca-Tucker (2005; Fig. 3) have identified the importance of evaporation at the whole wetland scale. The analysis of four estimates of evaporation is described in Table 2. -0.8 -0.6 -0.4 -0.2 0
JAN FEB MAR APR MAY JUN JUL AUG SEP OCT NOV DEC
Lev el bel ow fi el d l ev el ( m ) -15,000,000 -10,000,000 -5,000,000 0 5,000,000 10,000,000 15,000,000 Ja n-95 A pr-9 5 Jul -95 Oc t-95 Ja n-96 Apr -96 Jul -96 Oc t-96 Ja n-97 Ap r-97 Jul -9 7 Oc t-97 Ja n-98 Ap r-98 Jul -9 8 Oc t-98 Vo lu m e ( m 3)
Rainfall Surface water inflows
Sewage treatment works Evaporation
Abstraction Losses to sea
Fig. 2. Idealised water level regimes on an annual basis for agriculture ( ) and conservation ( ... ), and the compromise level proposed by a Wildlife Enhancement Scheme on the Pevensey Levels ( )
HORSE EYE METEOROLOGICAL STATION
The Horse Eye meteorological station has an aspirated Stevensons screen containing wet and dry bulb thermometers, a Campbell-Stokes sunshine recorder, an anemometer mounted at 2 m height and a Symons-type evaporation tank (AEttank). Data from all of these instruments are collected at 9 a.m. (GMT) on a daily basis, and are available from 1970. Grass potential evaporation (PEtHorseeye) is calculated after Penman (1948) by
E = (D/g H + Ea) / (D/g + 1) (3)
H = 0.75 Ra (0.16 + 0.62 n /N) 0.95 sT4 (0.47 0.075 ed) (0.17 + 0.83 n /N) (4) Ea = 0.35 (ea ed) (1 + u2 / 160.9) (5)
Values for n, T (T = Tmax + Tmin / 2) and u2 are provided by
data from the meteorological station and values for Ra, N, 0.95 sT4, e
a and ed are taken from tables provided by the Ministry of Agriculture, Fisheries and Food Technical Bulletin No. 16 (1967).
For the calculation of open water evaporation (EoPenman) and to account for the different albedo and aerodynamic properties of a water surface, the factors in Eqns. 3 and 4 are changed so that
H= 0.93 Ra (0.16 + 0.62 n /N)... and Ea = ....
(0.5 + u2 / 160.9) (6)
In this paper, where Horse Eye grass potential evaporation (PEtHorseeye) or open water evaporation (EoPenman) estimates are provided, the equations set out above have been used. ON SITE AUTOMATIC WEATHER STATION
A Didcot Instruments automatic weather Station (AWS) was deployed on the site from June 1997 to October 1998. The AWS measured net radiation, wet and dry bulb temperature, rainfall and wind speed. Soil heat flux plates were installed
initially but damage by short tailed voles nesting beneath the logger box meant the record was short and discontinuous. Reference evaporation PEtaws was calculated by the Penman-Monteith method proposed by the ASCE (1996) that assumes a fixed canopy resistance (rc) of 70 sm1 and a crop height of 0.12m.
ON-SITE HYDRA
A Hydra Mk II was deployed on the wetland from June 1997 to October 1998. The Hydra comprises a fast-response cup anemometer, an infra-red absorption hygrometer, a fine wire thermocouple and a vertical sonic anemometer mounted on a sensor head at a height of 2.8 m above the ground surface, and is complemented by a net radiometer 1m above ground level. These sensors provide data regarding the vertical transfer of energy from one eddy to another away from the surface (Shuttleworth et al., 1988). Incoming energy is partitioned into sensible heat, latent heat and radiant energy, with latent heat being equivalent to the actual evaporation.
Fundamental technical limitations to the Hydra system require close scrutiny when choosing actual evaporation data for analysis. The infrared hygrometer does not operate when wet and gaps and inaccuracies in the data may arise when there is rain or dew on the hygrometer. The Hydra has an acceptance angle of 330o and winds from the other 30o have been shown in tests to underestimate evaporation by up to 10% (Shuttleworth et al., 1988). For control of the quality of actual evaporation data and because of these limitations, only days where no sensor malfunction occurred during diurnal hours (09002100) and where wind direction was within the acceptance angle were used in the analysis. INSTRUMENT SITING
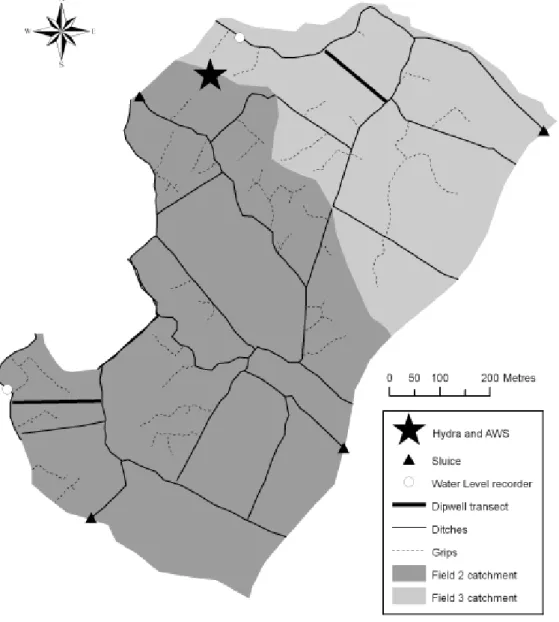
The Hydra and AWS were sited in a National Nature Reserve owned by the Sussex Wildlife Trust (Fig. 4), one of the least improved areas 2 km from the Horse Eye meteorological station. The large flat marsh landscape meant there was no
Table 2. Estimates of evaporation used in the study.
Instrumentation Method Nnomenclature
Evaporation pan at a local meteorological station on the edge Evaporation pan AEttank
of the wetland (Horseeye)
Meteorological Office standard meteorological station at Horseeye Penman formula PEtHorseeye
Didcot automatic weather station on the wetland Penman-Monteith formula PEtAWS
difficulty in satisfying instrument requirements of between 200400 m of undisturbed upwind fetch (Gash, 1986). Site vegetation was dominated by Agrostis spp, although there was considerable Juncus spp cover in wetter fields. The Reserve is actively grazed, particularly in summer, and both the Hydra and AWS were placed in a 250 m2 enclosure to limit damage by stock. Ditch vegetation on the nature reserve is extremely rich, consisting of open water, emergent and bank species. The ditches are particularly rich in pondweeds (Potomageton spp.) and their surfaces are generally covered during the macrophyte growing season (late springlate summer). In terms of water availability, the site is not necessarily characteristic of the wetland as a whole, being more representative of an original or restored lowland wet grassland habitat: ditch water levels are generally higher at this site than elsewhere on the wetland.
Wetland water levels
Ditch water level data were employed as a surrogate measure of water availability. Water levels in two inter-connected ditch systems extending through the entire area upwind of the meteorological instrumentation were monitored on a daily basis from 1995 using two OTT water level recorders (Fig. 4). Water table levels in the alluvial clay substrate upwind of the AWS and Hydra were also measured along three field transects in 36, 1 m deep, dipwells (Fig. 4). Depths to the water table were measured whenever the Hydra and AWS were downloaded, roughly on a fortnightly basis.
A further measure of water availability was afforded by a 20-metre resolution topographical survey of the upwind area conducted by the Agriculture Development Advisory Service (ADAS) in 1993. These level data were employed
to estimate the theoretical extent of inundation at different ditch water levels (Table 3). These data were obtained using Surfer specialist mapping software (Golden Software Inc) capable of deriving contour maps from coordinate and level
Table 3. Ditch water level compared with estimated areal extent
of inundation as a percentage of the total areal extent of the nature reserve.
Ditch water level(m aOD) Areal extent of inundation (% of total reserve area)
1.85 0 1.90 0.0006 1.95 0.03 2.00 0.09 2.05 0.3 2.10 1.3 2.15 3.6 2.20 8.8
data, and calculating the surface area between individual contours. Results of the analysis suggested an exponential relationship between inundation extent and ditch water levels, beginning at levels in excess of 1.85 m above Ordnance Datum (aOD). (Table 3, Fig. 5). The combination of this relationship and observations of ditch water level permitted the derivation of a time series of inundated areas expressed as percentage of total Reserve area. These data are, however, an underestimate, since they account only for ditch induced surface flooding. The data do not account for rainfall falling directly into marsh hollows which, given the low hydraulic conductivity of the marsh substrate (0.058 m day1), ensured extended surface water presence.
Results and discussion
DATA FROM THE HYDRA MKII AND THE AWS The relationship between actual (AEt) and potential evaporation (PEt), expressed as relative evaporation (RE),
Ditches Catchment boundary Inundation depth (m) 0.00 - 0.05 0.05 - 0.10 0.10 - 0.15 0.15 - 0.20 0.20 - 0.25 0.25 - 0.30 100 0 100 200 Meters N E W S a) 2.10m AOD b) 2.10m AOD c) 2.30m AOD 100 0 100 200 Meters 100 0 100 200 Meters N E W S N E W S
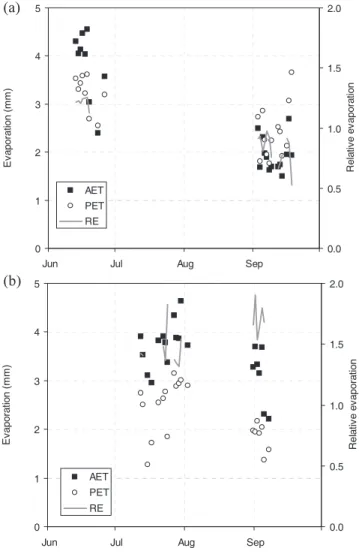
Fig. 6. Daily AEtHydra, PEtAWS and Relative Evaporation (AEtHydra / PEtAWS) for available days of summer of (a) 1996 and (b) 1997.
0 1 2 3 4 5
Jun Jul Aug Sep
E va por at ion ( m m ) 0.0 0.5 1.0 1.5 2.0 R elat iv e ev ap or at io n AET PET RE 0 1 2 3 4 5
Jun Jul Aug Sep
E vap or at ion ( m m ) 0.0 0.5 1.0 1.5 2.0 R el at iv e ev apor at io n AET PET RE
was examined in detail using daily actual evaporation flux data from the Hydra (AEtHydra) and AWS (PEtAWS). These data were available for two periods in the summer of 1996: 1326 June (period 1) and 31 August18 September (period 2), totalling 33 days. Data were also available for two periods in the summer of 1997: 12July7 August (period 3), 28 August8 September (period 4) totalling 40 days. For these periods, filtering of AEthydra data, to eliminate days with hygrometer malfunctions and wind directions outside Hydra acceptance angles, resulted in the loss of 10 days in 1996 (20, 21, 22, 24 and 25 June and 31 August, 1, 2, 10, 11 and 15 September) and 17 days in 1997 (14, 16, 18, 19, 21, 25, 26 and 31 July, 37, 29, 30 August and 6 and 8 September). This gave a total of 42 days when all the sensors were working, 22 days in 1996 (Fig. 6a) and 20 in 1997 (Fig. 6b). AEtHydra and PEtAWS totals for concurrent five-day periods and for each of the four individual periods for which Hydra data were available were also calculated and employed to calculate RE.
(a)
(b)
RELATIVE EVAPORATION (RE) - THE
RELATIONSHIP BETWEEN AETHYDRA AND PETAWS
In both years double mass analysis between daily AEtHydra and PEtAWS suggested that the data were of good quality and comparable. However, a significant difference in the trends of RE in 1996 and 1997 was apparent. Throughout the entire experimental period in 1997, rates of AEtHydra evaporation were greater than PEtAWS (RE>1). During the summer of 1996, values of RE were generally less than unity, with RE exceeding 1 for 39% of the days for which data were available (Fig. 6). This difference was reflected in the mean values of RE for the two summers: 0.97 for the 22 days of 1996 and 1.58 for the 20 days of 1997.
WATER AVAILABILITY - HYDROLOGICAL CONDITIONS DURING THE STUDY PERIOD
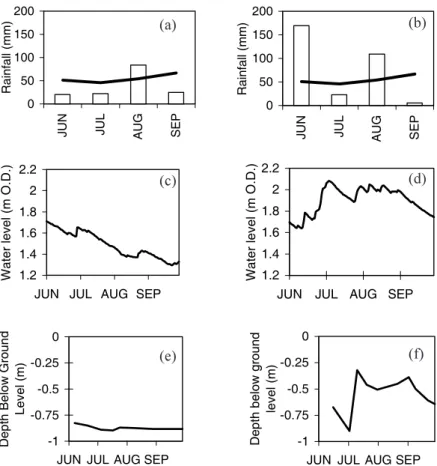
Evaporation data came from two summers which experienced significantly different water availability. The summer of 1996 was considerably drier than average, with rainfall between June and September being less than half that in the equivalent period of 1997. JuneSeptember rainfall was 147 mm and 307 mm in 1996 and 1997 respectively. Rainfall in June, July and September 1996 was 40%, 48% and 37% of respective monthly long-term averages (Fig. 7a). In comparison, June and August 1997 had 333 % and 203% of the respective long-term average monthly rainfall, with 115 mm falling between 20 and 27 June and 61 mm falling in the last week of August. In comparison, July and September were very dry (Fig. 7b), with 49.8% and 8% of monthly long-term averages respectively.
The important influence imparted by the contrasting rainfall totals in the two years on mean ditch water levels is illustrated in Fig. 7c and 7d. Ditch water levels during the summer of 1996 varied from a high of 1.68 m aOD on 12 June falling to a low of 1.25 m aOD on 18 September, close to the dry depth. In contrast, ditch water levels during the summer of 1997 did not fall below 1.60 m aOD and were above 2.00 m aOD for 27 % of all days between June and September (Fig. 7d).
Water table data mirrored these inter-annual differences, with higher groundwater levels in 1997 than 1996 (Figs. 7e and 7f). At the beginning of June 1996 only dipwells in field 3 contained any water and by September all the dipwells on the reserve were at their dry depth, some 0.81.0 m beneath the marsh surface (Fig. 7e). At the beginning of the summer of 1997, mean water table levels were at a similar and low level, but rose to within 0.3 m of the marsh surface at the beginning of July and remained above 0.5 m below the surface for the rest of the period (Fig. 7f). Soil pits dug
Fig. 7. Summer Water availability on the Sussex Wildlife Trust Reserve. Monthly rainfall June-September (a) 1996 (b) 1997. Ditch water levels in the area upwind of instrumentation (c) 1996 (d) 1997. Mean field-centre water table levels for three fields upwind of instrumentation (e) 1996 (f)1997. -1 -0.75 -0.5 -0.25 0
JUN JUL AUG SEP
D ept h Below G round Level ( m ) 0 50 100 150 200
JUN JUL AUG SEP
Rainfall ( m m ) 0 50 100 150 200 JU N JU L AUG SEP R ainfall ( mm) 1.2 1.4 1.6 1.8 2 2.2
JUN JUL AUG SEP
Wa te r le ve l (m O.D.) 1.2 1.4 1.6 1.8 2 2.2
JUN JUL AUG SEP
W ater level (m O.D.) -1 -0.75 -0.5 -0.25 0
JUN JUL AUG SEP
Dept h bel ow ground le ve l ( m ) (a) (c) (e) (b) (d) (f)
in the field suggest that, at this level, the water table is within reach of the roots of the grass, and is therefore likely to play an important role in local evaporation dynamics. RELATIONSHIP BETWEEN RELATIVE
EVAPORATION AND WATER AVAILABILITY
The marked differences in the relationships between AEtHydra and PEtAWS for 1996 and 1997 provided a preliminary indication of the influence of water availability on RE. The clearest difference between these two years was that 1996 was unusually dry while 1997 was unusually wet (Figs. 7a
and 7b), suggesting that increases in water availability over the wetland would result in comparative increases in RE. The relationship was examined in more detail using daily, five-day and period evaporation data. A period was defined as a time when there were a continuous set of AEt estimates as discussed above.
Table 4 shows period evaporation data, ditch water levels and RE. Higher ditch water levels were associated with higher values of RE; exceeding the 1.26 coefficient suggested by Priestley and Taylor (1972) when water level is higher than 1.72 m aOD. These results are consistent with those of Acreman et al. (2003), who found a strong
Table 4. Comparison between total relative evaporation (AEtHydra/AWS Penman Monteith) and mean water availability
during the four individual periods for which data were available
Period Days in period Period REAEtHydra / PEtAWS Mean ditch water level Mean water table level
(m aOD) (m aOD)
1 9 0.82 1.64 1.46
2 14 0.82 1.37 1.42
3 13 1.54 1.97 1.87
correlation between surface resistance and water table depth on a wet grassland at Tadham Moor. Similar results were provided by five-day and daily data. For both five-day and daily evaporation data, PEtAWS performed consistently and showed a relationship with AEtHydra that could be related to ditch water for both five-day and daily time-steps (Fig. 8). The equations describing these relationships and associated standard deviations are:
Five-day RE = 0.93 Dlevel 0.64 (r2 = 0.92) (7) Daily RE = 0.9 Dlevel 0.60 (r2 = 0.71) (8)
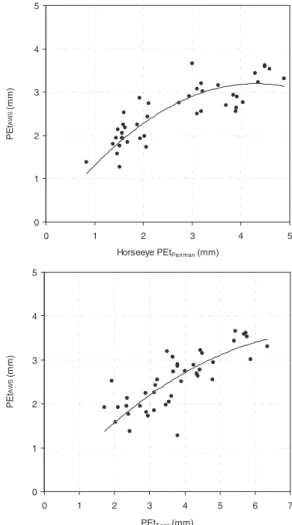
COMPARISON OF PETAWS ON THE WETLAND AND
HORSE EYE
Comparisons of potential evaporation estimates from the AWS (PEtAWS) and those calculated from Horse Eye meteorological data (PEtHorseeye) and evaporation tank
Fig. 8. Relationship between relative evaporation (AEtHydra/AWS
PEtcrop) for (a) daily data intervals and (b) five day intervals
Fig. 9. Relationship between PE estimates from the AWS on the wet grassland estimated by the Penman-Monteith method (PEtAWS) and Horse Eye (a) meteorological data (b) evaporation tank.
0 1 2
1.20 1.40 1.60 1.80 2.00 2.20 Ditch water level (m O.D.)
R el ati ve E vapo ra tion 0 1 2 1.20 1.40 1.60 1.80 2.00 2.20 Ditch Water Level (m OD)
R ela tiv e E vap or at ion 0 1 2 3 4 5 0 1 2 3 4 5 6 7 PEtTank (mm) PEt AW S (m m ) 0 1 2 3 4 5 0 1 2 3 4 5
Horseeye PEtPenman (mm)
PE
t
AW
S
(mm)
(PEttank) are shown in Fig. 9. They show that potential evaporation from the wetland was lower than that at Horse Eye for values in excess of 2.0 mm d1. Uncertainty in the relationship was sufficiently large to suggest caution when using Horse Eye evaporation data to estimate actual evaporation from the wetland using the crop coefficient approach.
This variability in the relationship between the wetland PEtAWS and PEtHorseeye could be attributed to Horse Eye being on higher ground and therefore subject to greater wind speeds. However, a further hypothesis is that it is a result of the absence of a direct measure of net radiation at the Horseeye meteorological station. Instead, the method used for the calculation of the PEtHorseeye relied on a seasonal relationship between latitude and sunshine hours. This is an important consideration, given that data from the AWS point to the dominance of the heat budget component of PEtAWS on the wetland.
Conclusion
The results of this study show the extent by whichactual evaporation from the Pevensey Levels is controlled by meteorological factors and soil water availability. The meteorological conditions can be indicated by PEt estimates provided by Penman-Monteith and water availability by ditch water level data. The results have led to the development of a method for estimating actual evaporation from meteorological data, either from an automatic weather station on the site or from a standard meteorological station. However, the results did support suggestions by Agnew (1981) and Wallace (1991) relating to the limitations of the crop coefficient approach to estimate actual evaporation (AEt) from potential (PEt) estimates. This was particularly evident in the degree of uncertainty in the relationship between RE (AEtHydra / PEtAWS) and water availability.
Models, such as that advocated by MORECS, assume that AEt cannot exceed PEt. Data for the Pevensey Levels show that this assumption is incorrect. Values of RE at the highest ditch water levels were in excess of the 1.26 suggested by Priestley and Taylor (1972), a ditch water level of 1.72 m aOD being coincident with the point at which AEt = 1.26 PEtAWS. These findings are consistent with other estimates of relative evaporation from UK wet grasslands (Gardiner, 1991; Acreman et al., 2003; Gavin and Agnew, 2003) and have extensive implications for water balance calculations in wet grassland areas. Where PEt estimates alone are used as input evaporation data, during conditions of surface saturation, actual evaporation from the grass canopy may be underestimated by more than 50%, while under dry conditions the method will overestimate evaporation. The findings of this study also have implications for wetland restoration schemes in wet grassland areas. Management of wet grasslands has traditionally been based on raising ditch water levels for ecological gain. This study suggests that this practice may increase evaporative loss, a result which should be taken into account when assessing the relative sustainability of these schemes in water resource terms.
Acknowledgments
The authors wish to thank Mike Stroud and Dave McNeil from the Centre for Ecology and Hydrology, Wallingford, for setting up the equipment and providing advice on data analysis, Neil Fletcher, warden of the Sussex Wildlife Trust NNR where this research was conducted, and Matt Levine. The PhD research of David Gasca-Tucker upon which this paper is partly based was funded by the Jackson Environment Institute (UCL) with additional support being provided by the EU SHYLOC (System for Hydrology using
Land Observation for model Calibration) project and the UCL Department of Geography.
References
Acreman, M.C. and José, P., 2000. Wetlands. In: Hydrology of the
UK a study of change. M.C. Acreman (Ed.), Routledge,
London, UK. 204224.
Acreman, M.C. and Miller, F., 2006 Hydrological impact assessment of wetlands. Proc. Int. Symp. on groundwater
sustainability, Alicante, Spain. (In press).
Acreman, M.C., Harding, R.J., Lloyd, C.R. and McNeil, D.D., 2003. Evaporation characteristics of wetlands; experience from a wet grassland and a reedbed using eddy correlation measurements. Hydrol. Earth Syst. Sci., 7, 1122.
Agnew, C.T., 1991 Evaluation of a soil water balance model for the analysis of agricultural drought in the Sahel. IAHS
Publication no. 199.
Agnew, C.T. and Gavin, H., 2000 Evaporation from a wet grazing marsh. Proc. BHS 7th National Symposium, Newcastle, UK. 5.1 5.3.
American Society of Civil Engineers, 1996. Hydrology Handbook. ASCE. Manuals and Reports on Engineering Practice No. 28. New York, USA.
Benstead, P., Drake, M., José, P., Mountford, J.O., Newbold, C. and Treweek, J., 1997. The wet grassland guide managing
floodplain and coastal wet grasslands for wildlife. Royal Society
for the Protection of Birds, Sandy, UK.
Cain, J.D., 1998. Modelling evaporation from plant canopies.
Institute of Hydrology Report No. 132, Institute of Hydrology,
Wallingford, UK.
Cook , H.F. and Moorby, H., 1993. English marshlands reclaimed for grazing: a review of the physical environment. J. Environ.
Manage, 38, 5572.
Crundwell, M.E., 1987. The calculation of evapotranspiration from
the Ichekul Wetland aided by remotely sensed data. MPhil
Thesis. University College London, London, UK.
Dolman, A.J., 1992. A note on areally-averaged evaporation and the value of effective surface conductance. J. Hydrol., 138, 583 589
Doorenboos, J. and Pruitt, W., 1977. Crop water requirements.
Irrigation and Drainage paper 24. FAO, Rome, Italy.
Douglas, S., 1993. Water resource balance for the Pevensey Levels
catchment. Unpublished report. National Rivers Authority,
Worthing, UK. 35pp.
Gardner, C., 1991. Water regime of river meadows. Yarnton Mead
case study. Report to Ministry of Agriculture, Fisheries and
Food. Institute of Hydrology, Wallingford, UK.
Gasca-Tucker, D.L., 2005. Hydrology of the Pevensey Levels. PhD Thesis University of London, London, UK.
Gash, J.H.C., 1986. Observations of turbulence downwind of a forest-heath interface. Bound. Layer Meteorol., 36, 227237. Gavin, H. and Agnew, C.T., 2000. Estimating evaporation and
surface resistance from a wet grassland. Phys. Chem. Earth B, 25, 599604.
Gavin, H. and Agnew, C.T., 2003. Evaluating the reliability of point estimates of wetland reference evaporation. Hydrol. Earth
Syst. Sci., 7, 310.
Hough, M., 1997. The Meterological Office Rainfall and Evaporation Calculation System (MORECS). Hydrological
Memorandum no. 45. Meteorological Office, Bracknell, UK.
Lansley, D., 1998. Evaporation over the Pevensey Levels wetland. MSc Dissertation. Reading University, Reading, UK.
Loat, A., 1995. An investigation into the available water resources
for the enhancement of the wildlife value of the Pevensey Levels, East Sussex. Undergraduate Dissertation. Department of
Geography, University College London, London, UK. Maltby, E., 1986. Waterlogged wealth. Earthscan, London, UK. Merrit, A., 1994. Wetlands, industry and wildlife a manual of
principles and practices. The Wildfowl and Wetlands Trust,
Slimbridge, UK.
Ministry of Agriculture, Fisheries and Food, 1967. The estimation of evapotranspiration. Technical bulletin No. 16. MAFF, London, UK.
Monteith, J.L,. 1965. Evaporation and environment. Symp. Soc.
Exp. Biol. XIX. Cambridge University Press Cambridge, UK.
Morton, F.I., 1983. Operational estimates of evapotranspiration and their significance to the science and practice of hydrology.
J. Hydrol., 66, 176.
Penman, H.L., 1948. Natural evaporation from open water, bare soil and grass. Proc. Royal Soc., Lond., 194, 120145. Priestley, C.H.B. and Taylor, R.J., 1972. On the assesment of the
surface heat flux and evaporation using large scale parameters.
Monthly Weather Rev. 100, 8192.
Shuttleworth, W.J., Gash, J.H.C., Lloyd, C.R., McNeill, D.D., Moore, C.J. and Wallace, J.S., 1988. An integrated micrometeorological system for evaporation measurement. Agr.
Forest Meteorol., 43, 295317.
Smith, M., 1992. Report on the expert consultation on revision of
Food and Agriculture Organization methodologies for crop water requirements. Land and Development Division, FAO,
Rome, Italy.
Souch, C., Wolfe, C.P. and Grimmond, S.B., 1996. Wetland evaporation and energy partitioning: Indiana Dunes National Lakeshore. J. Hydrol., 184, 189208.
van Keulen, H. and Wolf, J. (Eds.), 1986. Modelling of agricultural
production weather, soils and crops. Pudoc, Wageningen, The
Netherlands.
Wallace, J.S., 1991. The measurement and modelling of evaporation from semi-arid land. IAHS Publication no. 199, 131148.
World Meteorological Organisation, 1966. Measurement and estimation of evaporation and evapotranspiration. WMO