HAL Id: hal-00301158
https://hal.archives-ouvertes.fr/hal-00301158
Submitted on 1 Apr 2005HAL is a multi-disciplinary open access
archive for the deposit and dissemination of sci-entific research documents, whether they are pub-lished or not. The documents may come from teaching and research institutions in France or abroad, or from public or private research centers.
L’archive ouverte pluridisciplinaire HAL, est destinée au dépôt et à la diffusion de documents scientifiques de niveau recherche, publiés ou non, émanant des établissements d’enseignement et de recherche français ou étrangers, des laboratoires publics ou privés.
The semianalytical cloud retrieval algorithm for
SCIAMACHY ? I. The validation
A. A. Kokhanovsky, V. V. Rozanov, T. Nauss, C. Reudenbach, J. S. Daniel,
H. L. Miller, J. P. Burrows
To cite this version:
A. A. Kokhanovsky, V. V. Rozanov, T. Nauss, C. Reudenbach, J. S. Daniel, et al.. The semianalytical cloud retrieval algorithm for SCIAMACHY ? I. The validation. Atmospheric Chemistry and Physics Discussions, European Geosciences Union, 2005, 5 (2), pp.1995-2015. �hal-00301158�
ACPD
5, 1995–2015, 2005 Semianalytical cloud retrieval algorithm A. Kokhanovsky et al. Title Page Abstract Introduction Conclusions References Tables Figures J I J I Back Close Full Screen / EscPrint Version Interactive Discussion
EGU
Atmos. Chem. Phys. Discuss., 5, 1995–2015, 2005 www.atmos-chem-phys.org/acpd/5/1995/
SRef-ID: 1680-7375/acpd/2005-5-1995 European Geosciences Union
Atmospheric Chemistry and Physics Discussions
The semianalytical cloud retrieval
algorithm for SCIAMACHY – I. The
validation
A. A. Kokhanovsky1,5, V. V. Rozanov1, T. Nauss2, C. Reudenbach2, J. S. Daniel3, H. L. Miller3,4, and J. P. Burrows1
1
Institute of Remote Sensing, University of Bremen, Germany
2
Department of Geography, University of Marburg, Germany
3
Aeronomy Laboratory, NOAA, Boulder, Colorado, USA
4
Cooperative Institute for Research in Environmental Science, University of Colorado, Boulder, Colorado, USA
5
Institute of Physics, 70 Skarina Avenue, Minsk, 220072, Belarus
Received: 2 April 2004 – Accepted: 25 February 2005 – Published: 1 April 2005 Correspondence to: A. Kokhanovsky ([email protected])
ACPD
5, 1995–2015, 2005 Semianalytical cloud retrieval algorithm A. Kokhanovsky et al. Title Page Abstract Introduction Conclusions References Tables Figures J I J I Back Close Full Screen / EscPrint Version Interactive Discussion
EGU
Abstract
A recently developed cloud retrieval algorithm for the SCanning Imaging Absorption spectroMeter for Atmospheric CHartographY (SCIAMACHY) is briefly presented and validated using independent and well tested cloud retrieval techniques based on the look-up-table approach for MODeration resolutIon Spectrometer data. The results of
5
the cloud top height retrievals using measurements in the oxygen A-band by an air-borne crossed Czerny-Turner spectrograph and the Global Ozone Monitoring Experi-ment (GOME) instruExperi-ment are compared with those obtained from airborne dual pho-tography and retrievals using data from Along Track Scanning Radiometer (ATSR-2), respectively.
10
1. Introduction
The primary scientific objective of SCanning Imaging Absorption spectroMeter for At-mospheric CHartographY (SCIAMACHY) is to acquire data that can be used to make estimates of trace gases in the troposphere and stratosphere (Bovensmann et al., 1999). Retrievals of atmospheric trace gas amounts are performed from SCIAMACHY
15
observations of spectral signatures in transmitted (e.g., occultation measurements) and backscattered (e.g., limb or nadir measurement modes) light. The wavelength range is from 240 till 2380 nm. This wide spectral coverage coupled with high spectral resolu-tion (0.22–1.6 nm depending on the channel) allows for measurements of tropospheric and stratospheric abundances of a number of atmospheric constituents, with particular
20
emphasis on the troposphere. High spatial resolution is not of primary importance for trace gas measurements, so the size of SCIAMACHY pixels is quite large (typically, 30*60 km2). This makes the instrument not particularly suitable for the retrievals of aerosol and cloud parameters. In contrast, the Medium Resolution Imaging Spectrom-eter (MERIS) placed on the same space platform has a spatial resolution 0.3*0.3 km2
25
ACPD
5, 1995–2015, 2005 Semianalytical cloud retrieval algorithm A. Kokhanovsky et al. Title Page Abstract Introduction Conclusions References Tables Figures J I J I Back Close Full Screen / EscPrint Version Interactive Discussion
EGU
reflectance at a single wavelength measured by SCIAMACHY corresponds roughly speaking to 20 000 reflectances as obtained by MERIS. Thus, MERIS allows one to obtain highly spatially resolved maps of cloud and aerosol fields. It does not mean, however, that possibilities offered by SCIAMACHY for aerosol and cloud studies should not be explored. The superiority of SCIAMACHY is in the possibility of acquiring
infor-5
mation over a larger spectral range and also with much higher spectral resolution as compared to MERIS. This allows for the derivation of some important characteristics of clouds (e.g., the determination of liquid water path and cloud thermodynamic state), which is hardly possible with MERIS. Also in some applications (e.g., for climate mod-eling) highly spatially resolved data are not required. Furthermore, clouds cover more
10
than half of the sky at any instant globally, biasing many SCIAMACHY trace gas re-trievals if cloud effects are not properly incorporated in the retrieval procedures. There-fore, we suggest that MERIS/SCIAMACHY measurements should be combined in one processing scheme to create more advanced atmospheric products (e.g., the aerosol and cloud optical thickness, trace gases vertical columns and their vertical
distribu-15
tions). The Advanced Along Scanning Radiometer (AATSR) on board of the ENViron-mental SATellite (ENVISAT) should provide additional information (e.g., independent measurements of cloud top temperature). Unfortunately, the processing schemes for all instruments are currently decoupled, which is mostly due to the complexity of inte-gration of the cloud retrieval algorithms for each instrument, large volumes of satellite
20
data involved and calibration problems. We believe that the problem of integration will be solved in future missions.
All these considerations prompted us to develop the comprehensive SemiAnalytical CloUd Retrieval Algorithm (SACURA) for SCIAMACHY. The algorithm is fully described in separate publications (Kokhanovsky et al., 2003; Rozanov and Kokhanovsky, 2004).
25
Therefore, only the outline of the technique will be presented here. The central idea of this paper is the validation of the algorithm using airborne and satellite measurements.
ACPD
5, 1995–2015, 2005 Semianalytical cloud retrieval algorithm A. Kokhanovsky et al. Title Page Abstract Introduction Conclusions References Tables Figures J I J I Back Close Full Screen / EscPrint Version Interactive Discussion
EGU
2. The physical basis of SACURA
The spectral top-of-atmosphere (TOA) reflectance in the range 240–2380 nm as mea-sured by SCIAMACHY is highly dependent on the cloud optical thickness (COT), cloud droplet radius (CDR) (in near-infrared), cloud top height (CTH)(in the oxygen A-band), and cloud thermodynamic state.
5
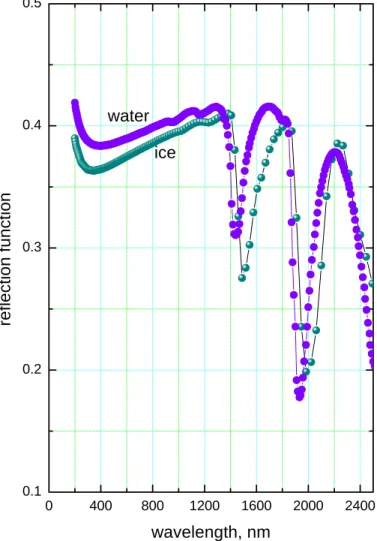
We show results of a calculation of the TOA reflection function for water and ice clouds in Fig. 1.
Calculations have been performed using the modified asymptotic equations as de-scribed by Kokhanovsky and Rozanov (2003) at the solar angle equal to 60 degrees and the nadir observation. To emphasize differences due the different complex
re-10
fractive indices of liquid and solid water, the shape and size of water droplets and ice crystals have been assumed to be the same in calculations. In particular, calculations have been performed for spherical polydispersions with the effective radius of 6 mi-crons and the gamma size distribution of particles having the coefficient of variance equal to 38 percent, which is typical for water clouds. The change of the scattering
15
optical thickness with the wavelength was neglected, and we assumed that it is equal to 10 for all wavelengths.
The size and shape of crystals can differ significantly from those assumed in the calculations shown in Fig. 1. This can enhance differences shown in Fig. 1 even further. In particular, for the case considered, we see that the minima of reflection
20
function for ice clouds are moved to larger wavelengths as compared to the case of water clouds. Therefore, there are regions, where the spectral dependence of re-flectance is not highly correlated between ice and liquid clouds (e.g., close to 1500 nm and 2000 nm, see Fig. 1). However, this may be difficult to detect due to the influence of water vapor absorption bands, which are located roughly at the same spectral regions
25
(see Figs. 1 and 2). Therefore, one can use different slopes of spectral reflectance for ice as compared to water (see, e.g., the range 1550–1670 nm in Fig. 1). SACURA uses the cloud phase index α=R(1550 nm)/R(1670 nm) to differentiate water/ice clouds. We
ACPD
5, 1995–2015, 2005 Semianalytical cloud retrieval algorithm A. Kokhanovsky et al. Title Page Abstract Introduction Conclusions References Tables Figures J I J I Back Close Full Screen / EscPrint Version Interactive Discussion
EGU
found using radiative transfer calculations that this index is in the range 0.7–1.0 for water clouds as compared to 0.5–0.7 for ice clouds.
The cloud liquid water path and the effective radius of droplets are retrieved from reflectances at wavelengths 412 nm and 1550 nm, using a numerical technique as de-scribed by Kokhanovsky et al. (2003). Then the cloud optical thickness and the
col-5
umn concentration of droplets can be easily found. Note that the contribution of the gaseous absorption is negligible at these wavelengths (see Fig. 2). Due to low surface reflectance at the wavelength 412 nm, the information on the underlying surface re-flectance is not crucial for the algorithm. Also we are mostly concentrated on the case of extended optically thick clouds in which the surface contribution is further reduced.
10
For snow-covered areas, the reflectance at 1240 nm is used. The snow reflectance is considerably lower at 1240 nm as compared to the reflectance at 412 nm. The gaseous absorption is weak at 1240 nm (see Fig. 2).
The cloud top height is obtained using the fact that clouds screen oxygen in the lower atmosphere, thereby reducing the strength of the reflection function minimum close to
15
760 nm (see Fig. 2). There are about 50 measurement points inside the oxygen A-band by SCIAMACHY (Rozanov and Kokhanovsky, 2004). This allows us to estimate not only the cloud top height but also estimate the cloud geometrical thickness, the cloud base altitude, and, as a by-product, the cloud extinction coefficient.
3. Retrieval results
20
3.1. MODIS measurements
To validate the algorithm we have applied SACURA to the MODerate resolutIon Spec-trometer (MODIS) (Platnick et al., 2003) data over the North sea (Terra-MODIS granule from 11 August 2002, 10:28 UTC) and compared the results with those obtained from the well-proved and validated look-up-table (LUT) approach as described by Nakajima
25
ACPD
5, 1995–2015, 2005 Semianalytical cloud retrieval algorithm A. Kokhanovsky et al. Title Page Abstract Introduction Conclusions References Tables Figures J I J I Back Close Full Screen / EscPrint Version Interactive Discussion
EGU
thickness τ, cloud droplet radius aef and cloud liquid water path w. Unlike the LUT approach we are able to obtain results as quickly as the data are acquired because of computational simplicity of our technique. In particular, we used the following analytical expression for the TOA reflection function for cloudy scenes (Kokhanovsky et al., 2003) valid for weakly absorbing optically thick clouds:
5
R= R∞− t exp(−x − y)K (µ)K (µ0). (1)
Here R∞is the reflection function of a semi-infinite cloud having the same local opti-cal characteristics (e.g., cloud phase function and asymmetry parameter g, cloud sin-gle scattering albedo ω0) as the cloud under study, t is the cloud global transmittance given as (Kokhanovsky et al., 2003)
10
t= sinh(y)
sinh(x+ 1.07y), (2)
where x=kτ, y=3(1−g)4 and k=p3(1−ω0)(1−g) is the diffusion exponent of the transport theory.
Values of aef and w do not depend on the wavelength and determine all parameters in Eq. (1) as described by Kokhanovsky et al. (2003). Therefore, taking measurements
15
at two wavelengths, we can retrieve the pair (aef, w). Then one finds the optical thick-ness as 3w/2aefρ, where ρ is the density of water.
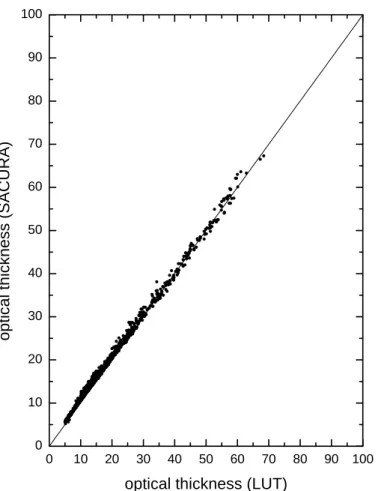
It follows from Fig. 3 that the retrieved cloud optical thickness using SACURA cor-responds well to the more accurate LUT approach. The wavelength used in the LUT retrieval differs from ours. In particular, we used the combination 858/1640 nm and the
20
LUT retrievals are based on the measurements at 645/3700 nm. Retrieved values of the cloud droplet radius are also in good agreement. However, retrievals of aef are more biased (see Fig. 4). This may be related to the fact that different wavelengths sense different volumes of clouds. Remote sensing of clouds using the wavelength 3700 nm is mostly sensitive to droplets in upper parts of the cloud while the radiation
25
ACPD
5, 1995–2015, 2005 Semianalytical cloud retrieval algorithm A. Kokhanovsky et al. Title Page Abstract Introduction Conclusions References Tables Figures J I J I Back Close Full Screen / EscPrint Version Interactive Discussion
EGU
on droplets in more remote cloud areas. Note that the radius retrieved using SACURA at 1640 nm is slightly larger than that which follows from the LUT approach at 3700 nm (see Fig. 4).
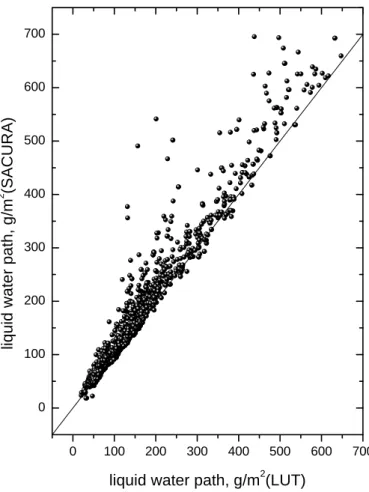
It follows from Fig. 5 that there is generally good agreement in the retrieved value of the liquid water path (especially at values w=50−200 gm−2, which are most typical for
5
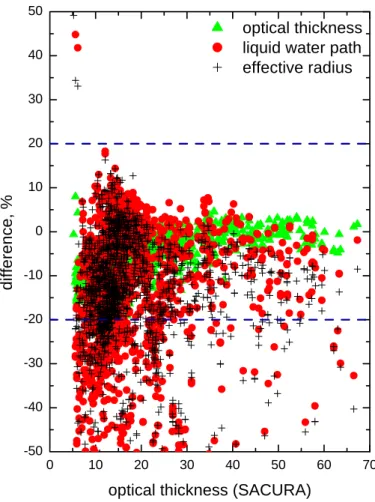
water clouds). The biases in retrievals are summarized in Fig. 6.
We see that the differences do not exceed 20 percent for most of retrievals with largest differences in the retrieved values of aef and w as compared to τ. This may be explained by the differences in the wavelengths used as outlined above. Therefore, we conclude that SACURA gives results comparable to the LUT approach and thereby
10
can be safely used in retrievals of cloud properties from SCIAMACHY. Relatively small differences found (see Fig. 6) should not be considered as limitations of the theory as applied to SCIAMACHY because poor spatial resolution of SCIAMACHY creates more significant biases such as those discussed above. Also the retrieval by the LUT cannot be considered as the absolute truth because of inherent problems with the
15
adequate forward modeling of light propagation in inhomogeneous clouds. Note that we have developed a version of SACURA to be capable of dealing with partly cloudy scenes, which is essential for SCIAMACHY measurements interpretation. However, in this paper we limit ourselves to the case of completely cloudy pixels. The derivation of the cloud cover product from SACURA is still in the testing phase.
20
3.2. Airborne and GOME measurements
The MODIS does not measure TOA reflectance in the oxygen A-Band (755–775 nm), so our technique as applied the cloud top height determination cannot be proved using MODIS measurements. To validate the technique we used airborne measurements of the spectral reflectance described by Daniel et al. (2003), over the cloud system
as-25
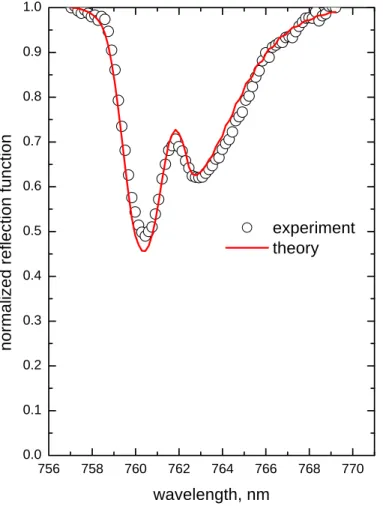
sociated with Hurricane Michelle over the Gulf of Mexico on 3 November 2001. The experimental spectrum analyzed was obtained by a crossed Czerny-Turner spectro-graph at 19:44 UTC and is shown in Fig. 7. The full-width-half-maximum wavelength
ACPD
5, 1995–2015, 2005 Semianalytical cloud retrieval algorithm A. Kokhanovsky et al. Title Page Abstract Introduction Conclusions References Tables Figures J I J I Back Close Full Screen / EscPrint Version Interactive Discussion
EGU
resolution of this instrument is approximately 1.1 nm. The solar zenith angle was ap-proximately equal to 55◦and the observation was performed in the nadir direction from an altitude 13.7 km.
In analyzing the raw data given in Fig. 7, we accounted for the spectral shift and smooth variations in shape (largely slope) of the measured spectrum, in a way similar
5
to that given by Daniel et al. (2003). This is why the measured spectrum given in Fig. 8 differs from that in Fig. 7.
To compare highly resolved model calculations with spectral measurements properly, one must convolve the calculations with the numerical approximation of the instrument function, which will change the relative breadth and depth of the spectral features.
10
We have used the measurement of a single neon transition line as registered by the spectrometer to estimate the instrument function. The high resolution model output was then convolved with this instrument function to obtain a spectrum that can be be appropriately compared with the measurement.
Because the optical thickness of the studied cloud is not known, we made a retrieval
15
assuming a semi-infinite cloud. Crystals are often observed in clouds associated with the presence of a hurricane. Although we found that the choice of the phase function does not influence results significantly, we assumed that the phase function of the cloud could be described by the hexagonal ice scattering model as described by Mishchenko et al. (1999). A fitted theoretical spectrum (normalized to the observed value at 756 nm)
20
is shown by a solid line in Fig. 8.
The calculation given by a solid line corresponds to a cloud top height 8.8 km. The retrieval of Daniel at al. (2003) using their LUT approach estimate the CTH equal to 8.0 km within 1 km of our estimate. Note that the estimate of the cloud top position derived from photographs was in the range 6.2–8.0 km.
25
The SACURA is extremely flexible algorithm allowing for rapid estimations of the influence of the cloud characteristics on the retrieval results. In particular, we found that the assumption of the homogeneous cloud leads to higher CTHs (by approximately 0.5 km) than those retrieved for the cloud with monotonically increasing with height ice
ACPD
5, 1995–2015, 2005 Semianalytical cloud retrieval algorithm A. Kokhanovsky et al. Title Page Abstract Introduction Conclusions References Tables Figures J I J I Back Close Full Screen / EscPrint Version Interactive Discussion
EGU
water content used in the fitting procedure (see Fig. 8).
The assumption of the ice water content profile having two maxima in the cloud reduces the estimate of the cloud top height (by approximately 0.2 km), thereby moving it in the direction close to the photographic estimate and also to results of Daniel et al. (2003) although Daniel et al. (2003) did not account for ice in their retrieval.
5
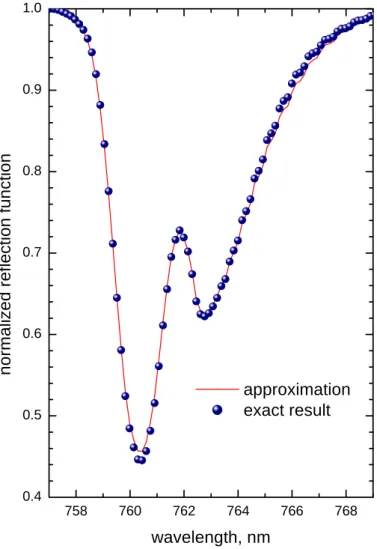
We conclude that SACURA gives results close to the LUT approach described by Daniel et al. (2003). Its high accuracy is evident in Fig. 9, in which we compared a spectrum obtained from our approximation for the reflection function in the oxygen absorption band (Kokhanovsky and Rozanov, 2004) with exact spectrum calculated by the numerical solution of the radiative transfer equation in the oxygen absorption band.
10
We see that differences are below 3 percent. They rarely exceed 5 percent as shown by Kokhanovsky and Rozanov (2004). Note that spectra in Fig. 9 were calculated for the same conditions as in Fig. 8.
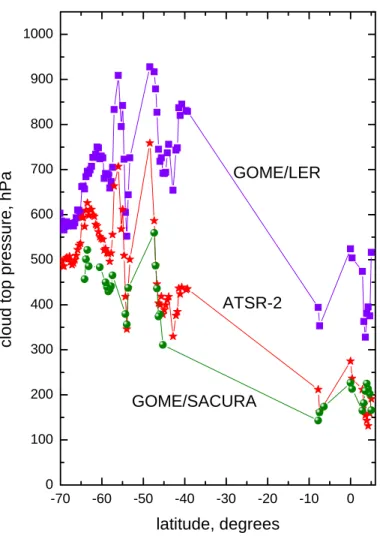
The case considered above was devoted to the consideration of just one spectrum. The accuracy of our technique for the cloud top pressure determination using satellite
15
measurements can be be further probed using Fig. 10, where we show the comparison of SACURA cloud top pressure p retrievals using Global Ozone Monitoring Experiment (GOME) measurements in the oxygen A-band with retrievals obtained based on the ATSR-2 infrared data analysis (Watts et al., 1998). Note that both GOME and ATSR-2 are on the same space platform. The retrieval shown in Fig. 10 is based on GOME
20
measurements for orbit 80324174 of the Earth Remote Sensing Satellite (ERS-2) over Pacific ocean on 28 March 1998. Joiner et al. (2003) have retrieved the Lambertian-equivalent pressure pl for the same orbit. We also show this result in Fig. 10 as a reference. However, note that pl differs from the cloud top pressure retrieved in our paper by definition.
25
The spatial resolution of ATSR-2 is 1 km2while for GOME 40*320 km2or 40*80 km2, depending on the measurement mode. The problem with the different spatial resolution of these instruments was addressed by averaging ATSR-2 data onto the 40*80 km2 GOME pixel size. Only 40*80 km2pixels of GOME have been considered. In particular,
ACPD
5, 1995–2015, 2005 Semianalytical cloud retrieval algorithm A. Kokhanovsky et al. Title Page Abstract Introduction Conclusions References Tables Figures J I J I Back Close Full Screen / EscPrint Version Interactive Discussion
EGU
we see that the application of SACURA to GOME data gives results close to the ATSR-2 retrievals.
4. Conclusions
Our comparisons show that SACURA is an accurate and flexible tool to study cloud properties using SCIAMACHY data. More details on applications of SACURA to
5
MODIS data and comparisons with the LUT approach for clouds over both land and ocean are given by Nauss et al. (2005). Our next paper (see this issue) is devoted to application of SACURA to MERIS and SCIAMACHY measurements.
Acknowledgements. MODIS data have been provided by NASA via Marburg Satellite Station. This work has been funded by the BMBF via GSF/PT-UKF and by the DFG BU 688/8-1 and
10
BMBF 07 GWK 04 Projects. We are grateful to J. Joiner (NASA) for providing data for Fig. 10 (ATSR-2 and GOME/LER) in a tabular form. European Space Agency, the UK Natural Envi-ronment Research Council and the Rutherford Appleton Laboratory are acknowledged for their support in supplying ATSR-2 and GOME data.
References
15
Bovensmann, H., Burrows, J. P., Buchwitz, M., Frerick, J., No ¨el, S., Rozanov, V. V., Chance, K. V., and Goede, A. P. H.: SCIAMACHY: Mission objectives and measurement methods, J. Atmos. Sci., 56, 127–150, 1999.
Daniel, J. S., Solomon, S., Miller, H. L., Langford, A. O., Portmann, R. W., and Eubank, C. S.: Retrieving cloud information from passive measurements of solar radiation absorbed by
20
molecular oxygen and O2− O2, J. Geophys. Res., 103, doi:10.1029/2003JD003968, 2003. Joiner, J. S., Vasilkov, A. P., Flittner, D. E., Gleason, J. F., and Bhartia, P. K.: Retrieval of
cloud pressure and oceanic chlorophyll content using Raman scattering in GOME ultraviolet spectra, J. Geophys. Res., 104, doi:10.1029/2003JD003968, 2004.
ACPD
5, 1995–2015, 2005 Semianalytical cloud retrieval algorithm A. Kokhanovsky et al. Title Page Abstract Introduction Conclusions References Tables Figures J I J I Back Close Full Screen / EscPrint Version Interactive Discussion
EGU
Kokhanovsky, A. A. and Rozanov, V. V.: The reflection function of optically thick weakly ab-sorbing turbid layers: a simple approximation, J. Quant. Spectr. Rad. Transfer, 77, 165–175, 2003.
Kokhanovsky, A. A., Rozanov, V. V., Zege, E. P., Bovensmann, H., and Burrows, J. P.: A semian-alytical cloud retrieval algorithm using backscattered radiation in 0.4–2.4 µm spectral region,
5
J. Geophys. Res., 103, doi:10.1029/2001JD001543, 2003.
Mishchenko, M. I., Dlugach, J. M., Yanovitskij, E. G., and Zakharova, N. T.: Bidirectional re-flectance of flat, optically thick particulate layers: an efficient radiative transfer solution and applicatioins to snow and soil surfaces, J. Quant. Spectr. Rad. Transfer, 63, 409–432,1999. Rozanov, V. V. and Kokhanovsky, A. A.: Semianalytical Cloud retrieval algorithm as
ap-10
plied to the cloud top altitude and the cloud geometrical thickness determination from top-of-atmosphere reflectance measurements in the oxygen A band, J. Geophys. Res., 104, doi:10.1029/2003JD004104, 2004.
Nakajima, T. Y. and Nakajima, T.: Wide-area determination of cloud microphysical properties from NOAA AVHRR measurements for FIRE and ASTEX regions, J. Atmos. Sci., 52, 4043–
15
4059, 1995.
Nauss, T., Kokhanovsky, A. A., Nakajima, T. Y., Reudenbach, C., and Bendix, J.: The intercom-parison of cloud retrieval algorithms, Atmos. Res., in press, 2005.
Platnick, S., King, M. D., Ackerman, S. A., Menzel, W. P., Baum, B. A., Riedi, J. C., and Frey, R. A.: The MODIS cloud products: Algorithms and examples from Terrs, IEEE Trans. on
20
Geosci. and Rem. Sens., 41, 459–473, 2003.
Watts, P. D., Mutlow, C. T., Baran, A. J., and Zavody, A. M.: Semianalytical Study on cloud prop-erties derived from Meteosat Second Generation Observations, ITT no 97/181, EUMETSAT, Darmstadt, Germany (seehttp://www.eumetsat.de), 344, 1998.
ACPD
5, 1995–2015, 2005 Semianalytical cloud retrieval algorithm A. Kokhanovsky et al. Title Page Abstract Introduction Conclusions References Tables Figures J I J I Back Close Full Screen / EscPrint Version Interactive Discussion EGU 0 400 800 1200 1600 2000 2400 0.1 0.2 0.3 0.4 0.5 water ice ref lect ion f unct ion wavelength, nm
ACPD
5, 1995–2015, 2005 Semianalytical cloud retrieval algorithm A. Kokhanovsky et al. Title Page Abstract Introduction Conclusions References Tables Figures J I J I Back Close Full Screen / EscPrint Version Interactive Discussion EGU 0 500 1000 1500 2000 2500 0.0 0.1 0.2 0.3 0.4 0.5 0.6 0.7 0.8 0.9 1.0 CDR CTH COT O2-A ref lect ion f unct ion wavelength, nm
Fig. 2. The reflection function of a water cloud with and without account for the gaseous absorption calculated at the same conditions as in Fig. 1 but using the exact radiative transfer equation solution at τ=20. The cloud geometrical thickness was assumed to be equal to 1 km and cloud top height was equal to 6 km.
ACPD
5, 1995–2015, 2005 Semianalytical cloud retrieval algorithm A. Kokhanovsky et al. Title Page Abstract Introduction Conclusions References Tables Figures J I J I Back Close Full Screen / EscPrint Version Interactive Discussion EGU 0 10 20 30 40 50 60 70 80 90 100 0 10 20 30 40 50 60 70 80 90 100 opt ical t h ickness (SACURA)
optical thickness (LUT)
Fig. 3. The correaltion between the cloud optical thicknesses retrieved using SACURA and LUT.
ACPD
5, 1995–2015, 2005 Semianalytical cloud retrieval algorithm A. Kokhanovsky et al. Title Page Abstract Introduction Conclusions References Tables Figures J I J I Back Close Full Screen / EscPrint Version Interactive Discussion EGU 0 2 4 6 8 10 12 14 16 18 20 22 24 26 28 30 0 2 4 6 8 10 12 14 16 18 20 22 24 26 28 30 ef fe ct ive radius, µ m(SACURA)
effective radius, µm(LUT)
ACPD
5, 1995–2015, 2005 Semianalytical cloud retrieval algorithm A. Kokhanovsky et al. Title Page Abstract Introduction Conclusions References Tables Figures J I J I Back Close Full Screen / EscPrint Version Interactive Discussion EGU 0 100 200 300 400 500 600 700 0 100 200 300 400 500 600 700 liquid wat e r pat h, g/ m 2 (SACURA)
liquid water path, g/m2(LUT)
ACPD
5, 1995–2015, 2005 Semianalytical cloud retrieval algorithm A. Kokhanovsky et al. Title Page Abstract Introduction Conclusions References Tables Figures J I J I Back Close Full Screen / EscPrint Version Interactive Discussion EGU 0 10 20 30 40 50 60 70 -50 -40 -30 -20 -10 0 10 20 30 40 50 dif fe rence, %
optical thickness (SACURA)
optical thickness liquid water path effective radius
ACPD
5, 1995–2015, 2005 Semianalytical cloud retrieval algorithm A. Kokhanovsky et al. Title Page Abstract Introduction Conclusions References Tables Figures J I J I Back Close Full Screen / EscPrint Version Interactive Discussion EGU 660 680 700 720 740 760 780 800 400 600 800 1000 1200 1400 1600 1800 2000 2200 H 2O H2O O 2-A O2-B ref lect ed light int ensit y , a. u. wavelength, nm Fig. 7. The measured spectrum.
ACPD
5, 1995–2015, 2005 Semianalytical cloud retrieval algorithm A. Kokhanovsky et al. Title Page Abstract Introduction Conclusions References Tables Figures J I J I Back Close Full Screen / EscPrint Version Interactive Discussion EGU 756 758 760 762 764 766 768 770 0.0 0.1 0.2 0.3 0.4 0.5 0.6 0.7 0.8 0.9 1.0 normalized ref lect ion f unct ion wavelength, nm experiment theory
Fig. 8. The measured (circles) and fitted (a solid line) spectra. Other parameters are specified
ACPD
5, 1995–2015, 2005 Semianalytical cloud retrieval algorithm A. Kokhanovsky et al. Title Page Abstract Introduction Conclusions References Tables Figures J I J I Back Close Full Screen / EscPrint Version Interactive Discussion EGU 758 760 762 764 766 768 0.4 0.5 0.6 0.7 0.8 0.9 1.0 normalized ref lect ion f unct ion wavelength, nm approximation exact result
ACPD
5, 1995–2015, 2005 Semianalytical cloud retrieval algorithm A. Kokhanovsky et al. Title Page Abstract Introduction Conclusions References Tables Figures J I J I Back Close Full Screen / EscPrint Version Interactive Discussion EGU -70 -60 -50 -40 -30 -20 -10 0 0 100 200 300 400 500 600 700 800 900 1000 GOME/SACURA GOME/LER ATSR-2 cloud t op pressure, hPa latitude, degrees
Fig. 10. The comparison with retrievals using infrared measurements performed by ATSR-2