HAL Id: hal-00297012
https://hal.archives-ouvertes.fr/hal-00297012
Submitted on 21 Jun 2007
HAL is a multi-disciplinary open access
archive for the deposit and dissemination of
sci-entific research documents, whether they are
pub-lished or not. The documents may come from
teaching and research institutions in France or
abroad, or from public or private research centers.
L’archive ouverte pluridisciplinaire HAL, est
destinée au dépôt et à la diffusion de documents
scientifiques de niveau recherche, publiés ou non,
émanant des établissements d’enseignement et de
recherche français ou étrangers, des laboratoires
publics ou privés.
Development and application of the modelling system
J2000-S for the EU-water framework directive
M. Fink, P. Krause, S. Kralisch, U. Bende-Michl, W.-A. Flügel
To cite this version:
M. Fink, P. Krause, S. Kralisch, U. Bende-Michl, W.-A. Flügel. Development and application of the
modelling system J2000-S for the EU-water framework directive. Advances in Geosciences, European
Geosciences Union, 2007, 11, pp.123-130. �hal-00297012�
Adv. Geosci., 11, 123–130, 2007 www.adv-geosci.net/11/123/2007/ © Author(s) 2007. This work is licensed under a Creative Commons License.
Advances in
Geosciences
Development and application of the modelling system J2000-S for
the EU-water framework directive
M. Fink1, P. Krause1, S. Kralisch1, U. Bende-Michl2, and W.-A. Fl ¨ugel1
1Institute for Geography, Jena, Germany 2CSIRO Land and Water, Canberra, Australia
Received: 16 January 2007 – Revised: 3 April 2007 – Accepted: 22 May 2007 – Published: 21 June 2007
Abstract. The scientific sound definition of measures to
achieve the goals of the EU water framework directive (WFD) acquires spatially distributed analyses of the wa-ter and substance dynamics in meso- to macro-scale catch-ments. For this purpose, modelling tools or systems are needed which are robust and fast enough to be applied on such scales, but which are also able to simulate the impact of changes on single fields or small areas of a specific land use in the catchment.
To face these challenges, we combined the fully-distributed hydrological model J2000 with the nitrogen trans-port routines of the Soil Water Assessment Tool SWAT model, which are normally applied in a semi-distributive ap-proach. With this combination, we could extend the quan-titative focus of J2000 with qualitative processes and could overcome the semi-distributed limitation of SWAT. For the implementation and combination of the components, we used the Jena Adaptable Modelling System JAMS (Kralisch and Krause, 2006) which helped tremendously in the rela-tively rapid and easy development of the new resultant model J2000-S (J2000-Substance).
The modelling system was applied in the upper Gera wa-tershed, located in Thuringia, Germany. The catchment has an area of 844 km2 and includes three of the typical land-scape forms of Thuringia. The application showed, that the new modelling system was able to reproduce the daily hy-drological as well as the nitrogen dynamics with a sufficient quality. The paper will describe the results of the new model and compare them with the results obtained with the original semi-distributed application of SWAT.
Correspondence to: M. Fink
1 Introduction
With the commencement of the “Common Implementation Strategy” of the European Framework Directive (EU-WFD) in the year of 2000 an European wide law is implemented to protect the various types of water bodies (Directive, 2000/60/EC). One of the main objectives of the EU-WFD is to reach a good hydrochemical standard within the timescale of 15 years. In many cases, the attainment of this good hydro-chemical target is jeopardized by adverse impacts of nutrient loads from diffuse sources.
For the analysis, prediction and management of water-sheds with nutrient problems, simulation models that de-scribe the water and nutrient dynamics might be considered as useful tools. One widely used model for water and nutrient dynamics in catchment scale is the Soil Water Assessment Tool (SWAT) (Arnold et al., 1998). An application of SWAT in the Gera catchment showed its principle applicability in this region. Because measurements which aim at a tion of nutrients from diffuse sources, e.g. fertilizer reduc-tion, land use change, or planting of catch crops, take place on single agricultural fields, such fields should be represented by the distribution concept of models used for their simu-lation. This is of even greater importance when the model should be used for prognostic scenario simulations. Because of its semi-distributive character SWAT was not able to repre-sent single agricultural fields as model entities. It was judged that a fully distributive regionalisation approach is needed, like the topological Hydrological Response Units concept of J2000 (Krause, 2001, 2002), which is a polygon-based ap-proach that is able to represent any geometry that is needed. To use the well tested SWAT routines to describe the nitro-gen dynamics together with the fully distributed hydrological components of J2000, we restructured the relevant SWAT al-gorithms into JAMS-compliant JAVA components. By the combination of these new components with the existent hy-drological parts, the new model J2000-S was formulated.
124 M. Fink et al.: Development and application of the modelling system J2000-S
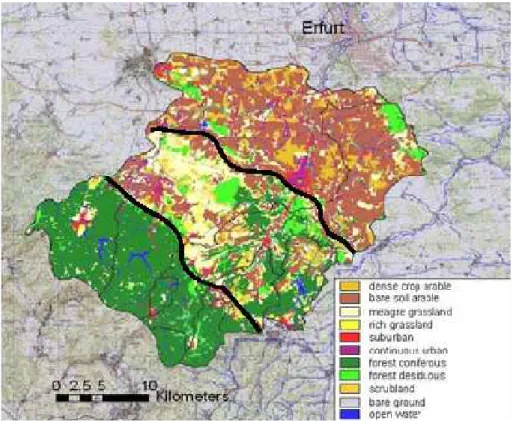
Fig. 1. Landuse (September 1999) of the geographic regions of the 843 km2large Gera river System.
The work was conducted in collaboration with the “Thuringian Environmental Agency”. We choose the Gera catchment as test catchment, because it includes many repre-sentative landscape types of Thuringia.
2 Study area
For the testing of the newly developed model the upper Gera catchment located in Thuringia, Germany, was selected. With an area of 844 km2, it is a typical meso-scale catchment, which is located on the northern bound of the middle moun-tain range of the Thuringian forest and south of the city of Erfurt (Fig. 1). The main streams in the catchment are the Gera River itself, which drains the central part from south to north, the Apfelst¨adt River which drains the western part and the Wipfra River which drains the eastern part of the catch-ment.
The primary reason for the selection of this catchment for demonstrating application of this new model was the natural conditions, in terms of land use, soils and geology which can be considered as representative for Thuringia. The catchment itself features three specific landscape forms (ordered from southwest to the northeast):
– The “Th¨uringer Wald (Thuringian Forest)” (600 to
980 m a.s.l.) is underlain by impermeable granite and
porphyry rocks (Seidel, 2003). The dominant land use consists of coniferous forest. Evapotranspiration on an annual basis is estimated to be less than 30% of the an-nual precipitation, which results in a high runoff gener-ation dominated by interflow (Table 1);
– The “Ilm-Saale-Ohrdrufer-Shell-Limestone” (300– 600 m a.s.l.) mainly consists of underlying limestone, dolomite and calcite shales, which locally exhibit karstfeatures. Land use is a mixture of forest, pasture, meadows and crops. The annual precipitation is reduced by 40% compared to the mountainous part; whereas, the ET is somewhat higher, which results in a significant reduction of runoff generation. The dominant runoff components are interflow and baseflow depending on specific location;
– The “Inner-thuringian agricultural hill-land” (200–
300 m a.s.l.): geology exhibits an alternating stratifica-tion of marlstones and sandstones. It is overlain by loess deposits that provide a high degree of soil fertil-ity, resulting in productive crop land use. Precipitation is again reduced and ET increased, which results in a quitelow runoff generation. Because of the soil, geology and the topographic conditions, groundwater recharge within this land form is the dominant runoff generation process.
M. Fink et al.: Development and application of the modelling system J2000-S 125
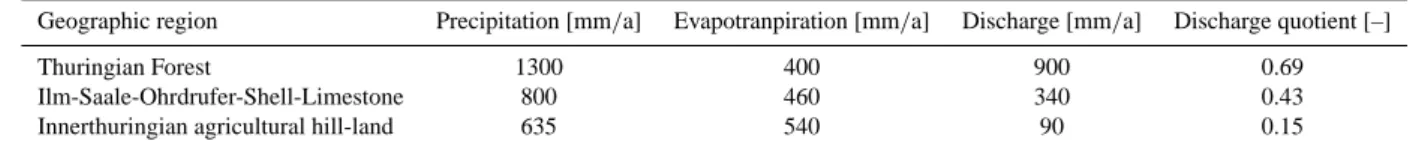
Table 1. Regional longterm water balance of the three major geographic regions within the Gera catchment (Bende-Michl et al., 2005). Geographic region Precipitation [mm/a] Evapotranpiration [mm/a] Discharge [mm/a] Discharge quotient [–]
Thuringian Forest 1300 400 900 0.69
Ilm-Saale-Ohrdrufer-Shell-Limestone 800 460 340 0.43
Innerthuringian agricultural hill-land 635 540 90 0.15
Besides the natural karst features mentioned above, it should be noted that a couple of reservoirs are located within the catchment; these impoundments affect the flow condi-tions exhibited within the catchment.
3 Modelling approach
In order to provide baseline simulations of the hydrological and the nutrient transport dynamics, the two models J2000 and SWAT initially were applied independently. The re-sults of the hydrological modeling are described in detail in Krause et al. (2006) and of the SWAT application in (Bende-Michl et al., 2006).
The Soil Water Assessment Tool (SWAT) was devel-oped for the identification and quantification of (assumed and tested) nutrient source areas by the simulation of key bio-geo-chemical processes and interactions, tracking of nutrient-load generation from land to water by main transport pathways as well as for evaluating of potential management scenarios in meso- or large-scale catchments, as addressed by the EU-WFD (Arnold and Fohrer, 2005; Haverkamp et al., 2004; H¨ormann et al., 2005).
The J2000 is a modular process-oriented hydrological sys-tem, which implements single hydrological processes as en-capsulated process modules. Beside the process modules for the simulation of the runoff generation and runoff con-centration dynamics, J2K offers routines for the regionalisa-tion and correcregionalisa-tion of climate data, the calcularegionalisa-tion of addi-tional input data e.g. solar radiation, potential evapotranspi-ration according to Penman-Monteith or absolute humidity, which are often not available as measured values. In addi-tion, tools for sensitivity and uncertainty analysis as well as plotting capabilities to produce diagrams of the model re-sults are available. The temporal resolution of J2000 is in either daily or hourly time steps (specified by the user). Spa-tial resolution or catchment distribution is made using the hydrological response units (HRUs) which are connected by a lateral routing scheme to simulate lateral water transport processes. This allows a fully-distributed hydrological mod-elling of catchments (Krause et al., 2006). The implementa-tion of the nitrogen-balance algorithms of SWAT in J2000-S is described at Bende-Michl et al. (2006).
Because of the geological conditions, karstic features ap-pear in part of the Gera catchment. as river ’sinks’ (reaches losing water to the channel) which are delineated for the
different tributaries and the mainstem Gera River. Unfortu-nately the total or relative amount of water that is lost in these sink areas has never been measured or estimated. Nonethe-less, their effects can be estimated from a water-balance anal-ysis, in particular, during low-flow periods. To account for such processes, we developed and implemented a conceptual approach (1) to describe such flow losses, as:
Qd= L ∗ RH2∗ Ksink (1)
Where Qd is the amount of water that leaves the system due to a channel sink, L is the length of the stream segment, RH is the hydraulic radius and Ksinkis a calibration
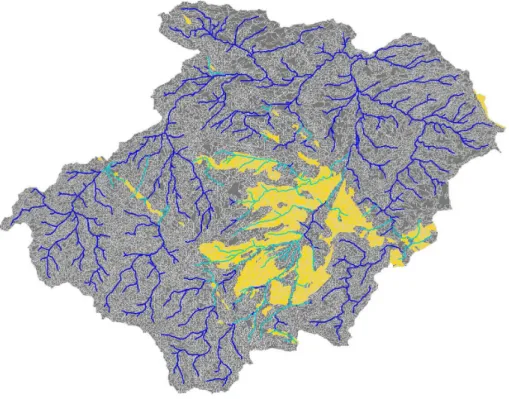
param-eter which can be related to the hydraulic conductivity of the stream bed. RH is squared because when the water level rises the stream width generally increases as well. Also, the gradient from the stream’s water surface to the groundwater layer increases with higher water level which conceptually is described by the square of RH . The amount of nitrogen thereby removed from the streams is calculated with the help of actual nitrogen concentrations in the affected stream seg-ment. This water and nutrient-loss aspect applies only in the limestone regions as shown in Fig. 2.
Because the spatial resolution of the semi-distributed model SWAT with its unlocated HRUs and subcatchments (Fig. 3), we implemented the relevant algorithms of SWAT into the fully distributive model J2000 in order to gain a higher resolution of results. The implementation of the ni-trogen balance algorithms of SWAT in J2000-S is described by (Bende-Michl et al., 2006).
3.1 Input data
The application of both models requires GIS-based data, such as topography, geology, soils and land-use information. A 25×25 m DEM was available to delineate the subcatch-ments, their effective slope and aspect, and soil information was derived based on the soil map “Die Leitbodenformen Th¨uringens” 1:100 000 (Rau et al., 1995). From the legend description for the soil horizons, field capacity and hydraulic conductivity were extracted. Information of the underlying bed rock was obtained from the geological map (“Geolo-gische ¨Ubersichtskarte 1:200 000”), which was also used to identify regions with karst features. Land cover information was derived from two land-use classifications (Fig. 1) from Landsat TM images of the years 1999 and 2002. For the initial SWAT modelling application, information regarding
126 M. Fink et al.: Development and application of the modelling system J2000-S
Fig. 2. Limestone regions (yellow) and rivers where deep sink is active(cyan) of the Gera catchment.
Fig. 3. Distribution concepts of SWAT and J2000.
land-use management was using classification for the year 2002 only. For the J2000-S modelling application, infor-mation was obtained by a fusion of different maps from the relevant Thuringian state agencies; however, both methods showed very similar results. Consumption of crop specific fertilizer was estimated from literature studies (TLL, 2001) and from farmer interviews conducted in a nearby catchment (Fink, 2004). The results used as model inputs are shown in Table 2.
Climatological time series data were available at three 3 synoptic climate stations and 14 precipitation stations in the vicinity of the Gera catchment. Runoff data from four gauges
Table 2. Crop types and fertilization for different regions of the
Gera catchment (Bende-Michl et al., 2005).
Crop [kgN/ha ∗ a] [kgN/ha ∗ a] “intensive” “less intensive” Winter wheat 178 164 Maize 202 – Summer barley 106 – Winter barley 178 164 Rape 202 176 Peas – 50 Fallow – 0 Meadow 60 60
were used for model calibration and validation. All hydro-meteorological data were available in daily time steps. Hy-drochemical datasets of interest comprised of, besides major cations and anions, the nitrogen components, such as ammo-nia, nitrite and nitrate. Such data were available from mea-suring network of the state Thuringia.
3.2 Modelling results SWAT
For the baseline simulation, SWAT initially was applied in its original form. Figure 4 compares the predicted and mea-sured runoff for the period of 1/1994 to 11/2000. It is obvious
M. Fink et al.: Development and application of the modelling system J2000-S 127
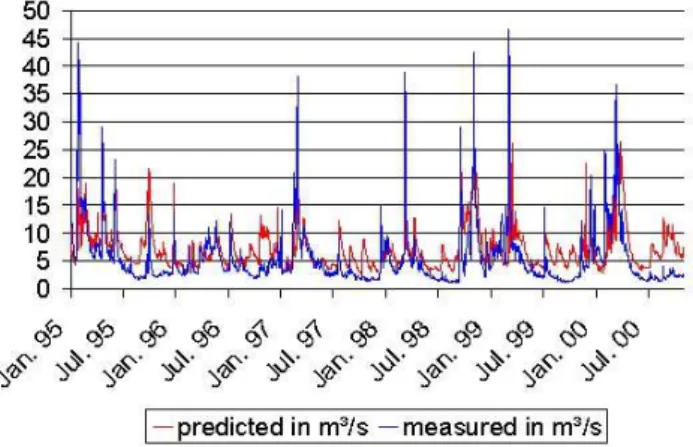
Fig. 4. Predicted and measured discharge at the catchment outlet
(M¨obisburg).
from the plot that, during low-flow periods, the simulated runoff showed a significant overprediction much of the time. Comparable peak flows matched better but did also exhibit occasionally poor model results. In general, it can be con-cluded that the hydrological dynamic processes of the Gera catchment could not be represented well with SWAT. This can also be seen from the long-term average runoff which gave a simulated average of 6.8 m3/s; whereas, the measured discharge was only 5.8 m3/s. This overprediction of 17% can to some extent be related to the effects of the karst features as discussed above. Such discharge losses can not be de-scribed adequately in SWAT. The efficiency “Eff” (Nash and Sutcliffe, 1970) for the whole period was 0.51 which com-prises “Eff” of 0.27 for the calibration period (1998–2000) and 0.60 for the validation period (1994–1997).
The SWAT modelling results of the nitrogen-load dynam-ics are given in Fig. 5. The figure indicates in general that the level and the dynamics of the prediction are more or less corresponding to the measured values but overall were over-predicted during low-flow periods. The direct correlation of the measured values with the prediction of the nitrogen load on a daily basis resulted in a poor r2value of 0.25 for the entire period. During the calibration period (1998–2000) r2resulted in a value of 0.36 and during the validation pe-riod (1995–1997) of 0.28. Similar values were calculated for the nitrogen-concentration dynamics, which gave a coef-ficient of determination of 0.29 for the entire period. As a justification of these low values, it has to be noted that the number of prediction-observation pairs used for the calcula-tion of the efficiency measures was relatively low because of the rather large time interval between measurements. The comparison of the simulated long-term average nitrate con-centration of 19.8 mg/l agreed well with the measured value of 22.2 mg NO3/l. A part of 1.4 mg NO3/l of the predicted
value was added from data of the nitrogen loads of wastew-ater treatment plants. The yearly load of these point sources accounts for a total of 64487 kg N/a.
Fig. 5. Predicted and measured nitrogen load at the catchment outlet (M¨obisburg).
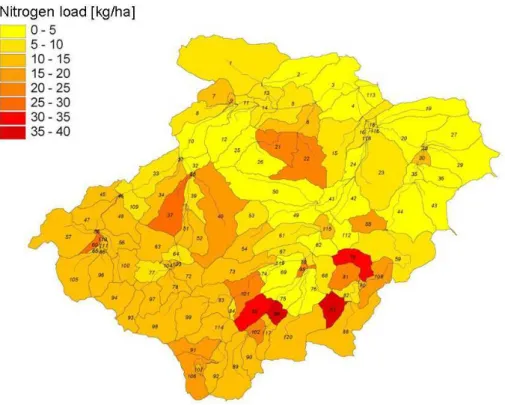
The spatial representation of the modelled nitrogen load is shown in in Fig. 6. The figure shows that higher loads for the southern part of the catchment and lower loads for the northern part were modelled. This indicates that the load distribution in the Gera catchment is highly dominated by the runoff generation processes, already discussed in Sect. 2, which explains the contradiction between land use and ni-trogen load production. The high values in the middle of the southern part of the catchment are caused by a combina-tion of agricultural land use, relatively poor soils and distinct runoff generation. In addition the figure shows the relative poor distribution by subbasins, which is used by SWAT, and which does not allow the detailed identification of responsi-ble source areas.
3.3 Modelling results J2000-S
The runoff modelled with the J2000-S (Fig. 7) showed a much better fit than the SWAT-modelling results (Fig. 3). This can also be seen by the higher Nash-Sutcliffe efficiency of 0.71 and the lower deviation of the simulated long-term mean runoff (5.9 m3/s) from the observed one (5.8 m3/s). The good agreement in the long-term mean indictes that it was possible to consider the flow losses by the karst phenom-ena well with in the model extension described in Sect. 3. The figure indicates that the model results tend to overpre-dict single peak-flow events. This can be explained by the influence of the various water reservoirs in the catchments which is not considered in the model.
The better representation of the hydrological dynamics, together with the higher spatial resolution of the model, resulted also in a better representation of the simulated nitrogen-load dynamics as shown in Fig. 8. A coefficient of determination of 0.64 could be achieved. The fact that the simulation of the nitrogen concentration produced a value of r2=0.28, which is very similar to the SWAT simula-tion, indicated that the major reason for the model improve-ment in terms of nitrogen load is related to the the better representation of the hydrological dynamic. Nevertheless,
128 M. Fink et al.: Development and application of the modelling system J2000-S
Fig. 6. Predicted average annual nitrogen load leached within the derived subcatchments in the Gera catchment (Bende-Michl et al., 2005).
Fig. 7. Predicted and measured discharge at the catchment outlet
(M¨obisburg).
the long-term modelled average nitrate concentration of 23.9 mg/l is still very close to to the observed value of 22.2 mg NO3/l.
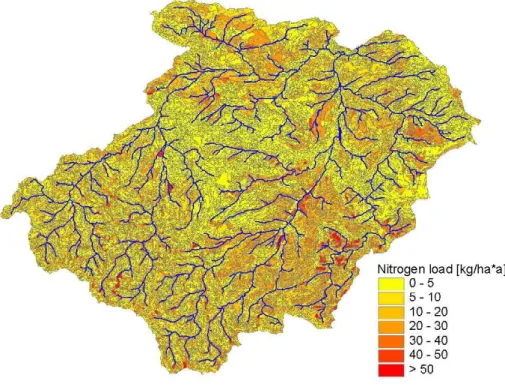
The most important difference between the results from the two models, which was also the driving motivation for the whole work, is the better spatial representation of the model results. This is shown in Fig. 9 which shows the distributed results of the nitrogen output loads using the topographical HRUs of J2000-S. The comparison of this map with the
orig-Fig. 8. Predicted and measured nitrogen load at the catchment outlet (M¨obisburg).
inal SWAT results (Fig. 6) showed many similarities but in a higher spatial resolution. For example, the SWAT map did show 3(4) subbasins with high loads in the middle southern part of the catchment. The better spatially resolved represen-tation of J2000-S could explain that those higher loads were caused by a couple of localized areas in the catchment where agricultural use on poor soils with a low retention capacity, occurred.
M. Fink et al.: Development and application of the modelling system J2000-S 129
Fig. 9. Predicted average annual nitrogen load leached within the derived HRUs in the Gera catchment.
4 Summary and conclusions
The general objective of the study presented here, was to analyse and assess the requirements needed to model diffuse nutrient transport processes in a high spatial distribution in meso-scale catchments. Such modelling is needed for the development of management plans for the EU Water Frame-work Directive.
To provide base line modelling scenarios we firstly ap-plied the hydrological model J2000 and the nutrient transport model SWAT in the Gera catchment in Germany. To use the higher spatial resolution of J2000 with the nutrient transport processes of SWAT we extracted the necessary algorithms and refactured them as JAMS compliant process modules. The combination of the relevant process descriptions from both models resulted in the J2000-S model which was then used for the same catchment and the same time period.
The comparison of the results from both models showed not only differences in the spatial resolution but also in the quality of the simulation in terms of hydrology and nitro-gen transport. With the J2000-S model a Nash-Sutcliffe efficiency for the hydrological dynamics of 0.71 could be achieved which was very much better than those of SWAT model (0.51). The quality of the simulation of nitrogen loads could also be improved by the new model approach which is shown by an increase of r2from 0.25 to 0.64. As the simu-lation of the nitrogen concentrations did not change signifi-cantly with the new model it can be stated that the increase in
the nitrogen load simulation quality can mostly be related to the better reproduction of the hydrological dynamics. Alas, both models had problems with the N-concentration simula-tion, but the long-term balance was met well.
The results show that J2000-S may serve as an adequate tool to support the catchment-related work that has to be done within the scope of the EU-WFD. In particular the higher spatial resolution can be considered as a very important pre-liminary to derive suitable management scenarios. Further improvements in this new model will be the implementation of the phosphorous cycle and of stream water quality rou-tines.
Acknowledgements. The authors wish to acknowledge the kind
cooperation with the “Thuringian Environmental Agency”, Jena, Germany.
Edited by: K.-E. Lindenschmidt Reviewed by: C. Gattke and Y. Wang
References
Arnold, J., Srinivasan, R., Muttiah, R., and Williams, J.: Large Area Hydrologic Modelling and Assessment. Part I, Model Develop-ment, J. Am. Water Resour. As., 34(1), 73–89, 1998.
Arnold, J. R. and Fohrer, N.: SWAT2000: current capabilities and research opportunities in applied watershed modelling, Hydrol. Processes, 19, 563–572, 2005.
Bende-Michl, U., Fink, M., and Fl¨ugel, W.-A.: Application of the SWAT-model for simulation and assessing landuse management
130 M. Fink et al.: Development and application of the modelling system J2000-S
actions according to the European-Framework Directive (EU-FDW), in: MODSIM 2005 International Congress on Modelling and Simulation Modelling and Simulation Society of Australia and New Zealand, edited by: Zerger, A. and Argent, R. M., 2686–2692, 2005.
Bende-Michl, U., Krause, P., Kralisch, S., Fink, M., and Fl¨ugel, W.-A.: Current development and application of the modular Java based model JAMS to meet the targets of the EU-WFD in Ger-many, in: Proceedings of the iEMSs Third Biennial Meeting: “Summit on Environmental Modelling and Software”, edited by: Voinov, A., Jakeman, A., and Rizzoli, A., International Environ-mental Modelling and Software Society, Burlington, USA, 2006. Directive 2000/60/EC of the European Parliament and of the Coun-cil of 23 October 2000 establishing a framework for Community action in the field of water policy, Official Journal of the Euro-pean Communities, L327/1, 2000.
Fink, M.: Regionale Modellierung der Wasser- und Stick-stoffdynamik als Entscheidungsunterst¨utzung f¨ur die Reduk-tion des N-Eintrags am Beispiel des Trinkwassertalsperren-systems Weida-Zeulenroda, Th¨uringen, Jena Friedrich-Schiller-University, Chemisch-Geowissenschaftliche Fakult¨at, Disserta-tion, 2004.
Haverkamp, S., Fohrer, N., and Frede, H.-G.: Assessment of the effect of land use patterns on hydrologic landscape functions: a comprehensive GIS-based tool to minimize model uncertainty resulting from spatial aggregation, Hydrol. Processes, 19, 715– 727, 2005.
H¨ormann, G., Horn, A., and Fohrer, N.: The evaluation of land-use options in mesoscale catchments. Prospects and limitations of ecohydrological models, Eco. Mod. 187, 3–14, 2005.
Kralisch, S. and Krause, P.: JAMS – A Framework for Natural Re-source Model Development and Application, in: Proceedings of the iEMSs Third Biennial Meeting: “Summit on Environmen-tal Modelling and Software”, edited by: Voinov, A., Jakeman, A., and Rizzoli, A., International Environmental Modelling and Software Society, Burlington, USA, 2006.
Krause, P., B¨ase, F., Bende-Michl, U., Fink, M., Fl¨ugel, W., and Pfennig, B.: Multiscale investigations in a mesoscale catchment – hydrological modelling in the Gera catchment, Adv. Geosci., 9, 53–61, 2006,
http://www.adv-geosci.net/9/53/2006/.
Krause, P.: Das hydrologische Modellsystem J2000 – Beschrei-bung und Anwendung in groen Flugebieten, Schriften des Forschungszentrums J¨ulich, Reihe Umwelt/Environment, 29, 2001.
Krause, P.: Quantifying the impact of land use changes on the water balance of large catchments using the J2000 model, Phys. Chem. Earth, 27, 663–667, 2002.
Nash, J. and Sutcliffe, J.: River Flow Forecasting through Concep-tual Models – Part I: A Discussion of Principles, Jo. Hydrol., 10, 282–290, 1970.
Rau, D., Schramm, H., and Wunderlich, J.: Die Leitbodenformen Th¨uringens, Geowissenschaftliche Mitteilungen von Th¨uringen, Beiheft 3, 1995.
Seidel, G. (Ed.): Geologie von Th¨uringen, Stuttgart, 2003. Th¨uringer Landesanstalt f¨ur Landwirtschaft (TLL): Anleitung
und Richtwerte f¨ur N¨ahrstoffvergleiche nach D¨ungeverodnung, Th¨uringer Landesanstalt f¨ur Landwirtschaft, Jena, 2001.